Bitcoin trades sideways as Trump blames Powell again!
U.S. President Donald Trump has repeatedly criticized Federal Reserve Chairman Jerome Powell for not cutting interest rates over the past few months.
Last month, the Federal Reserve kept the target range for the federal funds rate between 4.25% and 4.5%, citing "inflation still somewhat elevated," as explained in its official statement. And now, with the central bank's June 17-18 meeting approaching, President Donald Trump has made his point without mincing words.
"ADP data is out!!! It's 'too late' Powell has to cut rates now," the president posted on Truth Social. "He can't believe it!!! Europe has already cut nine times!"
Indeed, in a press release released Wednesday morning by Roseland, New Jersey-based staffing firm ADP, the private sector created just 37,000 jobs in May, the slowest pace of hiring in more than two years. Bitcoin was largely flat following the news, fluctuating around the $105,000 threshold throughout the morning. But stocks were slightly higher, with the S&P 500, Nasdaq and Dow Jones up 0.23%, 0.35% and 0.10%, respectively, according to CNBC.
Bitcoin fell slightly by 0.70% over the past 24 hours, trading at $105,234.99 at the time of reporting. The cryptocurrency has lost 2.08% over the past week, with price action today mostly limited to between $104,232.70 and $106,457.19. The entire cryptocurrency market also fell by about the same percentage — 0.72%, according to Coinmarketcap.
Trading volume fell by 6.15% to $44.48 billion as momentum across sectors cooled. Bitcoin’s market cap fell by 0.82% to $2.09 trillion, with its dominance falling by 0.16% to 64.06. BTC futures open interest also fell 2.02% to $70.58 billion, indicating an exit from leveraged bets amid weak price action.
Liquidation activity was significantly lower than usual, with just $62,970 of positions liquidated in the past 24 hours, according to data from Coinglass. However, longs accounted for $56,780 of that total, again putting bulls on the wrong side of the latest market move. Short positions were liquidated for a smaller amount, at just $6,190.
BTCUSDT.P trade ideas

we can witness another sell off in BTCWe can witness another sell-off in BTC. A good buying opportunity will be there.
This is a risky trade.

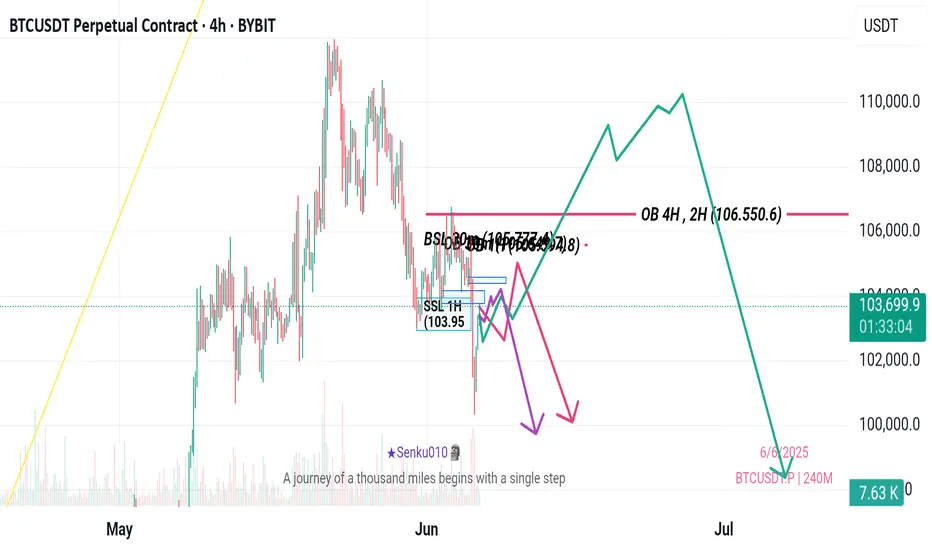
BTC definitive shift to bearish order flow
further downward expansion and the targeting of deeper Sellside Liquidity.
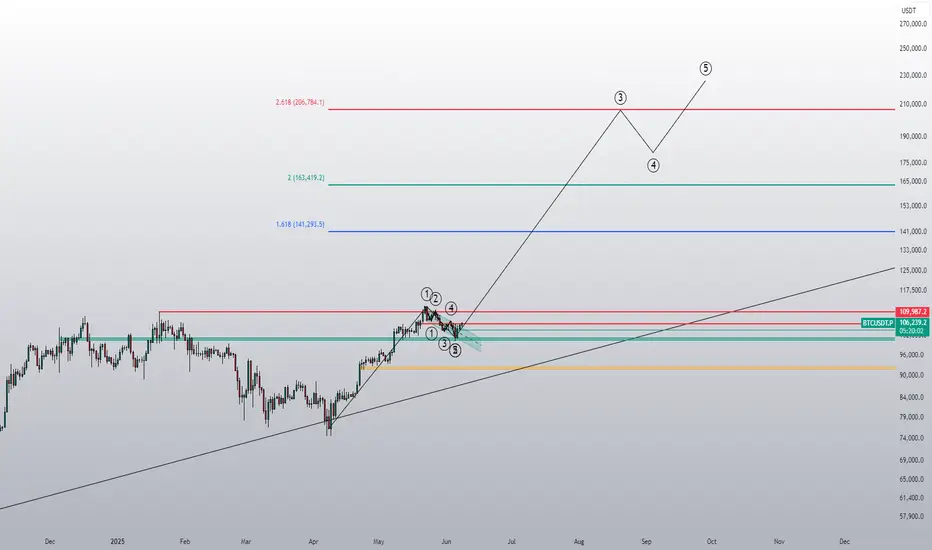
This could go very high!This looks incredibly like a full-send setup, which could blast Bitcoin up to 200k in a wave 3 of an Elliot wave pattern.
BTCUSDT: Sharing of the Latest Trading StrategyAll the trading signals today have resulted in profits!!! Check it!!!👉👉👉
Fundamental Analysis:
The U.S. Senate’s procedural vote on the GENIUS Stablecoin Act could inject significant 合规 capital into the crypto market if passed. Regulatory sentiment has improved following the Trump administration’s push to include Bitcoin in strategic reserves. Concurrently, Bitcoin ETFs recorded over $40B in inflows during May, while Coinbase’s inclusion in the S&P 500 has solidified crypto’s mainstream investment credentials.
Technical Analysis:
Bitcoin is consolidating above $100k, with MACD showing diminished but dominant bullish momentum. RSI at ~55 indicates balanced market forces. On-chain metrics reveal historically low distribution pressure from long-term holders and accelerating retail participation, forming a supportive backdrop for price appreciation.
Trading Recommendation:
Seek long entries on pullbacks. Light positions may be initiated between $103k-$104k.
Trading Strategy:
buy@ 103000–104000
TP:106000-108000
Share accurate trading signals daily—transform your life starting now!
👇 👇 👇 Obtain signals👉👉👉

Bitcoin Trading Strategy for Monday's OpeningThe Bitcoin market as a whole showed a volatile trend this week. The price opened near $105,000 at the beginning of the week, and then fluctuated up and down under the combined influence of news and market sentiment. The highest touched $107,000, and the lowest fell to $101,000. From a daily chart perspective, the price hovered near key levels multiple times, indicating a fierce game between bulls and bears in the market. In terms of trading volume, it decreased compared to last week, suggesting that market participants have a certain wait-and-see attitude at the current price level.
Comprehensive analysis shows that the Bitcoin market will continue to maintain a pattern of multi-empty games next week. If macroeconomic data is positive, there are no major negative news on the policy front, and market sentiment remains stable, the Bitcoin price is expected to break through the short-term resistance level of $105,500 and challenge the resistance level of $107,000 or even higher.
Humans need to breathe, and perfect trading is like breathing—maintaining flexibility without needing to trade every market swing. The secret to profitable trading lies in implementing simple rules: repeating simple tasks consistently and enforcing them strictly over the long term.

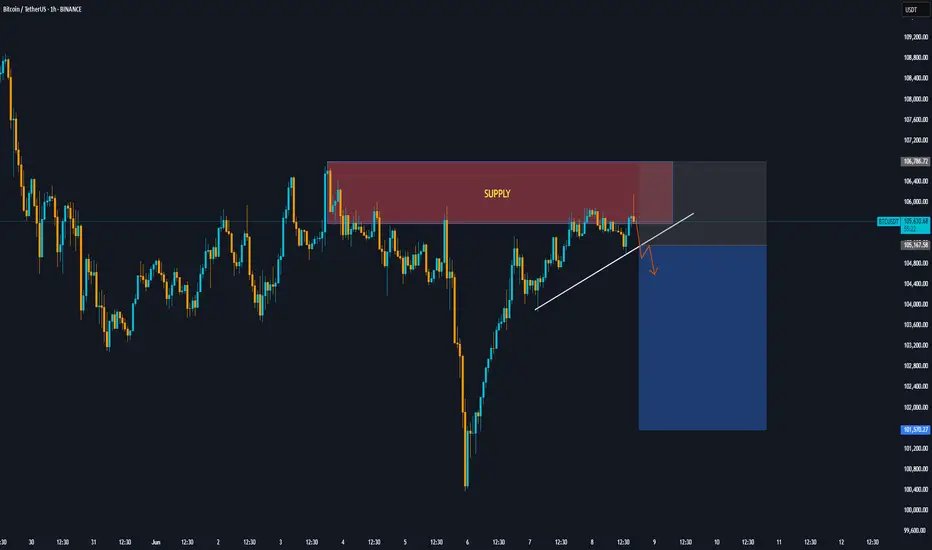
BTC H1 Short area Bitcoin is in a strong supply range, and breaking the trendline allows you to enter a sell position to lower demand areas.
enjoy traders :)
BTC/USD Short: Bearish Flag Targets $101,000Symbol: BTC/USD
Timeframe: 4H
Trade Type: Short
Entry Price: $105,700
Take-Profit: $101,000 (4.4% move, 22% with 5x leverage)
Stop-Loss: $106,500 (0.8% risk, 4% with 5x leverage)
R:R: 5.5:1
Leverage: 5x
Is Bitcoin Repeating Its 2021 Price Action? | TRADEDOTSWe’ve observed that Bitcoin CME:BTC1! appears to be repeating a previous wave pattern. If it follows its historical price action yet again, here’s what we might expect:
2021 Comparison
Back in 2021, Bitcoin formed two large rounded wave structures where the second wave exceeded the first, forming two consecutive all-time highs followed by a huge drawdown. This year’s price action looks very similar to the beginning of the second 2021 waves. If it continues to unfold in the same way, we anticipate a new all-time high before the end of this year, followed by a notable pullback into early next year.
Key Support at $96,000
As long as BTC holds above $96,000, the bullish trend remains intact. This level has shown great demand and volume support, reinforcing its role as the floor for the short-term uptrend.
Upside Potential to $117,000
If buyers continue to support the market above $96,000, BTC could reach the $117,000 region, setting another all-time high. This expectation follows the earlier wave pattern seen earlier this year and completes a close parallel to the 2021 bull run.
Deeper Pullback Expected
After a potential new high, a larger correction is likely. Drawing on previous pullback price action, a 30% dip toward $82,000 could align with a higher-time-frame trendline and significant support area—mirroring the wave structure from 2021.
Final Thoughts
BTC remains structurally bullish above $96,000
A pullback to the $82,000 region could present a key buying opportunity if it occurs.

BTC short scenario BTC will drop to 104.2k first, then maybe we'll see 103k if lucky. Range high range low rotation.
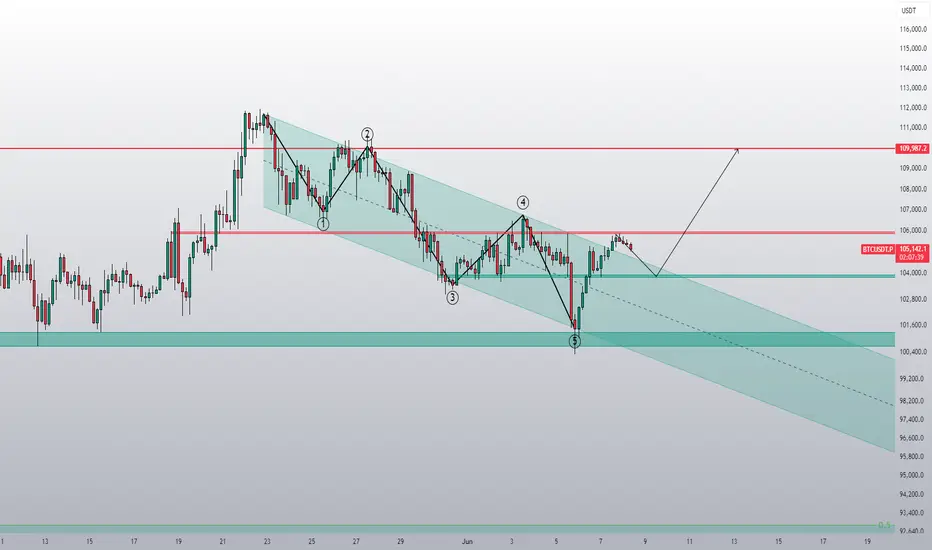
Likely the beginning of a 5-wave sequence North!1). Huge Volume! 2). Banks are Buying! 3). Bonds are up! 4). Dollar weakness!
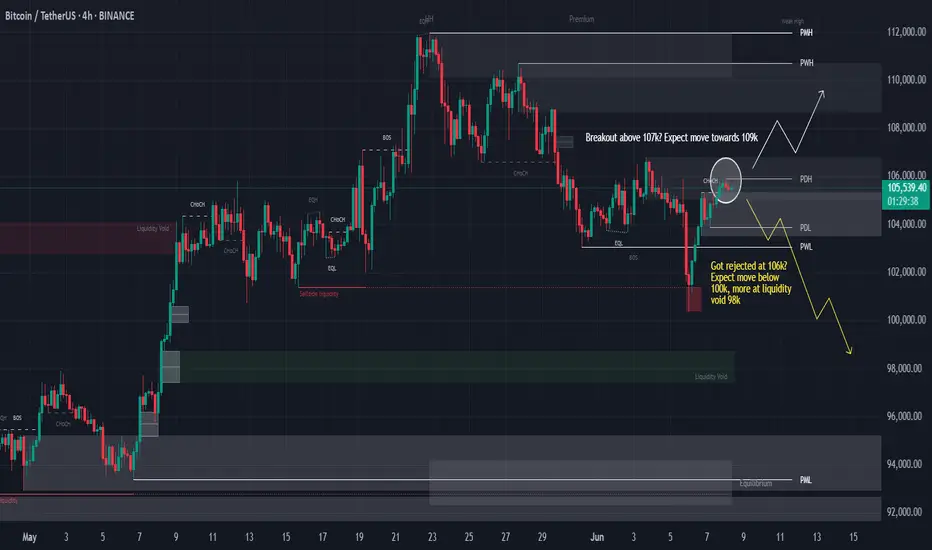
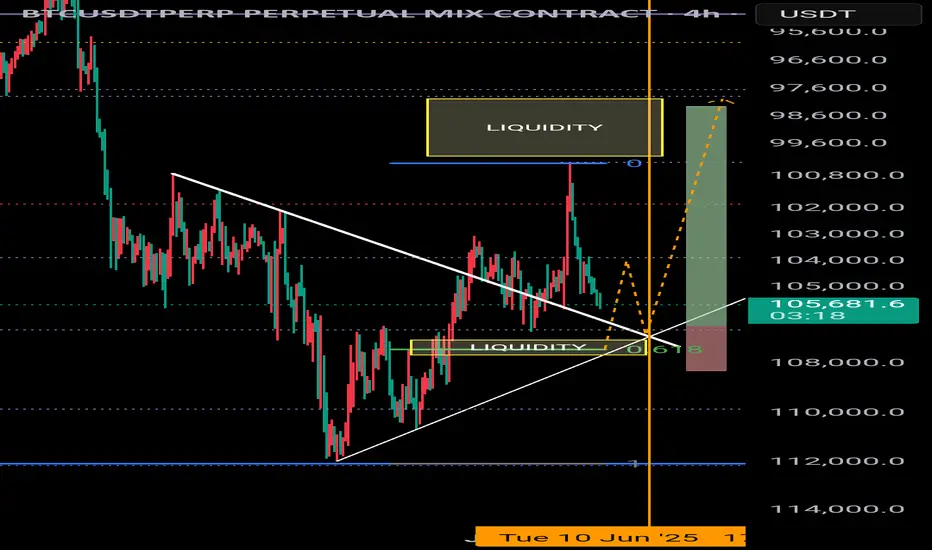
BTC Key Rejection or Breakout? Watch These Zones Closely!Hey fam! 👋 Here’s a clean 4H BTC setup with two key scenarios playing out – and both are packed with juicy liquidity zones and price action signals. Let’s break it down 👇
⚪ White Scenario (Bullish Bias):
1. BTC breaks above 107k – a strong breakout structure.
2. Expect a potential continuation move towards 109k, even eyeing the Premium Zone near 110k–111k if momentum holds.
3. Would confirm bullish intent and sweep weak highs.
🟡 Yellow Scenario (Bearish Bias):
1. BTC got rejected around 106k.
2. If it fails to reclaim 107k, expect a potential move back below 100k, especially if we see another CHoCH confirmation.
3. Watch for price to dive into the liquidity void near 98k, possibly deeper into the PMZ (Premium/Discount Equilibrium) zone.
4. Strong confluence at that Sell-side liquidity zone.
🧠 Key Market Structures:
1. Multiple CHoCHs and BOS visible – price is showing indecision.
2. Equal Highs (EQH) & Equal Lows (EQL) hint at liquidity grabs.
3. Liquidity Voids marked are critical for entries or exits.
📍No bias here, just trade the reaction.
Whether bulls or bears win this round, both scenarios offer clear entry/exit zones if you’re patient and follow structure. 📈📉
📢 Drop your thoughts in the comments – are you team breakout or breakdown?
Follow me for more BTC updates & analysis! 🚀🧠
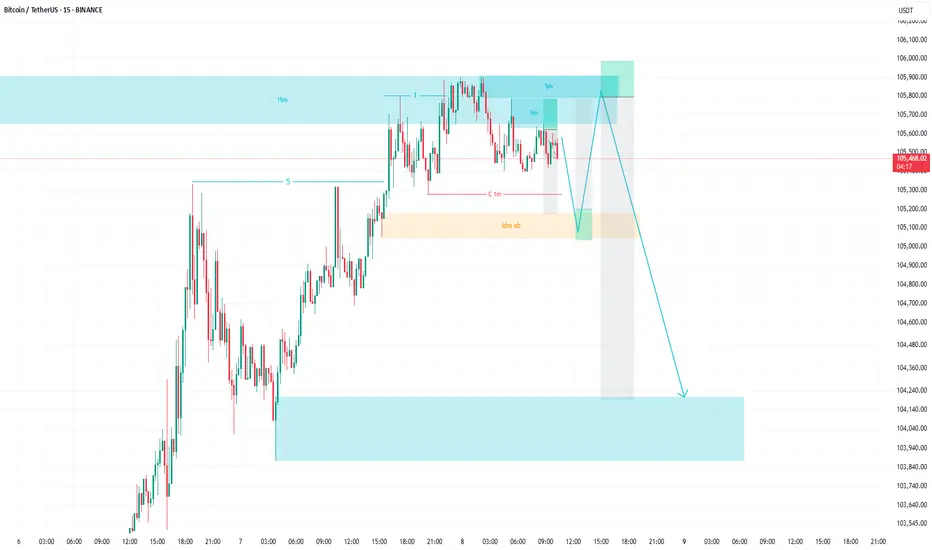
BTC Long: Entry in 104.7-105.1k on PDL Sweep & OB ActionHey everyone! 🚀
BTC is signaling bullish intent:
Clear order flow from the 78.6% Fib level.
HTF structure continues its uptrend 📈.
This points to a potential trend-following LONG opportunity.
🎯 Entry Zone to Watch: 104,783 – 105,127
Confirmation Checklist for Long Entry:
1️⃣ Mitigation of the 4H Order Block .
2️⃣ Liquidity sweep below PDL (Previous Day's Low) into the OB.
3️⃣ Confirmation on the lower timeframe
👀 I’m now waiting to see the price reaction to this Order Block if price reaches it. Stay tuned!
Trade safe and manage your risk!

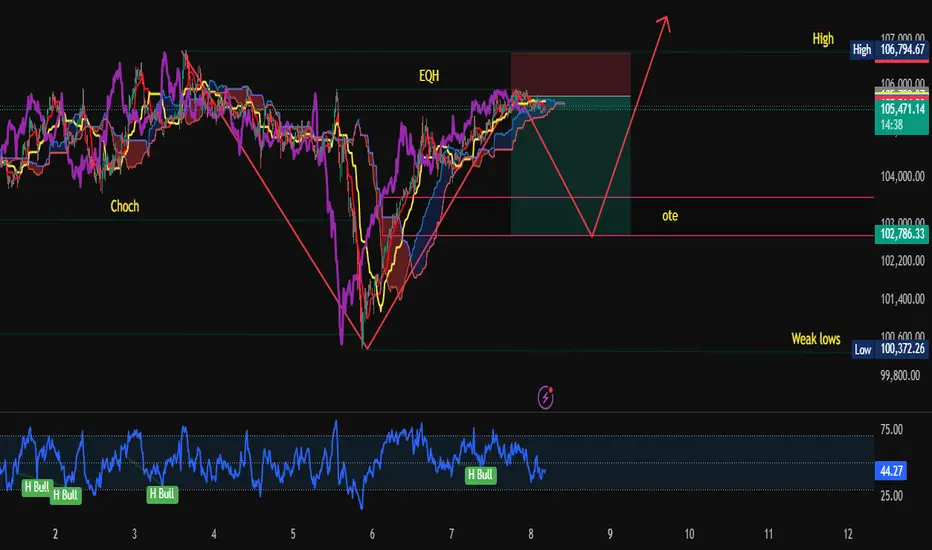
BTS Fibonacci tracing to identify the OTE zone from the lowest point to the highest point. We perceive the crossing of the red tenkan and the yellow kijun moving from the bottom that joins the cloud.
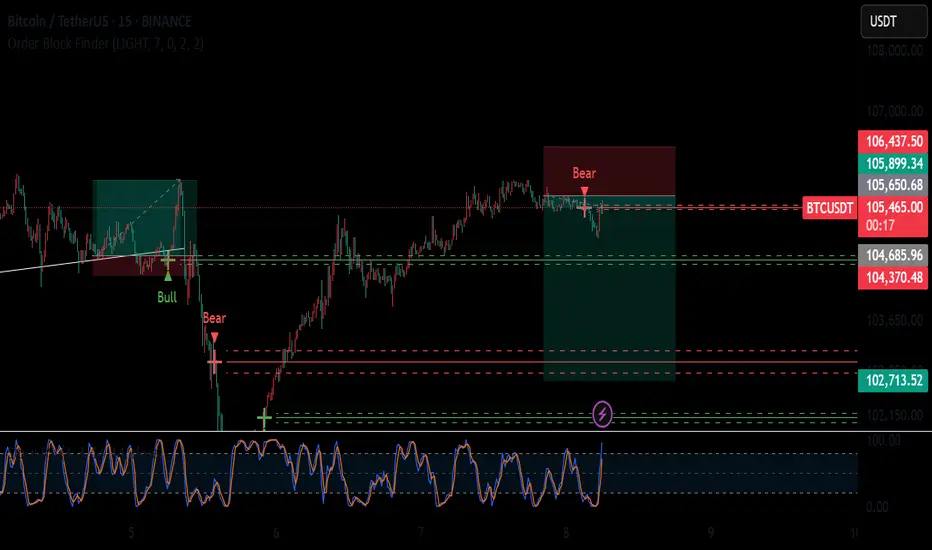
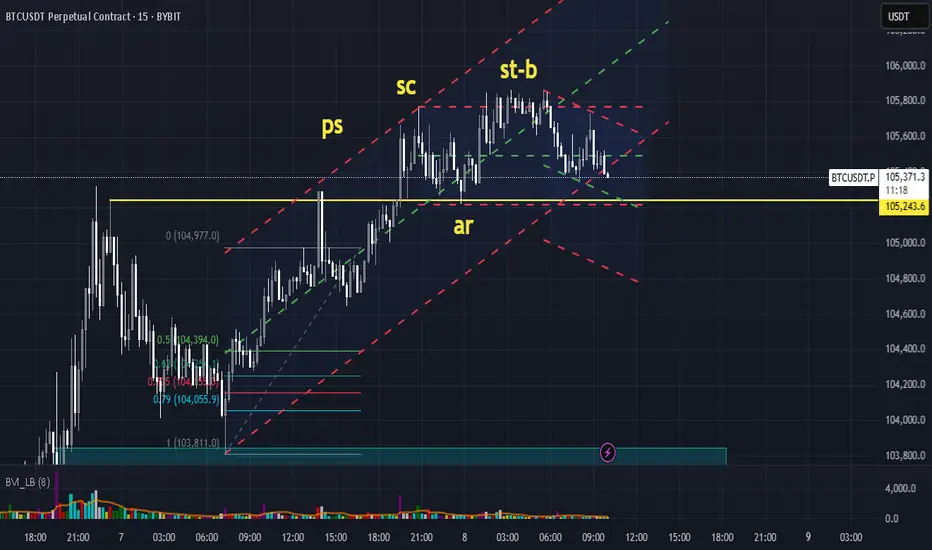
BTC M15 distribution1. PS (Preliminary Support) –
highest volume
2. SC (Selling Climax) –
SC at lower volume and have a bull back
3. AR (Automatic Rally
after SC price is going up with a strong bull back
4. ST-B (Secondary Test in Phase B) –=
Waiting a Spring before crate a phase C
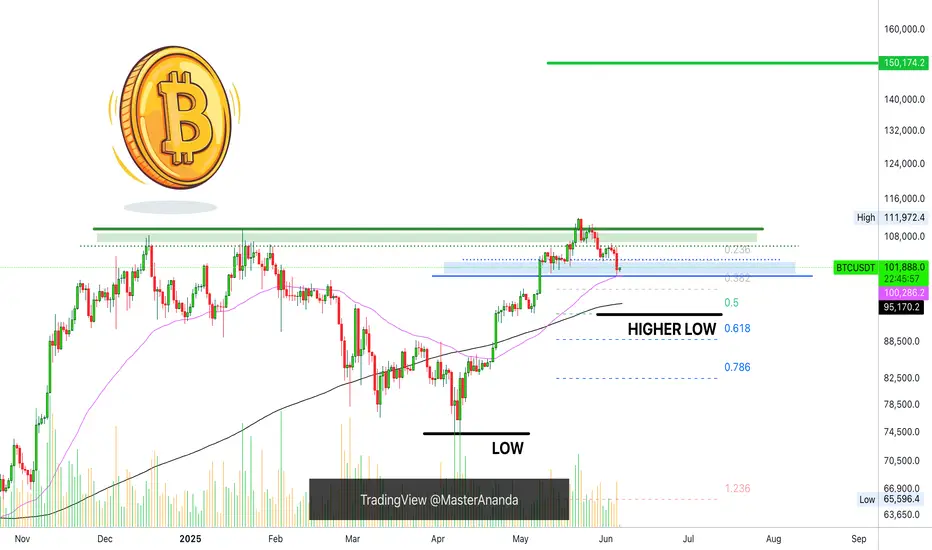
Bitcoin Crashes To $81,346.77? Good News & Bad NewsBitcoin is crashing... ? Not really, Bitcoin continues really strong above $100K.
We have good news and bad news.
Bad news. The very ultra-strong, long-term unbreakable support zone is being challenged. This is the $100,000 - $102,000 price range.
God news. It holds. This support zone is being challenged but so far it holds.
So far there is nothing unexpected here we know the market can shake, the market is bound to produce swings. If 100K breaks though this would be a completely different story. If it breaks, Bitcoin continues bullish producing a retrace only to end as a higher low followed by additional growth.
Will support break or hold, is there a way to know?
Bitcoin's retrace after the all-time high so far amounts to -10%. A standard retrace can easily push prices between 0.382 and 0.5 Fib. retracement. Anything lower and this would be a correction rather than a retrace.
Will it break?
It is possible but so far 100K is a very strong support. We have EMA55 here as well as several Fib. levels but if Bitcoin remains below $102,000 then it can definitely break.
The next major support below 100K sits at MA200 or $95,000. This is in-between 0.382-0.5 Fib. retracement. This can be used as the higher low zone and re-entry zone. But, Bitcoin is really strong and demand is big, so we have to wait for the weekly close.
Remember, Bitcoin will continue slightly bearish, consolidating, until the Fed decision. After the event, it is very likely to go full blown bullish. The altcoins will grow as well.
Watch the market shake just to recover the next day.
Are you a weak hand or a strong hand?
Do you have a trading plan?
If you do, nothing changes, simply short-term noise.
If you don't have a plan, right now you might be thinking that the world is close to its end. It isn't, Bitcoin will continue to grow, it takes time for the bulls to recharge before the next wave of growth.
Focus on the long-term.
Thanks a lot for your continued support.
Namaste.
Bitcoin H4 Timeframe Update
Bitcoin overall panda fam is forming a possible bullish structure but still this is consolidating no confirmation yet for next possible impulse up 👀
Possible Scenario #1 — Correction phase for confirmation 🍃, Possibly panda fam we will experience first a rejection on major trend resistance then bounce at PBr1 support ranging approx 102.3k - 102.7k, If we respect PBr1 support keylevel possible there will be a strong bounce and breakout on the follow days / weeks.
Possible Scenario #2 — Aggressive breakout Aggressive move 🚀, This will only happen panda fam if we consolidate near resistance for example on the pink mini channel then next follow days possible there will be a aggressive breakout above trend major resistance.
Possible short term target if ever PBr2 keylevel ranging 109.3k - 109.7k area. As per my own opinion panda fam hanggang dyan na muna mahirap ipredict yung market kung pangunahan mo ng maraming future movement only make a analysis malapit sa present price action for more better accuracy and confirmation.
ℹ️ : @pandanambawan

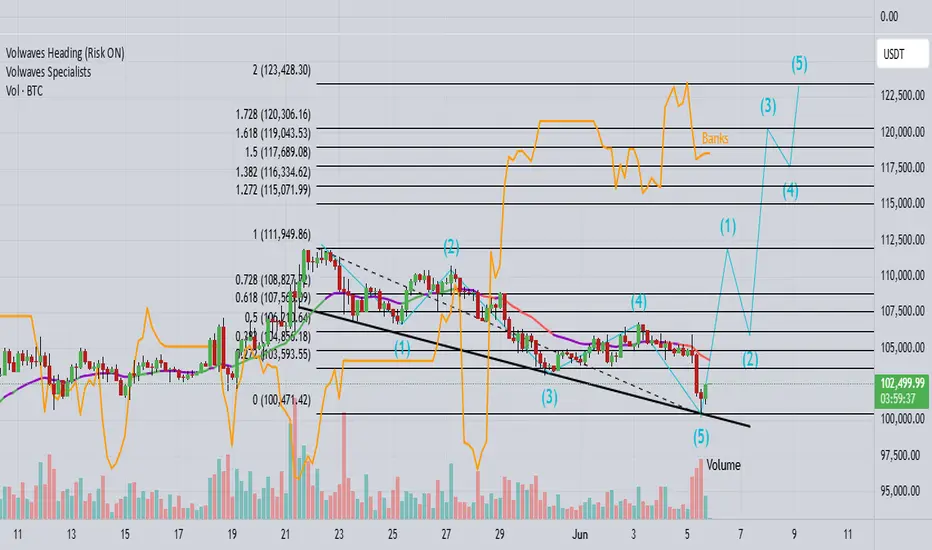
BTCUSDT – Ending Diagonal Nearing Completion? Critical Decision This structure appears to be developing within an ascending channel, potentially completing an ABC correction with a final impulsive move toward the upper trendline. The internal wave count indicates a possible completion of subwave (5) of C near the top.
However, bearish divergence in structure and the sharp nature of the previous impulse suggest caution. Two major outcomes are on the table:
Continuation Scenario: Price breaks above Wave 5, extending the rally in an overthrow move before reversing.
Reversal Scenario: Breakdown from the channel support (~107,000) could drag BTC down toward the broader trendline near 98,000–99,000.
This zone aligns with previous wave B support and could serve as a critical retest area.
Traders should monitor a break below the wave 4 pivot and channel midline as early signs of weakness. A rejection from the current top without higher highs confirms a potential end of the diagonal.

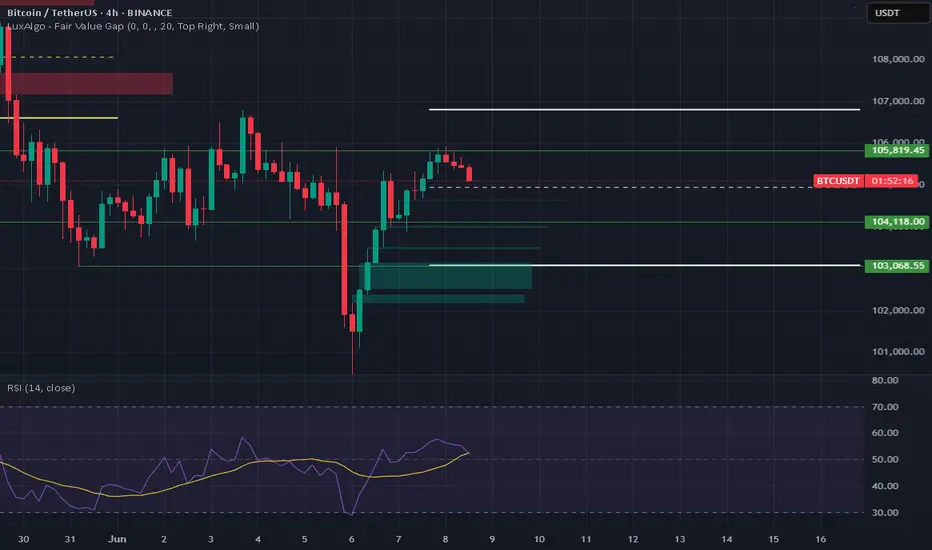
BTC is heading toward ATH On the weekly timeframe, I can see we’ve entered an FVG, swept the liquidity in front of it, and now there are no obstacles left to move higher.

BTC liquidity zones4H timeframe
Inverted chart
Looking at a short entry @ 107,000.
618 fib @ 107,400
Liquidity Zone @ 107,000 - 107,600
Take profit approx 98,000
This move would fill a Fair Value Gap a grab liquidity in the 98,000 - 100,000 price range.
Retracement worth - 7.7% from entry.
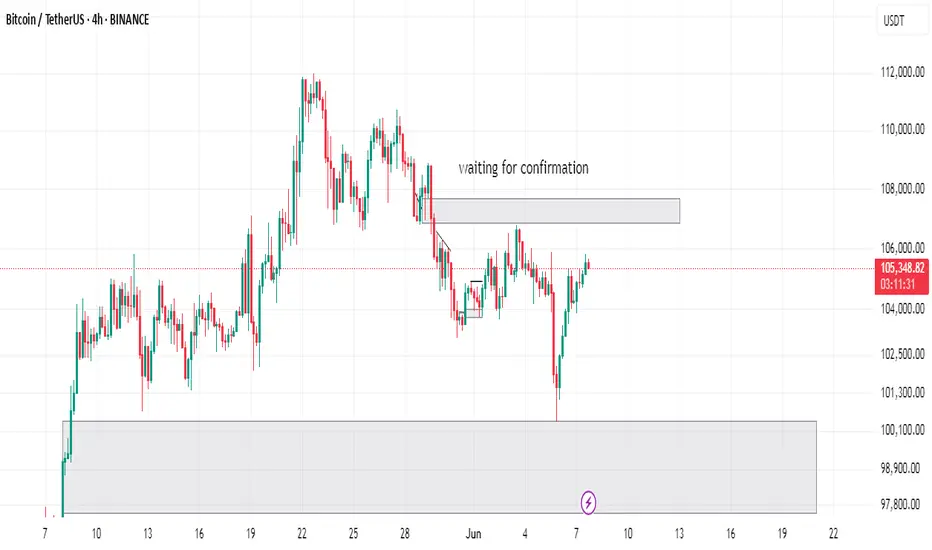
BTCUSD analysiswaiting for confirmation (low volume) in weekend - btc have potencial for long bullish but let's see in the following days