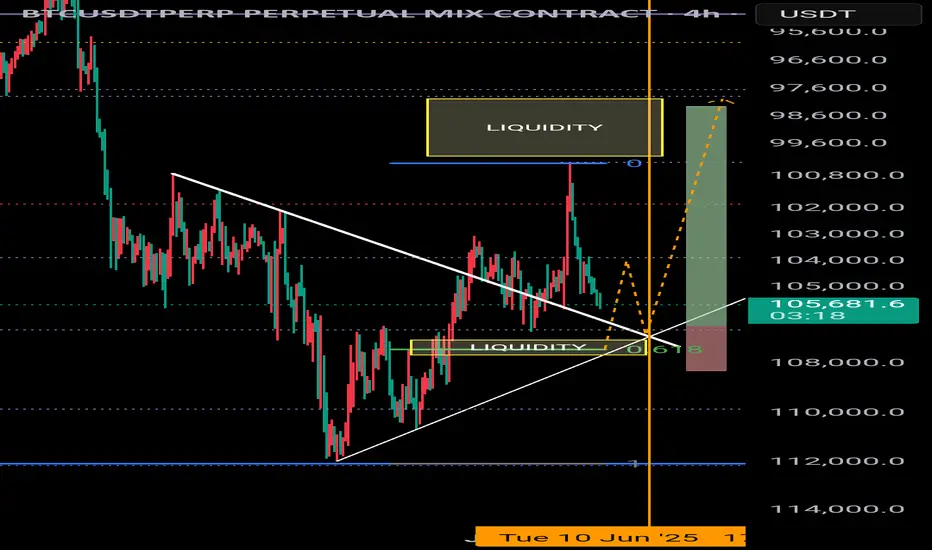
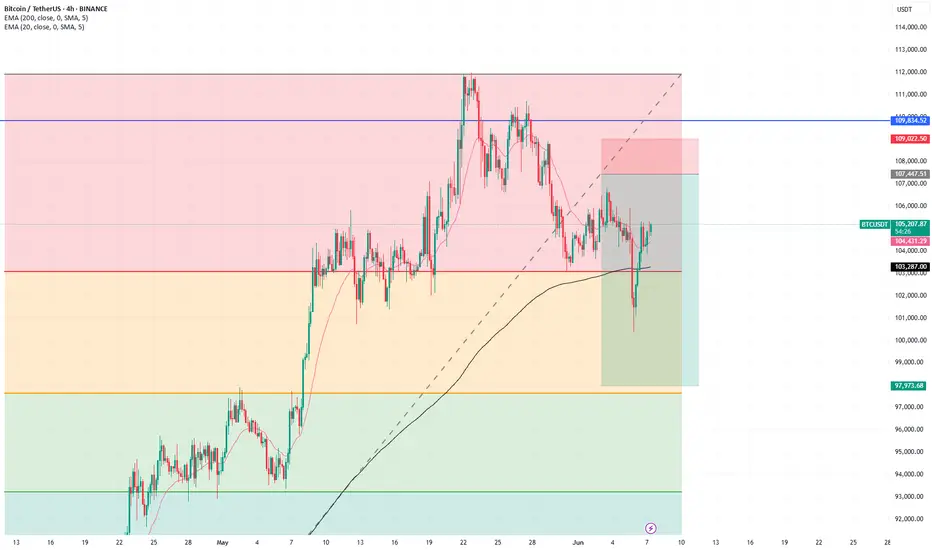
BTC liquidity zones4H timeframe
Inverted chart
Looking at a short entry @ 107,000.
618 fib @ 107,400
Liquidity Zone @ 107,000 - 107,600
Take profit approx 98,000
This move would fill a Fair Value Gap a grab liquidity in the 98,000 - 100,000 price range.
Retracement worth - 7.7% from entry.
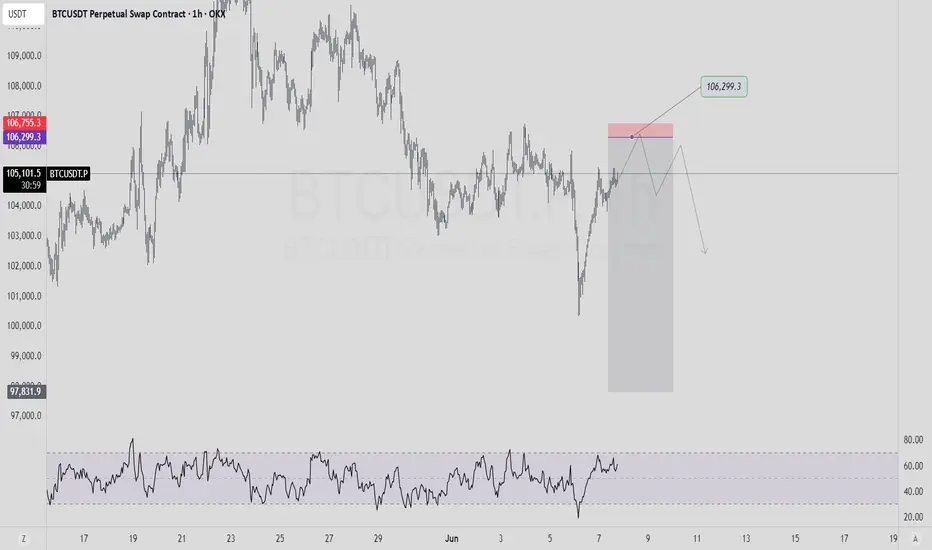
BTCUSDT.P trade ideas
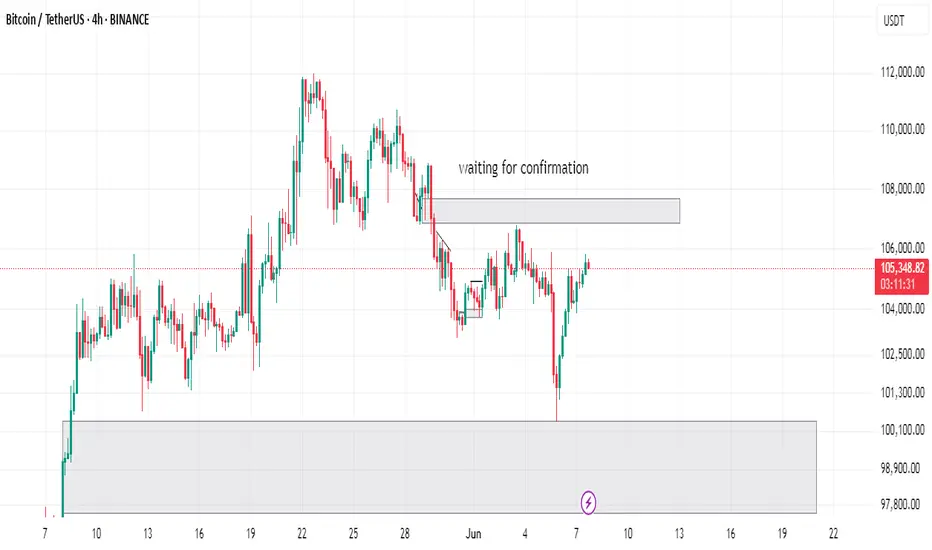
BTCUSD analysiswaiting for confirmation (low volume) in weekend - btc have potencial for long bullish but let's see in the following days
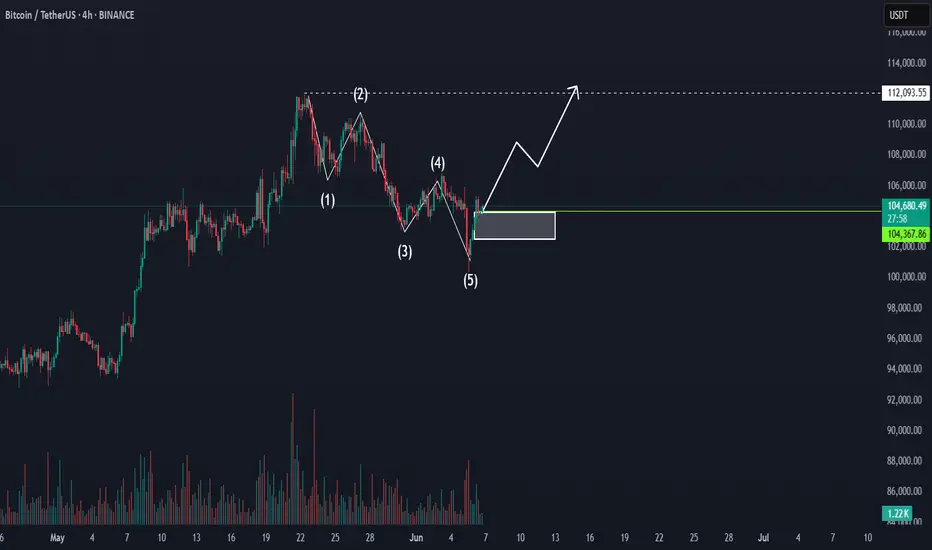
Bitcoin breaks trend continues north on wave 3!1). Huge Volume! 2). Banks are Buying! 3). Bonds are up! 4). Dollar weakness!

BTC falling ... thanks orange swanBTC dumping through the volume gap. Oversold conditions will give you the best opportunities.
Full TA: Link in the BIO
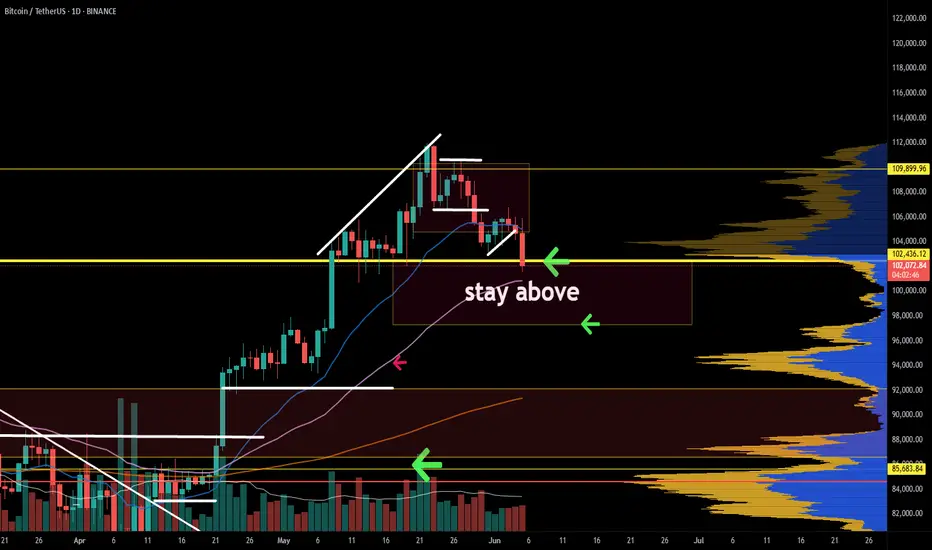
BITCOIN REVERSAL INCOMING !!!! BUT WHEN????Currently we have seen a great move from 75k to new ATH 112k BUT now whole bullish momentum seems to be fading.
If we see charts, we clearly see ranges and recently Bitcoin has swept range high & reclaimed back into range, which indicates lose momentum. We may see BTC tapping 90K even 80'sK for next bullish move.
For all to maintain it's bullish momentum, Bitcoin have to stay above 74.5k and needs to break and hold above 109.5K.
Breaking below 74.5k would push BTC as low as 60-55k
STAY CAUTIOUS !!!!

Possible bearing continuation BTC is currently in a bearish environment generally, I would love to see algorithm dive price into this liquidity inside an Ob ,to ftch in more bearish move into the market , next bearish target would be 90k

bitcoin short.Bitcoin (BTC) tumbled to a low of $101,095 on Friday amid volatility in the market. The effect of the tussle between United States (US) President Donald Trump and Tesla Chief Elon Musk negatively influenced the NASDAQ and Tesla's stock price on Thursday, although both are recovering on Friday. The spat between the two likely influenced the decline in crypto market cap, down 4% in the past 24 hours.
Bitcoin traders have turned fearful today, from neutral on Thursday. The crypto Fear and Greed Index reads 45 on Friday, while on Thursday and last week the values ranged between 57 and 60, implying a neutral sentiment among market participants.
As traders turn cautious and volatility rises, derivatives exchanges recorded a large volume of liquidations.
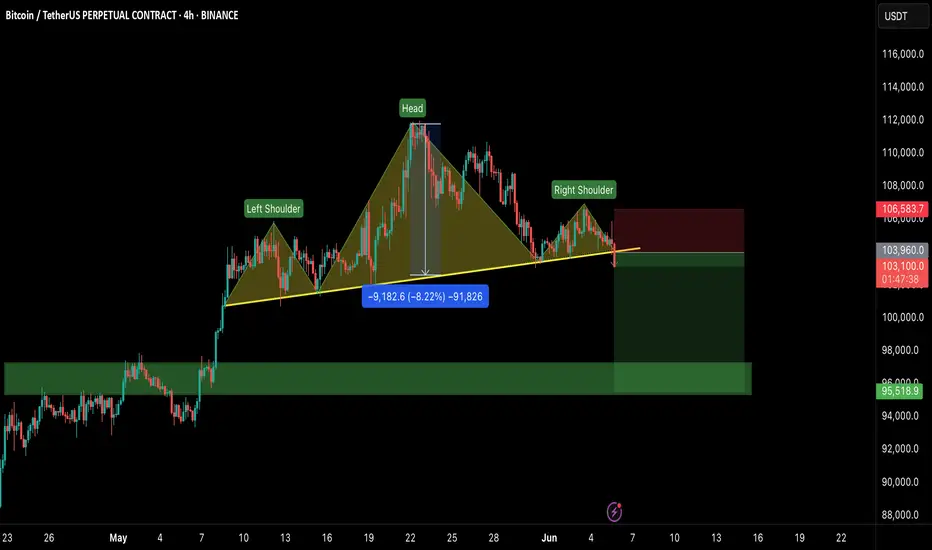
#BTC/USDT: Head & Shoulders Breakdown – $95K Incoming?Hey Traders!
If you’re finding value in this analysis, smash that 👍 and hit Follow for high-accuracy trade setups that actually deliver!
Bitcoin just broke below the neckline of a clear Head & Shoulders pattern on the 4H timeframe — a classic bearish signal.
As long as price stays below the neckline and fails to reclaim the $106.5K zone, we could be heading for a deeper correction toward the $95K–$98K support range.
Key Levels:
Breakdown Zone: ~$103.9K
Downside Target: $95K–$98K
Invalidation: Reclaim above $106.5K
Market is showing consistent weakness — small bounces are quickly sold off.
Let the pattern play out and manage your risk accordingly.
What do you think — short-term dip or deeper breakdown loading?
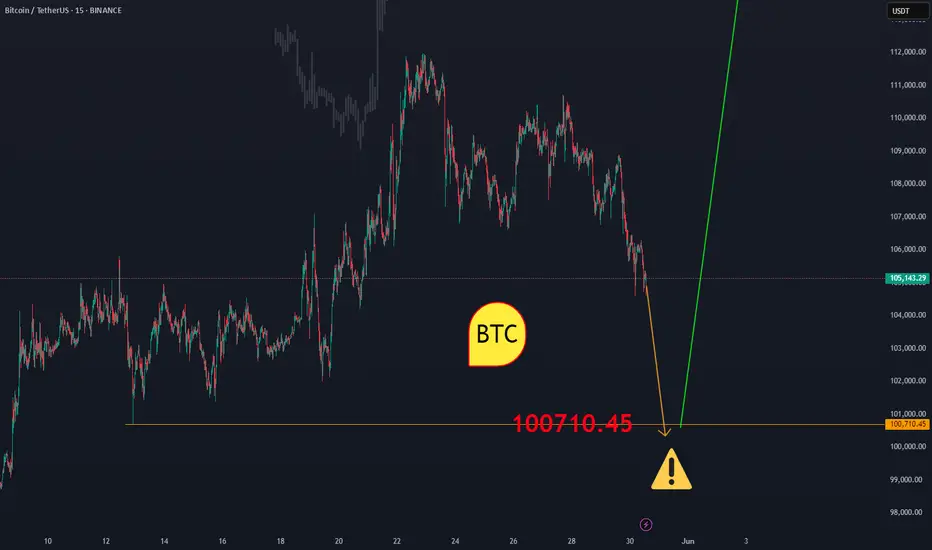
BTCUSDTBitcoin may be looking to complete the downward correction from the $101,000 price range to $99,000 and then begin a long-term upward trend. Pay close attention to the extent of the correction and don't give in to fear or greed.
In any case, it should go to $1300,000.
BINANCE:BTCUSDT
The market is still bullish. $BTCWe got out of the bear market cycle so quickly that I don't think anyone has understood yet...#BTCUSDT

"A volatile pattern of seesawing between bulls and bears"The recent inflows into spot Bitcoin ETFs have slowed down, but institutions such as Standard Chartered still remain bullish on the long-term trend, with price targets potentially raised above $120,000. Meanwhile, institutions like Japanese listed company Metaplanet continue to increase their holdings of Bitcoin, demonstrating institutional recognition of Bitcoin's long-term value. However, it is worth noting that large wallets and old wallets showed synchronized selling in May, indicating some profit-taking pressure in the market. From the perspective of market sentiment indicators, the current market sentiment is rather complex, with both bulls and bears seeking direction and no strong unilateral tendency.
Humans need to breathe, and perfect trading is like breathing—maintaining flexibility without needing to trade every market swing. The secret to profitable trading lies in implementing simple rules: repeating simple tasks consistently and enforcing them strictly over the long term.
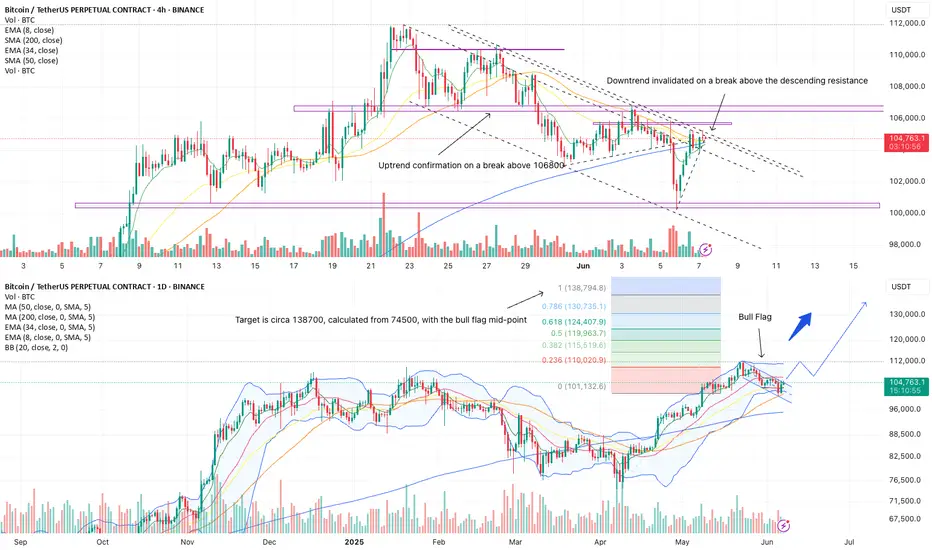
BTC Looking To Break Above Resistance Of Bull-FlagBTC showed a strong move off support at 100310 that is now looking to break above resistance of the bull-flag, which will signal the end of the decline. A daily break above 106800 is confirmation of the uptrend continuation, which should target ATH in the first instance. Following a pullback, BTC should then make its way to new highs, with a first target at 138000, which is a 100% extension from 74500, with a bull-flag mid-point.
Trades
Long on a break above the descending resistance (close on the 30min chart)
Add to long position on a break above 106800
Reduce position size at 112000, to allow for a brief pullback or potential consolidation at ATH
Return to 100% allocation on a solid close above 112000 or a pullback to 106800
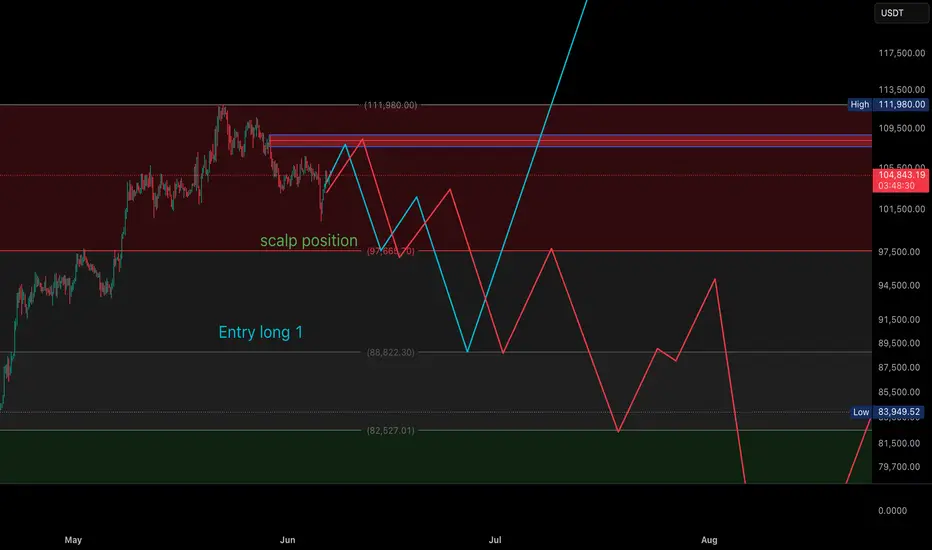
If you followed me you will be aware about thatGood afternoon everyone. About that Manipulation with Trump Elon Mask we know before its started. And its still not Finished yet. On this Chart you can found all need Price Information For today and this upcoming week.
The Collapse of the Bitcoin ExperimentFew are prepared for this scenario, yet it's the most probable one: Bitcoin is heading for a major crash in the coming years.
What was once a revolutionary idea has become a centralized shitcoin, failing nearly every purpose envisioned by its creator. Aside from gamblers and speculators, hardly anyone truly believes in Bitcoin anymore.
The experiment has failed — it's time to accept its fate.
This will be the biggest short trade in the history.
05 June, 2025
Doomsie

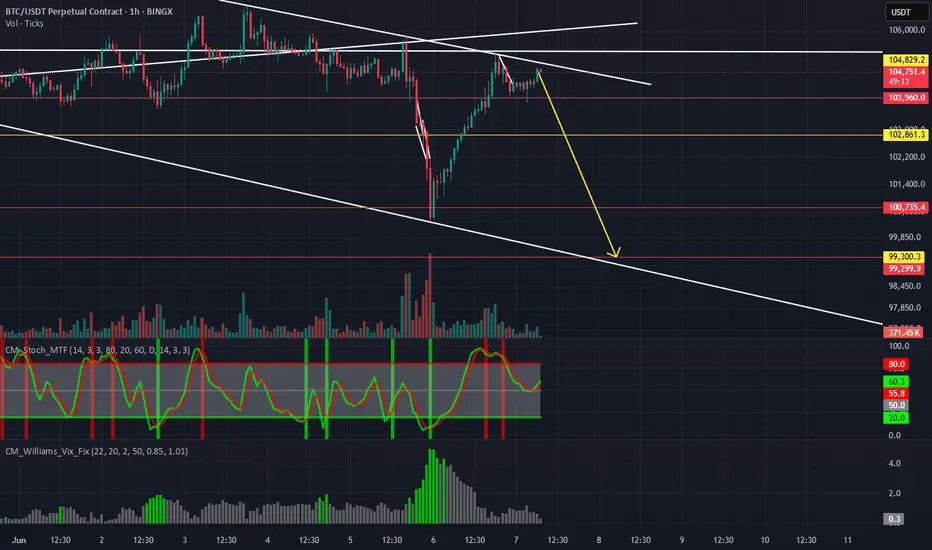
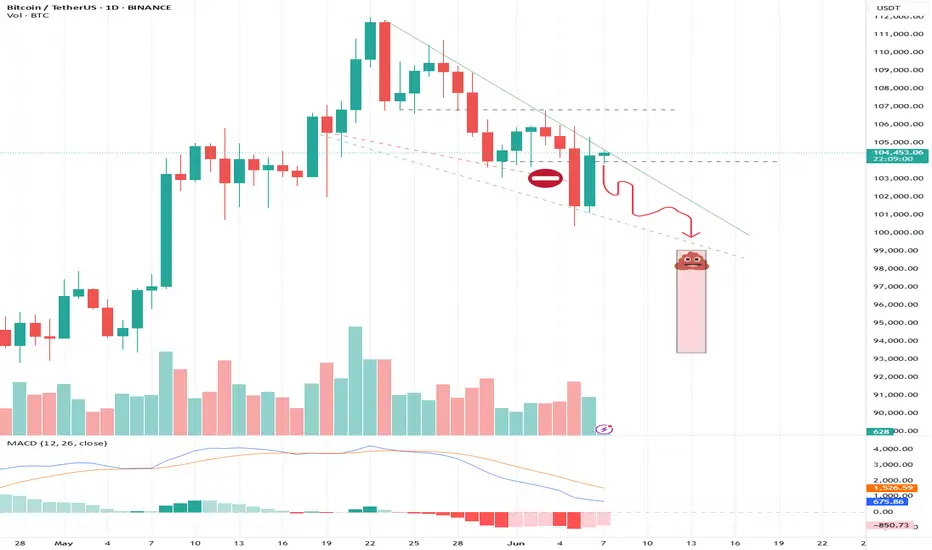
BTC bearish ideaBTC is still moving inside the downward channel and I don't expect it to break above, bitcoin will fall back down to the lower trendline.
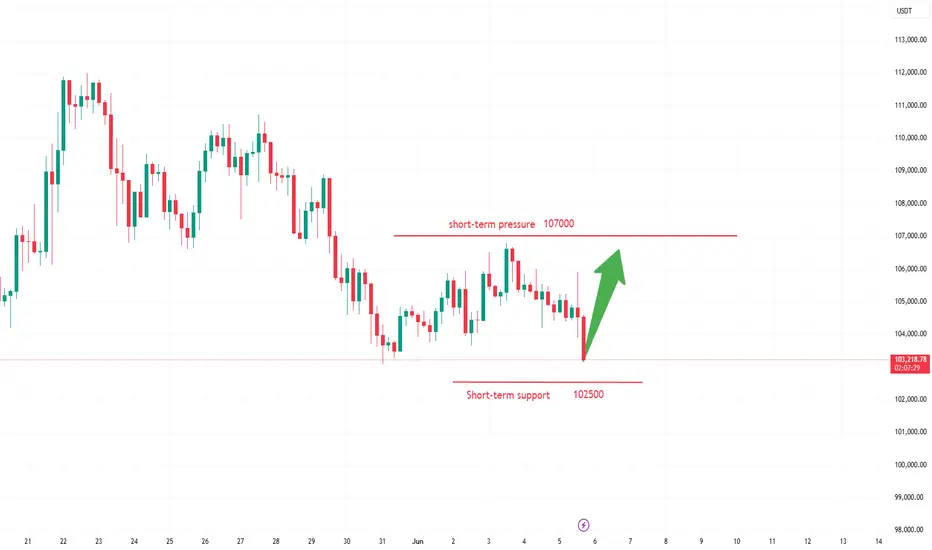
BITCION TO $112,000Hello! Analyzing the Bitcoin price again. BTC's price action has remained in a very good consolidation zone, where it has shown strength and a real intention to remain bullish. Currently, Bitcoin is declining slightly, attempting to capture the latest liquidations to launch a strong bullish movement. The area of greatest interest is near the previous high. Volume and buying interest remain stable, and therefore, on a daily chart, the projection would remain bullish, without ruling out liquidity draws near $100,000.
Disclaimer: This is solely the opinion of a trader. It is not an investment recommendation.
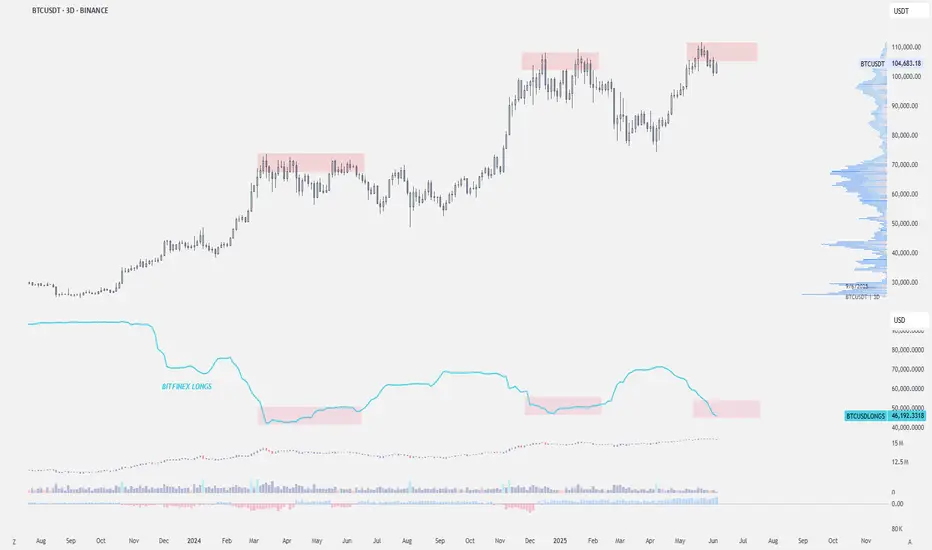
Bitfinex closed $BTC longs — local top?This Bitfinex Bitcoin long positioning is worth monitoring.
Each marked price top aligns closely with a local peak or plateau in Bitfinex longs, followed by distribution or a pullback.
Currently, Bitfinex longs have again plateaued or declined, just as BTC is forming a potential local top.
BTC dump in a fake wedgeIt looks like BTC is just going to dump in a fake wedge being rejected level by level, until a final waterfall.
BtcusdtCompletion of the current bullish flag pattern could lead to a potential increase in price in btc
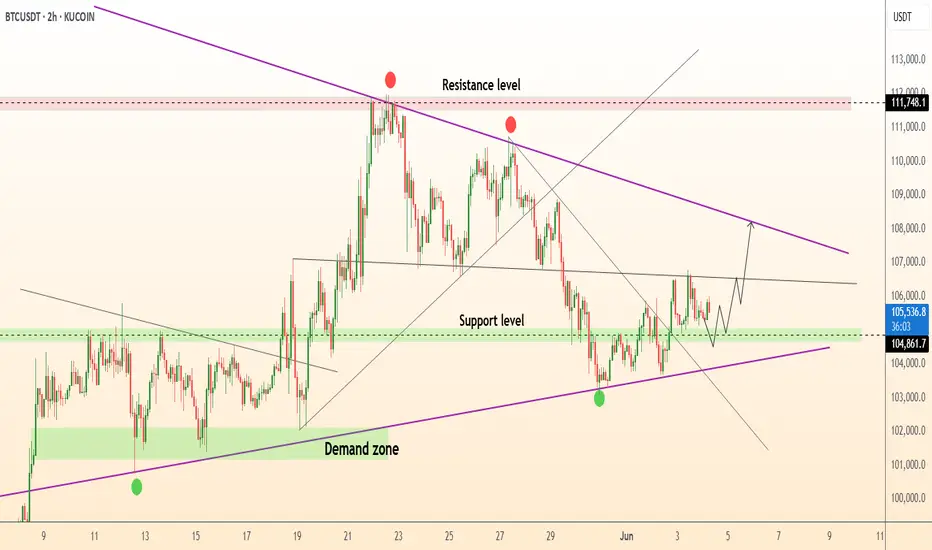
DeGRAM | BTCUSD retesting the $105k📊 Technical Analysis
● Triple bounce at 104.8 k-105 k and the violet trend-line created fresh higher-lows while keeping price above the May demand block.
● A two-week falling trend-line has just been cleared and retested, unlocking the next pivot at 108 k; flag depth from 105 k projects to the 111.7 k supply/upper channel rail.
💡 Fundamental Analysis
● FXStreet highlights US job openings at a 3-yr low, pressuring yields, while CoinShares tracks another $450 m spot-ETF inflow and exchange balances at a 4-yr trough, signalling a tightening float.
✨ Summary
Buy 104.8-106 k; clearance of 107 k aims for 111 k, stretch 115 k. Long thesis void on a 2 h close < 103 k.
-------------------
Share your opinion in the comments and support the idea with a like. Thanks for your support!
Bitcoin (BTC/USDT) Technical Analysis📊 Bitcoin (BTC/USDT) Technical Analysis | Back at Key Resistance
As seen on the chart, Bitcoin has once again returned to a major resistance zone — a level that has previously acted as a strong barrier to further upside. Price action here is critical and could define the next short-term move.
🟢 Bullish Scenario: Break and Rally
If BTC manages to break above this resistance, the next key levels to watch are:
$105,106 – initial resistance
$105,305 – stronger resistance that could act as a mid-term target
A clean breakout above these zones may trigger further upside momentum.
🔻 Bearish Scenario: Rejection and Pullback
If price gets rejected from this area again, we could see a short-term correction. Key support levels include:
$104,271 – first support on the way down
$103,948 – mid-range demand zone
$103,387 – next support if selling pressure builds
$102,600 – the main support level to hold for bulls
📌 Summary
Bitcoin is at a critical decision point. A breakout could trigger a bullish continuation, while a rejection might invite a deeper retracement. Watch for candle confirmation and volume reaction before entering a trade.
🔥 If you find value in these setups, follow me for daily clean charts, smart trade ideas, and real-time updates.
Let’s trade the market with logic — not hype. 🚀📈

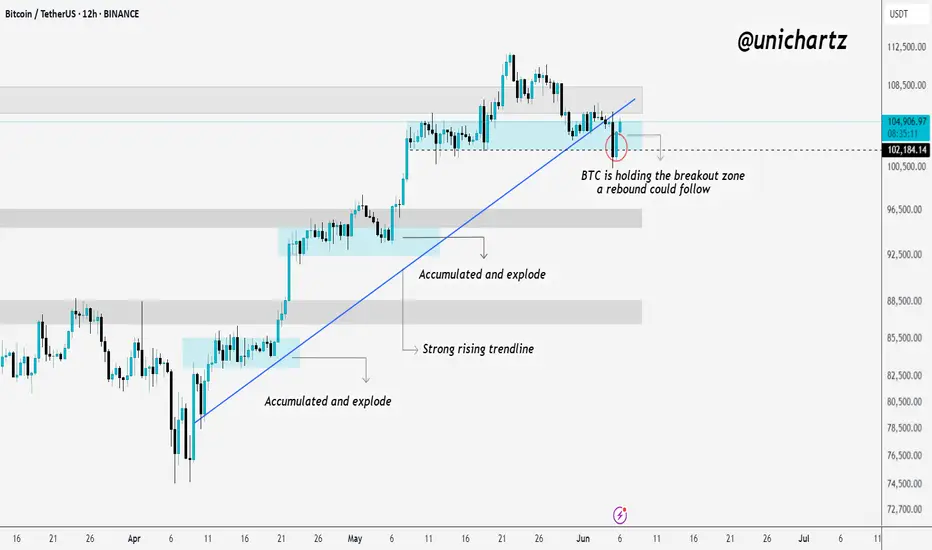
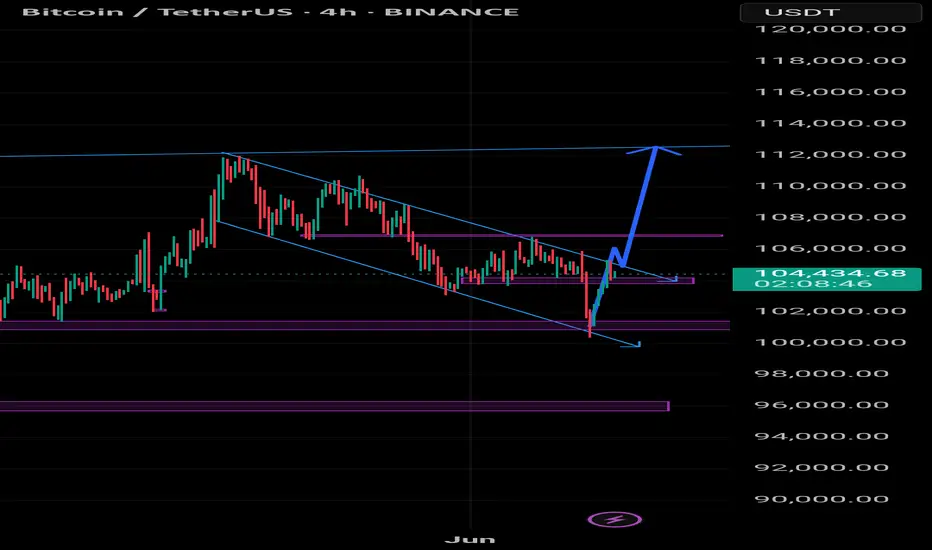
False Breakdown? BTC Eyes Rebound From Demand Zone!Bitcoin has broken below its strong rising trendline, but this move could well turn out to be a classic seller’s trap. Despite the breakdown, BTC is currently holding above the key breakout zone, which has historically triggered strong rebounds.
The price is also sitting right inside a previous "accumulated & explode" demand zone — an area where buyers have consistently stepped in. If BTC manages to hold this zone, a sharp rebound could follow, trapping late sellers and driving price higher.
However, if the support zone fails, we could see deeper downside. For now, this is a critical pivot — watch price action closely to see if bulls defend this level or if sellers gain control.
If you liked it, do comment and follow us for regular market updates.
THANK YOU