What a week! FRIDAY SCALP IDEAWhat a profitable week we've had!
As the week winds down, be mindful not to overtrade and risk giving back your hard-earned gains. Consider de-risking any open trades where possible, and be prepared to sit tight—weekends typically bring low volume and choppy price action.
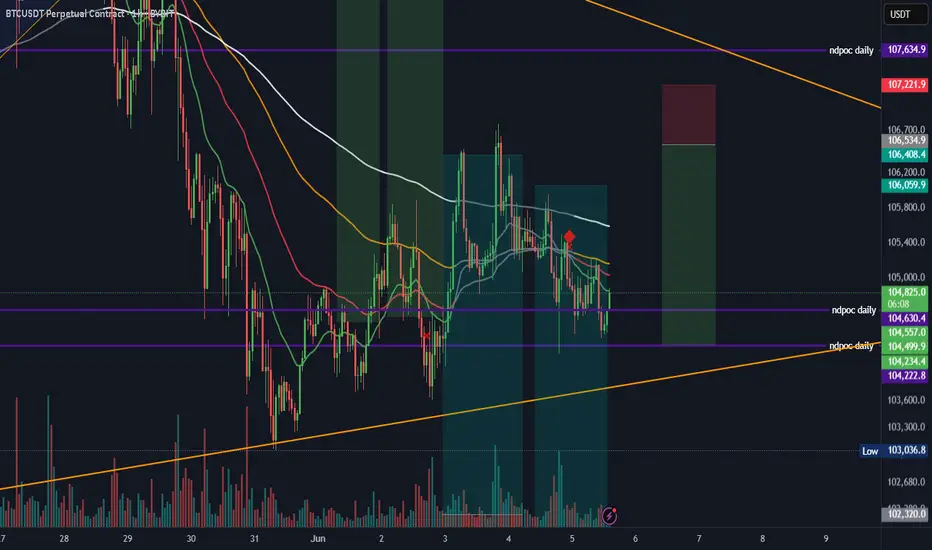
At this point, the only trade setup I’m considering is a lower high continuation, as shown in the diagram. However, caution is warranted due to the daily SFP. If the current supply zone fails to hold, we could dip deeper into the old range, potentially breaking 4H structure.
Let’s see how it plays out.
I’ll see you all later today for class and next week for more setups, more training, and a deeper understanding of the markets.
Have a great weekend!
BTCUSDT.P trade ideas

#btcusdt With all this news, it's time for a break for Bitcoin.I see a head and shoulders on the chart. What about you? If there was going to be a big, very big news, what do you think that news could be? I think Elon Musk and Trump are going to complicate this game for us a lot, but first and foremost, we have to accept that we have come to the age of technology and the future will be shaped by decentralized networks and blockchain chains. #btc #bitcoin
Reversal?Five waves may have been completed. BTC is bouncing off support while holding the 100k. Let's go!

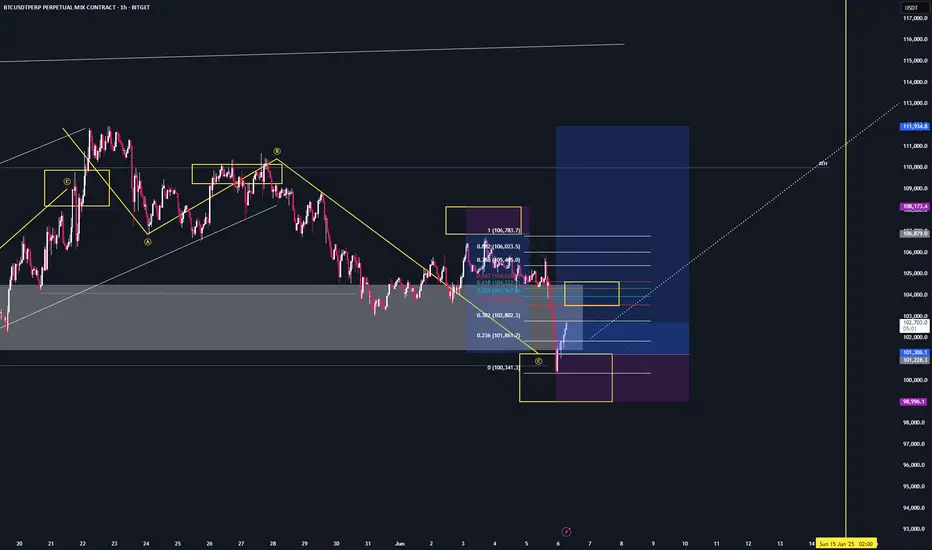
BTC - SetupCalled the potential exact bottom yesterday.
Now, the zone between $103,500 – $104,600 is crucial.
Either we get rejected from there and form a stronger bottom — or we break through and head toward new all-time highs in the near future.
Won’t be posting over the next few days.
If something important happens, I’ll drop a quick update — otherwise, see you in a few days.
LFG. 🚀
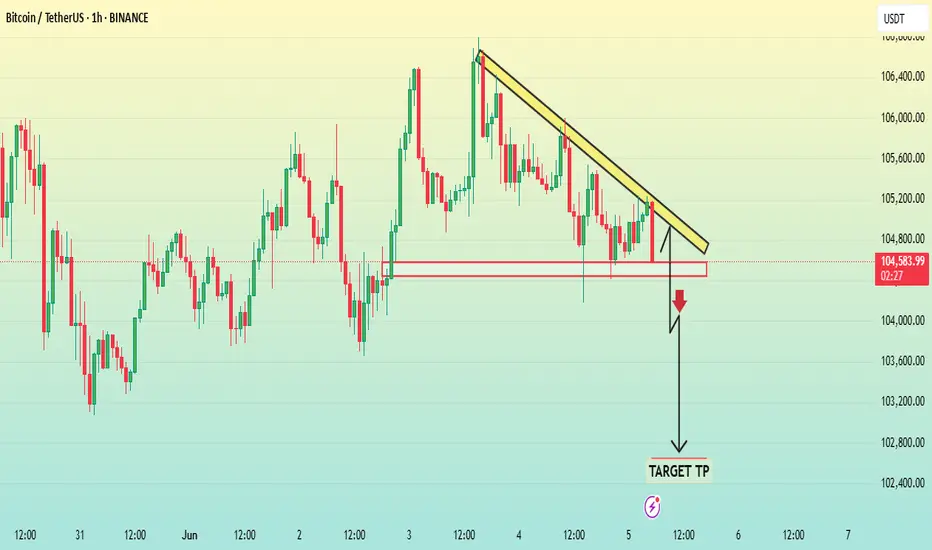
BTCUSD 1HThe second chart you uploaded is a 1-hour candlestick chart for Bitcoin (BTC/USDT) on Binance. Here's the analysis based on what is shown:
---
Chart Analysis:
1. Bearish Descending Triangle Pattern:
Descending resistance (yellow trendline) connects lower highs — indicating bearish pressure.
Horizontal support zone is marked in red, where price has repeatedly bounced — indicating strong support.
This setup forms a descending triangle, a bearish pattern that often results in a breakdown below support.
---
2. Breakdown Expectation:
A black arrow and zigzag line suggest a possible breakdown scenario.
The target TP (Take Profit) is drawn significantly below the current price, targeting near the $102,400–102,600 zone.
---
Implied Strategy:
Trigger for Entry (Short): A clear break and close below the horizontal red support zone (~$104,500).
Target TP: Around $102,400
Stop-Loss (not shown): Likely above the descending trendline, maybe near $105,200–105,300 to invalidate the pattern.
---
Technical Implication:
A descending triangle in this context suggests sellers are consistently pushing down while buyers are losing strength at the support level. A breakdown would confirm bearish control.
---
Would you like a comparison of this BTC setup vs. the SUI breakout chart in terms of trade setup strength or risk-reward?
Current Bitcoin Analysis! What Can Investors Expect in the CominBitcoin is trying to find support at 103K levels. We are likely to see a move until our previous support is now in the green. As long as 103K is maintained, 105.8. - It will want to rise up to the 105K range.
If a short confirmation structure is formed when it reaches the specified green area, the short idea can be evaluated up to 100K levels. When it comes to the green area in the analysis, it should be monitored closely. If the price moves to the red zone, short confirmation structures can be evaluated.
If Bitcoin resumes its downward movement from the red zone, the bearish target will be the blue lines in the analysis.
Not Investment Advice.

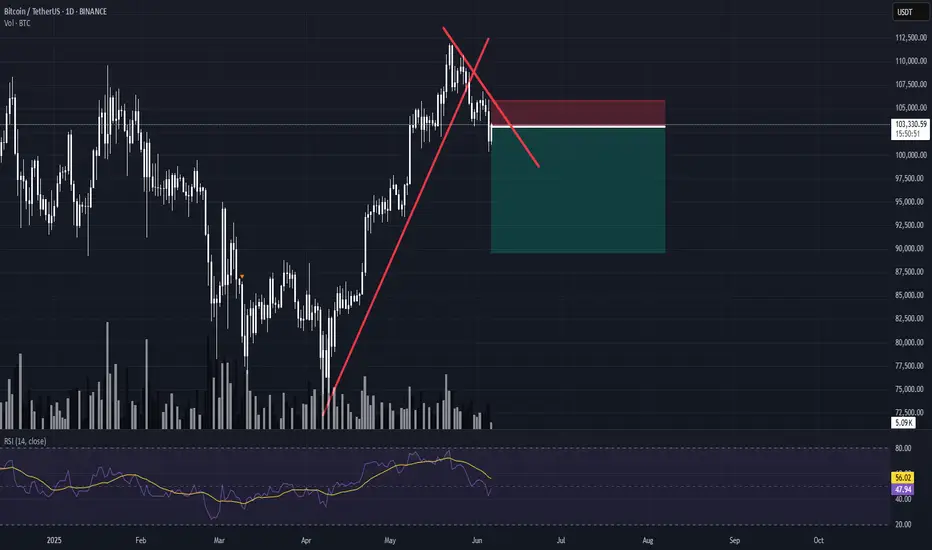
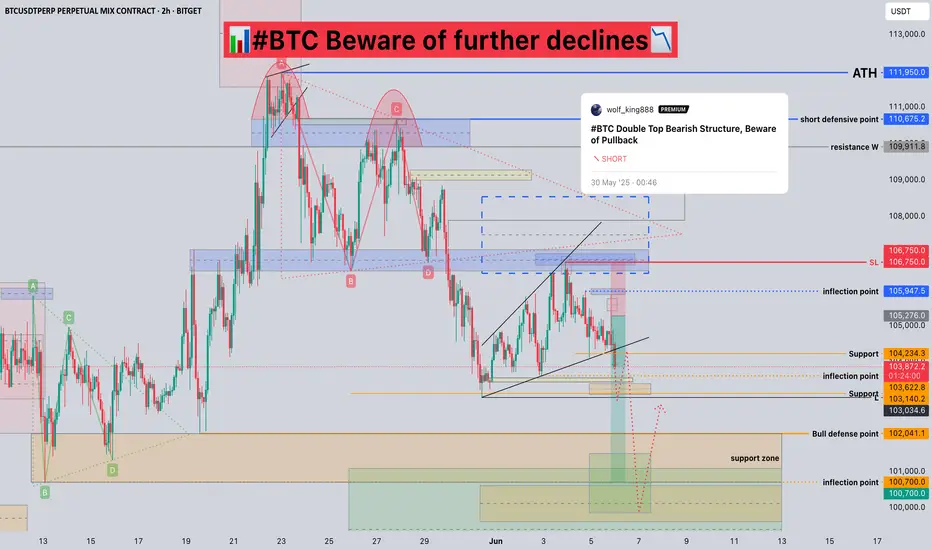
#BTC Beware of further declines📊#BTC Beware of further declines📉
🧠From a structural perspective, we have not been able to break through and stabilize at the resistance area near 106500. And the structure of the reversal of the bullish trend has been established, so the downside risk remains.
➡️From a graphical perspective, we have formed an extended wedge between the support line and the resistance area, and the price has now fallen below the lower edge of the wedge, so we will likely see further pullbacks.
➡️If the market really develops as expected, then the support area worth paying attention to is around 100700.
⚠️Note that if we rise again and successfully break through and stabilize at the resistance near 106750, then we will see more gains.
Let's see👀
🤜If you like my analysis, please like💖 and share💬 BITGET:BTCUSDT.P
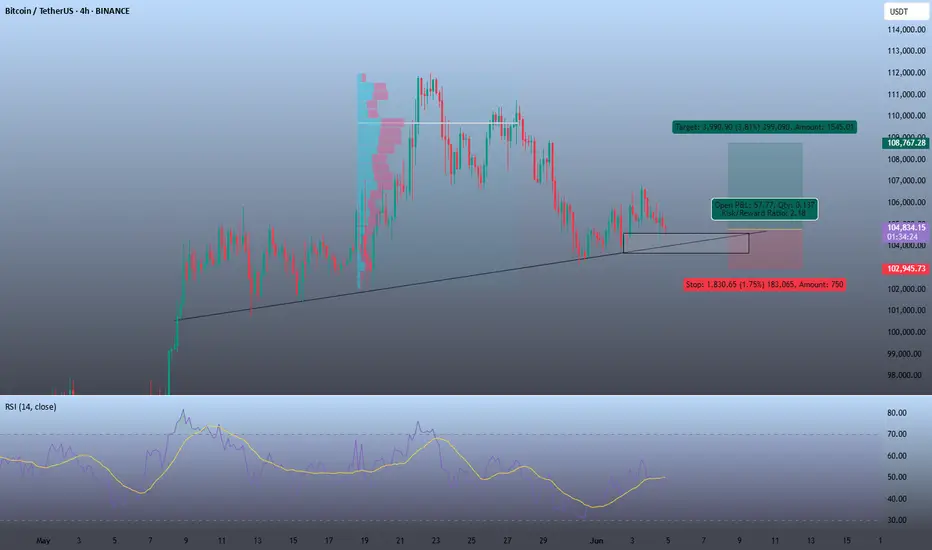
BUY OPPORTUNITYTrade Signal: BTC/USDT
Entry Price: $104,776
Stop Loss (SL): $102,945
Take Profit (TP): $108,767
Timeframe: 4H
Technical Indicators
RSI (Relative Strength Index) at 48, turning upward:
RSI near 50 is neutral, but a rising RSI from below 50 suggests increasing buying momentum. It indicates the bears are weakening and bulls are gaining strength.
The current price is stabilizing at a historically strong support zone, which has acted as a floor in previous price action. This increases the likelihood of a bounce.
Volume increasing:
A rise in trading volume often confirms the strength of price moves. Increasing volume near support suggests strong buyer interest.
Fundamental Outlook
Upcoming fundamental data (unemployment claims) is expected tomorrow.
Historically, positive employment data tends to increase market confidence and can provide bullish momentum for BTC as investors react to overall economic health.
The market appears positioned to react favorably if the data meets or exceeds expectations, potentially accelerating the move toward resistance.
BTC - SetupWe narrowly missed triggering our short entry at $106K.
If you’re still looking for long entries — this could be your chance.
Now is likely a good time to go long on MARKETSCOM:BITCOIN , potentially targeting the ATH region and beyond, But we don’t have clear target regions yet — they will develop over time.

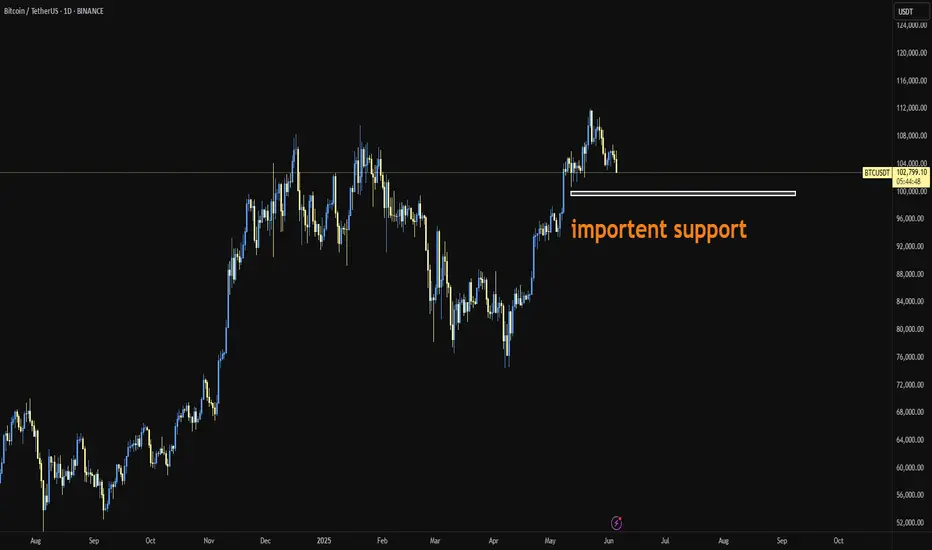
BITCOINBitcoin is approaching a critical confluence zone near $100,000, where two major supports intersect:
– A horizontal support around $100,000 (previous top-turned-support)
– A rising trendline drawn from the 2023 rally, currently aligning near $98,000 – $99,000
This zone is technically significant. A bounce from here could send BTC back toward the $129,000 resistance level
However, a daily candle close below this confluence (especially under $98,000) may trigger a deeper correction toward $90,000 or even $81,000
Watch price action closely—this region is not just support; it's a trend-defining battleground
"Caught the Dip – Next Stop: Resistance Zone 1. Current Price Action:
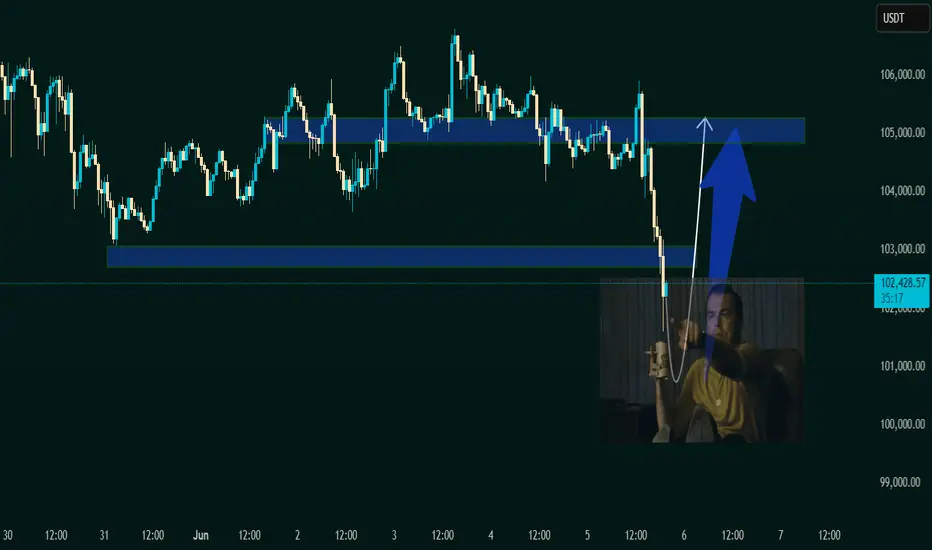
The asset has bounced off the demand zone around 101,500 – 102,000 USDT.
It is now trading at 102,204.56 USDT, indicating early signs of the expected bullish move.
A white curved arrow suggests a rounded bottom pattern, often signaling a bullish reversal.
2. Demand Zone (Support):
Remains the same as the previous chart: 101,500 – 102,500 USDT.
Price reacted exactly at this zone and is starting to move upward.
3. Supply Zone (Target Area):
Clearly marked at 104,800 – 105,500 USDT.
This is where the expected bullish move could face resistance or where traders might look to take profit (TP).
4. Visual Reinforcement:
The large blue arrow indicates strong bullish momentum is anticipated.
The meme (Leonardo DiCaprio pointing) emphasizes that the reversal is happening as previously predicted — likely for motivational or engagement purposes in a VIP group.
---
🧠 Technical Sentiment:
Bullish Bias confirmed: Price bounced exactly from the demand zone.
Momentum Shift is underway, as indicated by the reversal pattern.
A potential "Buy Confirmation" is in play with room to ride up to the 105K resistance zone.
---
🎯 VIP Trade Setup Recap:
Parameter Value
Entry Zone 101,500 – 102,000 USDT
Current Price 102,204.56 USDT
Target (TP) 105,000 – 105,500 USDT
Stop Loss (SL) Below 101,000 USDT
Bias Bullish / Reversal
---
📌 Suggested Title:
"Reversal In Motion – Ride to 105K 🎯🚀"
BTC/USDTThe only re-entry I would consider as great in terms of risk reward is the region of 99-100k if market allows to visit. Orders are placed accordingly. In the meantime holding all positions since 77k re-entry.
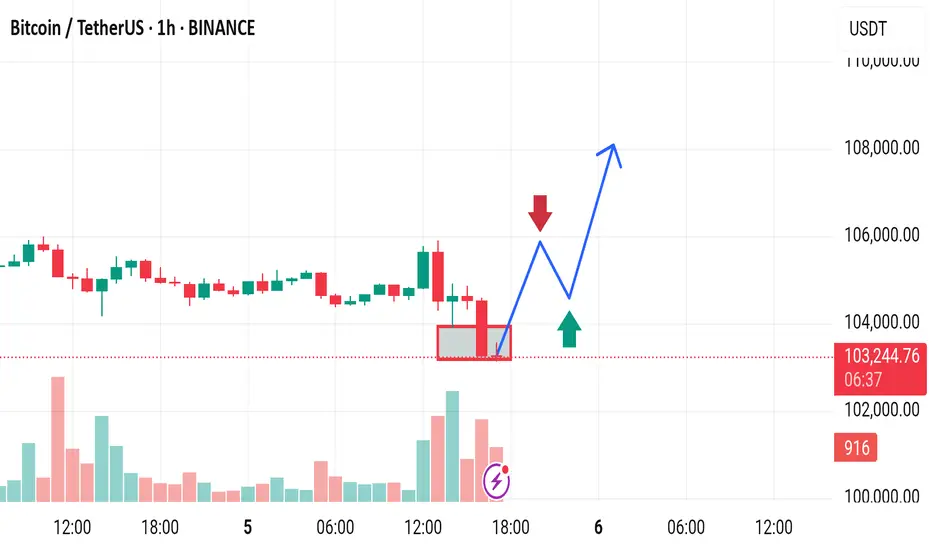
Market next move 🔍 Original Interpretation:
Support Zone: The red rectangle suggests a support level between ~102,800 and ~103,300.
Bullish Bias: The blue arrow anticipates a bounce from this zone, potentially forming a higher low before continuing upward.
Bearish Bias: The red arrow marks a potential resistance, predicting rejection and a move lower if the bullish breakout fails.
---
⚠️ Disruptive Analysis:
1. False Support Breakout Risk:
A false breakdown beneath the support zone could trigger panic selling before a rapid recovery (fakeout).
Traders might place stop-losses just below the box — a perfect target for market makers before price reverses.
2. Volume Deception:
Volume increased during the sell-off but did not show strong absorption by buyers (green volume wasn't dominant).
This suggests sellers still dominate and a continuation lower could occur before any bounce.
3. Lower Highs Formation:
The last few green candles failed to break the previous highs, indicating weaker buying strength.
Price may form a lower high, hinting at a short-term bearish trend.
4. Macro Trend Consideration:
If this is just a retracement within a larger downtrend, the bounce could be short-lived.
Broader market sentiment or macro news could push BTC toward 100,000 support or lower.
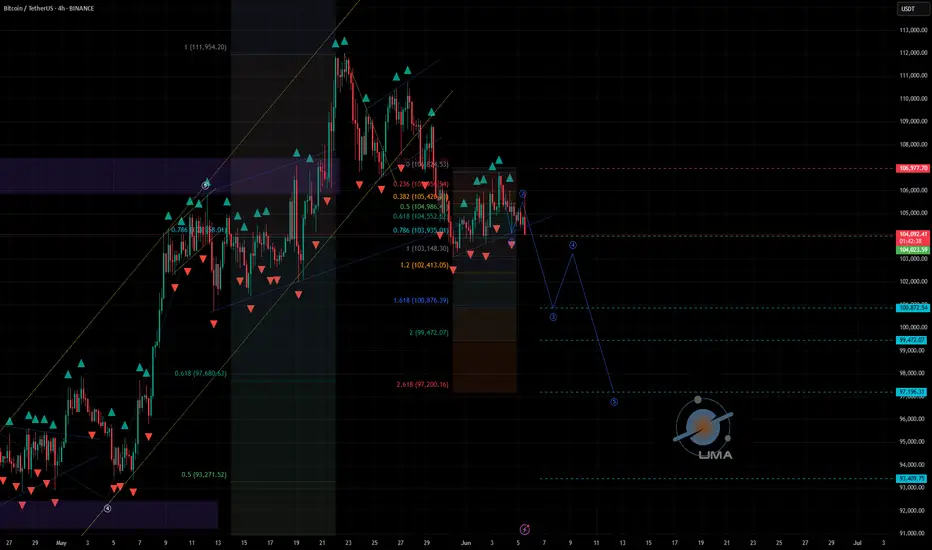
BTCUSDT - UniverseMetta - Signal#BTCUSDT - UniverseMetta - Signal
H4 - Formation of a 3-wave structure + exit from the channel. It is better to reduce risks. Stop behind the maximum of the 1st wave.
Entry: 104023.59
TP: 100872.54 - 99472.07 - 97196.31 - 93409.75
Stop: 106977.70
BTC _ Ultra mega quick scalpsAs said , quick scalps at cmp sl 104,000 targets of smooth 106,100 and 106,750! Enjoy it
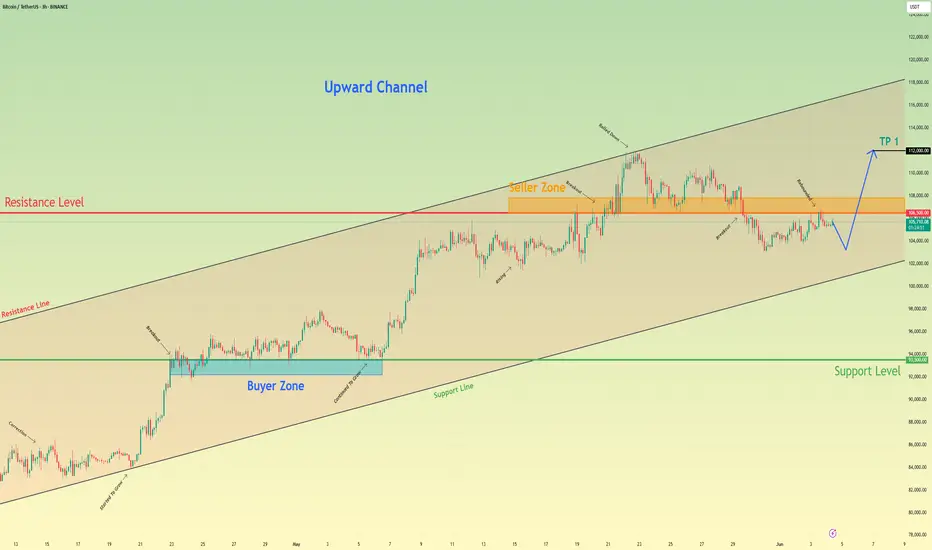
Bitcoin may break resistance level and continue to move upHello traders, I want share with you my opinion about Bitcoin. If we look at the chart, we can see how the price entered an upward channel and declined to the support line. Then it started to grow and soon reached the 93500 support level, after which it broke this level and then some time traded near. After this, the price rebounded and continued to move up inside an upward channel, where it later reached a resistance level, which coincided with the seller zone. When BTC reached this level, it broke it too and even rose to the resistance line of the channel, but soon it turned around and dropped to the seller zone. In this area, the price long time traded and later tried to grow, but failed and continued to decline. Soon, BTC broke the 106500 level and fell below the resistance level. But recently, price turned around and grew to this level again, and now trades very close. In my opinion, Bitcoin can decline a little and then break the resistance level one more time. After this movement, I expect that the price will continue to move up inside the upward channel, so I set my TP at 112000 points. Please share this idea with your friends and click Boost 🚀
Where Can Bitcoin Go? Part 7Title: Where Can Bitcoin Go? Part 7
Post:
🌍📊 Where Can Bitcoin Go? Part 7 🧭🔥
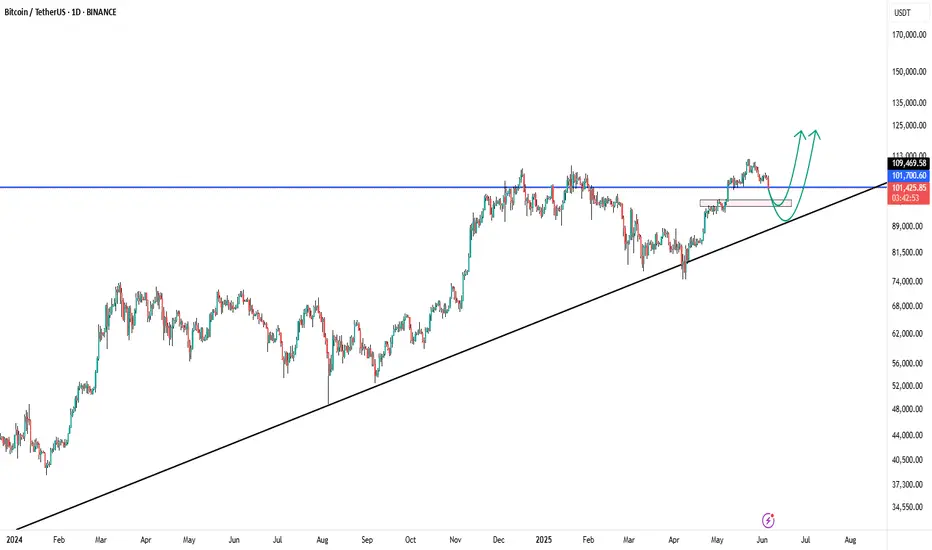
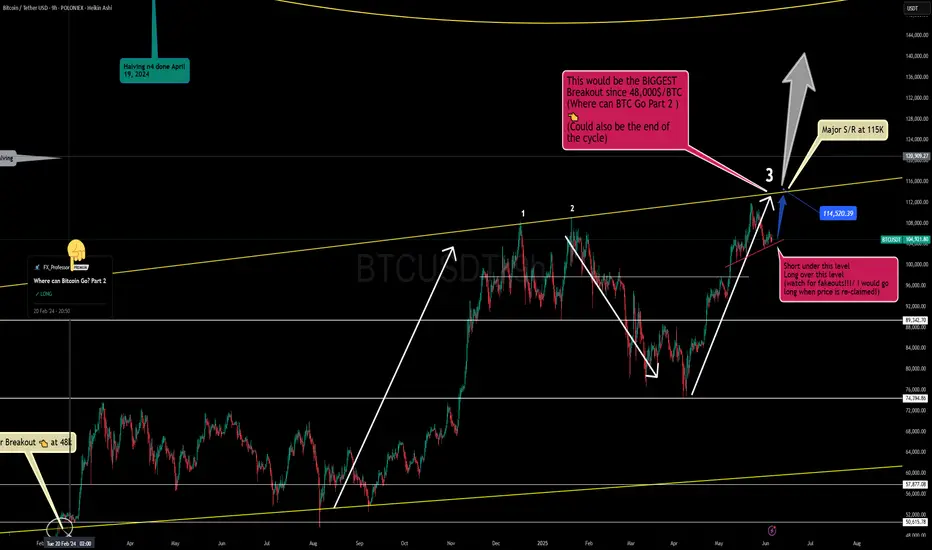
This is it — Part 7 of our ongoing macro Bitcoin analysis — and this one is rooted in the three all-time trendlines that I’ve used for years to map out Bitcoin’s biggest moments.
We are now heading north, potentially to do something historic : test the upper trendline resistance for the third time . 📈
When Bitcoin does this, it tends to either break out massively ... or signal the end of a cycle . That’s why this zone — 114.5K to 115K — is critical . A successful breakout here and $100K becomes history . It would unleash Bitcoin into a new phase of its long-term bullish evolution. 🦅
On the flip side: this might also mark the final resistance of the current cycle . Either way, it’s a zone where serious decisions will be made — and manipulation will likely spike. 👀
🔑 Key Levels:
114,520–115,000 : Breakout zone — reclaim this and we’re headed higher.
97,770 : Key support — fail to hold, and we reassess the bullish case.
🎥 Want to better understand the levels in play? Watch my latest video idea, where I draw comparisons between BTC now and the Brexit 2016 setup. This will help you see why I’m preparing for major volatility . 🚀📈 Bitcoin smells like 'Brexit to the NORTH Pole!' 💥🇬🇧
I’ll post the video link below once live — keep an eye out for it!
👇 Previous post: “Bitcoin smells like 'Brexit to the NORTH Pole!’”
One Love,
The FXPROFESSOR 💙
ps. Big breakout at 115k or end of cycle? I am hoping for the first!
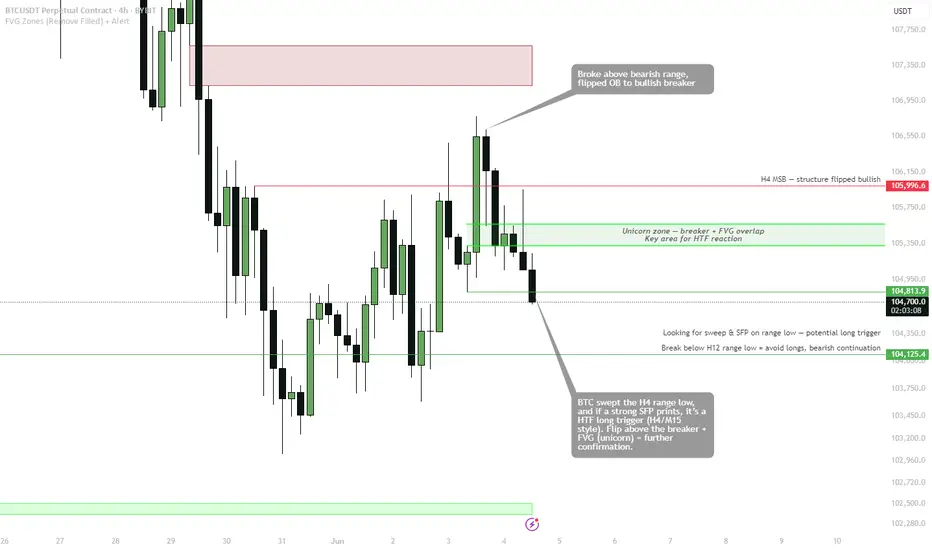
BTC - HTF confirmation pending...BINANCE:BTCUSDT
Sweeping H4/H12 range low — watching for SFP or strong bounce as a long trigger.
H4 structure broke bullish, flipped OB to breaker (unicorn overlap).
Long on sweep & SFP, target back to H4 MSB and range high.
Break below $104,400 — plan invalid, stay flat.
Wait for candle close, don’t front-run.
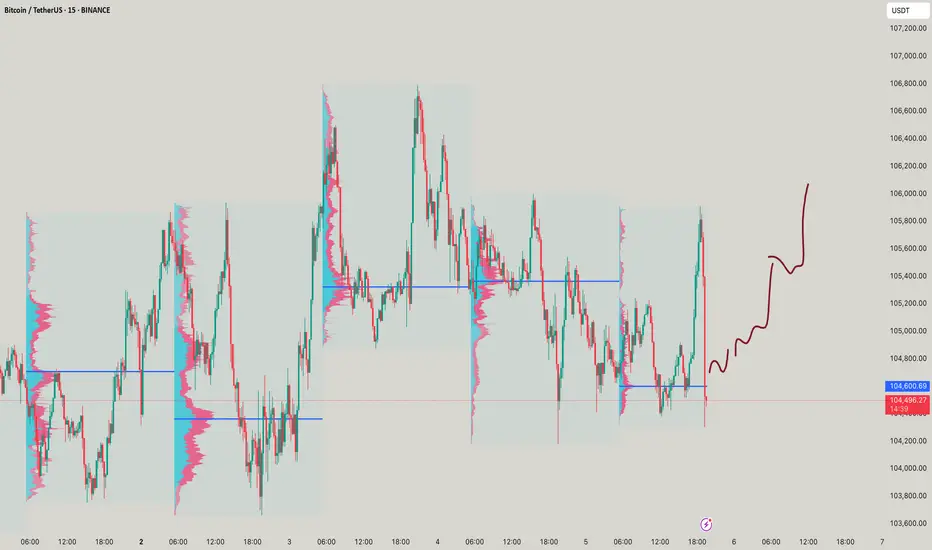
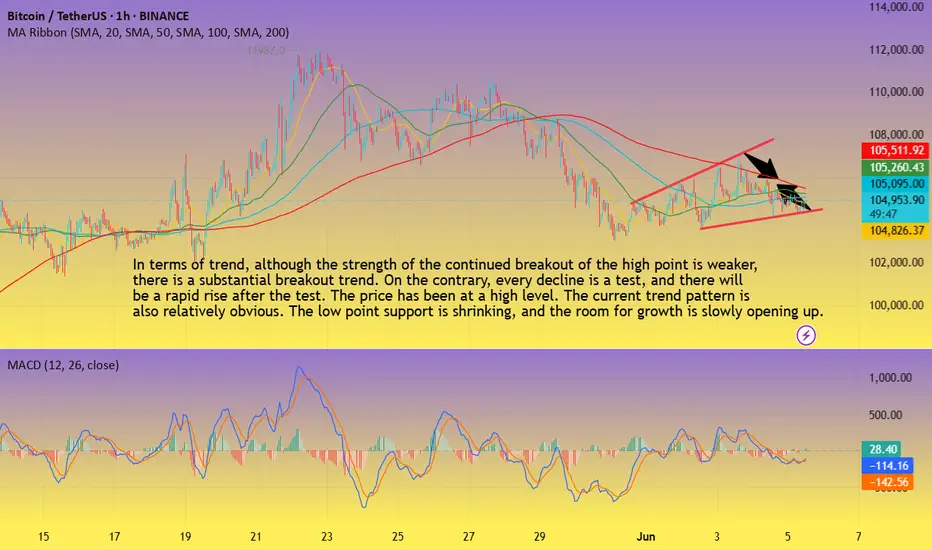
BTC-----Buy around 104800, target 106000 areaTechnical analysis of BTC contract on June 5:
Today, the large-cycle daily line level closed with a small positive line yesterday. The K-line pattern has continuous positive and negative lines, but if we look carefully, we will find that the price has been at a high level, and every retracement trend is testing support, and the rise is breaking the high, although it has not continued, so in this case, it is still very easy to pull up and break; the short-cycle hourly chart price is oscillating in a small range, and the upward channel is slowly opening in the trend pattern, and the support for the decline is moving up. This is relatively clear. The current K-line pattern is continuous positive, and the attached indicator is golden fork, so there is a high probability of rising during the day. Whether the European session can break the high is to focus on.
BTC short-term contract trading strategy:
The current price is more in the 1048000 area, the stop loss is in the 1043000 area, and the target is in the 106000 area;
VSA vs BTC: Into a Bearish Scenario or Not?Predicting the market requires skill.
Most traders fail at one crucial point: they don’t see the market as a living, breathing organism—a structure where one move leads to another, like cause and effect in motion.
That’s what we often call reading the psychology of the market. When you begin to grasp the fundamental principles behind that, you step into the realm of elite traders.
And yes—Volume Spread Analysis (VSA) is a powerful tool, but only if you know how to read it properly.
I’m not a certified trader or financial advisor, and I don’t give signals, entries, or exits. I’m simply a solo observer, sharing a slice of what true technical and fundamental analysis looks like.
And yes—it takes time. It takes skills. Now, if we want to even attempt predicting the future of price action, we must understand something: A chart is not a single truth. It’s a battlefield of conflicting signals.
Patterns, marks, levels—some suggest bullish continuation, others hint at sharp reversals. Confusion is inevitable if you don’t learn to distinguish which signs matter.
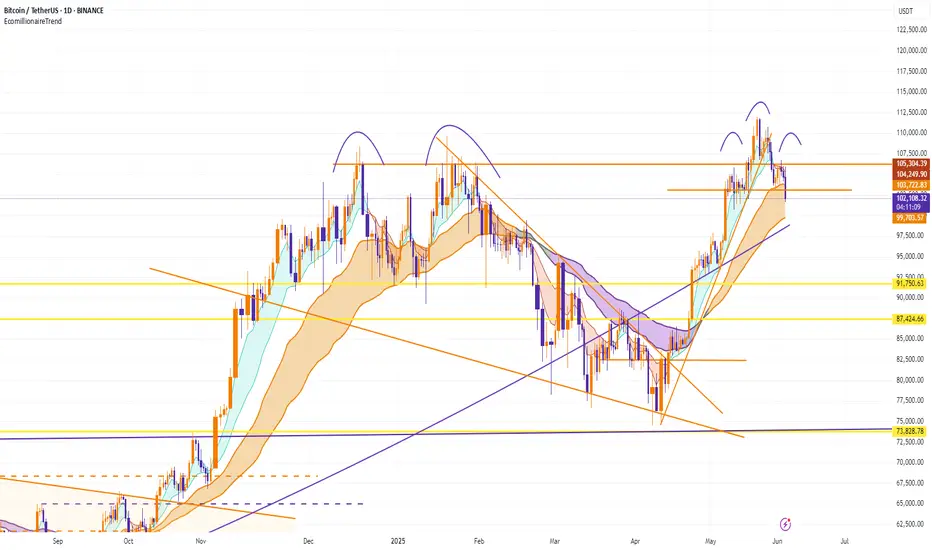
In our current BTC chart, we’re witnessing this contradiction unfold clearly:
• A bullish flag formation...
• Yet within it, the emerging completion of a Head & Shoulders pattern!
How arrogant can the market be! 😄
A moment to laugh—but also a moment to observe how cleverly the crowd is misled.
This is classic manipulation, wrapped in a textbook setup.
But what’s most telling isn’t the pattern on the surface—it’s the volume beneath the structure.
It’s always the quiet details that speak the loudest.
Before price shows its true face, volume often leaves footprints. In our case, those footprints were already leading toward a bearish path—long before the structure began to shape itself clearly.
So while retail eyes focused on the bullish flag, the underlying volume had already begun withdrawing support.
Not aggressively—no. Subtly, almost elegantly, in that familiar way institutions mask intention:
• Spikes that don’t hold
• Buying that doesn’t follow through
• And a steady fade in commitment as price climbs into weakness
It’s in those quiet inconsistencies where VSA earns its value.
It tells us: the move isn’t about what’s obvious.
It’s about what never fully materialized.
So yes, the pattern may still remain incomplete. The Head & Shoulders may yet fail to validate.
But for those who were watching volume first—not structure—the script was already being written.
✒️ From now on, professionally speaking, we must still wait:
• For the Head & Shoulders to confirm or dissolve. So eyes targeted at the swing low level near 107k
• And for volume to either legitimize or invalidate the entire setup
Only then does the chart grant us permission to speak in certainties.
🐾 But so far…
• The clues have favored the bears.
• Sell opportunities appeared early and often—for those who know what to look for.
• Bullish spikes in volume? They were met with silence.
• Momentum fizzled under a macro backdrop of fading demand.
If you were in the right mindset, and aligned even the lower timeframes to basic structural zones,
you already saw the path ahead wasn’t being carved by the bulls.
Let them finish the patterns.
Let the candles paint the story.
But for those trained in volume, the ink has already dried.
And if you're still reading, maybe you already sense it—
real insight doesn’t shout, and it never floats in abundance.
Value has never been about noise. It’s about what’s rare, quiet, and overlooked by the crowd.
Just like in the markets—the true signals aren’t loud, and they’re never free in the economic sense.
Just as price rises where supply thins, the same applies here:
what’s scarce... holds weight.
PS For last A little exercise, something to grasp on. Have you noticed how Volume & RSI behaves in lower time frames? 4Hour or 1Hour for example. Can you identify how volume confirms a bearish move. Do you discover the correct correlation and combined use between VSA & RSI. Remember my previous insight
See you next time!

BTC SHORT BTC SHORT
ENTRY : 106534.9
PROFIT : 104234.4
STOP : 107221.9
ALL trading ideas have entry point + stop loss + take profit + Risk level.
hello Traders, here is the full analysis for this pair, let me know in the comment section below if you have any questions, the entry will be taken only if all rules of the strategies will be satisfied. I suggest you keep this pair on your watchlist and see if the rules of your strategy are satisfied. Please also refer to the Important Risk Notice linked below.
Disclaimer
BULLRUN OVER - BITCOINBitcoin back to mid 97K according to my analysis. Always do your own research. I do not know anything. But I compensate my low succes rate with runners. Hopefully this is one.
