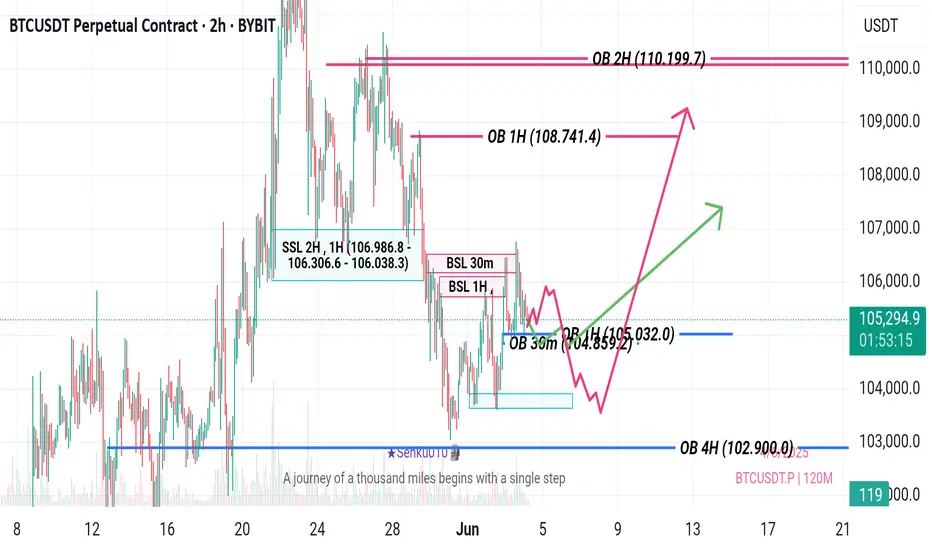
A pullback to launch the price upward The Bitcoin market structure is bullish on the daily timeframe, but the price action needs to pull back to the basic structure levels. Nothing new—just repeating the same pattern, as I mentioned in the chart.
BTCUSDT.P trade ideas

TradeCityPro | Bitcoin Daily Analysis #107👋 Welcome to TradeCity Pro!
Let’s dive into Bitcoin and key crypto indices. As usual, in this analysis I’ll walk you through the triggers for the New York futures session.
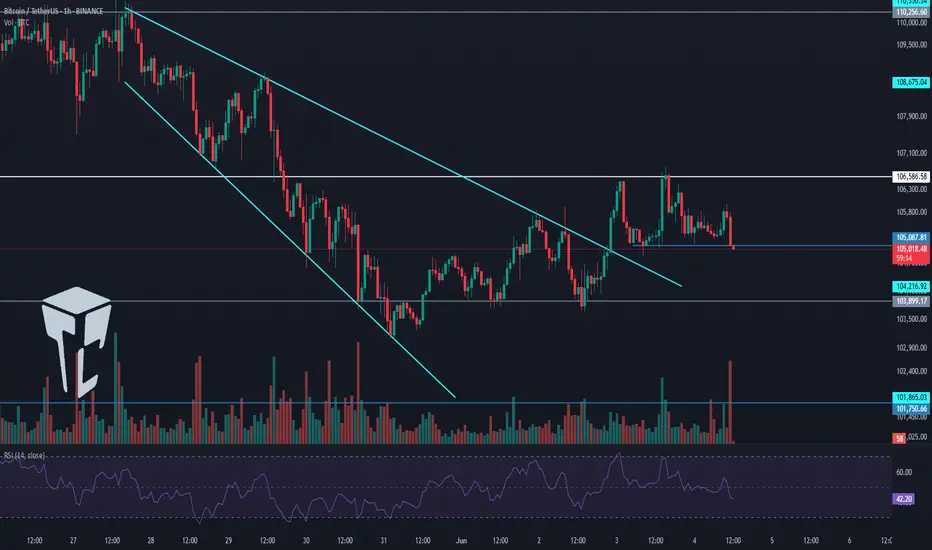
⏳ 1-Hour Timeframe
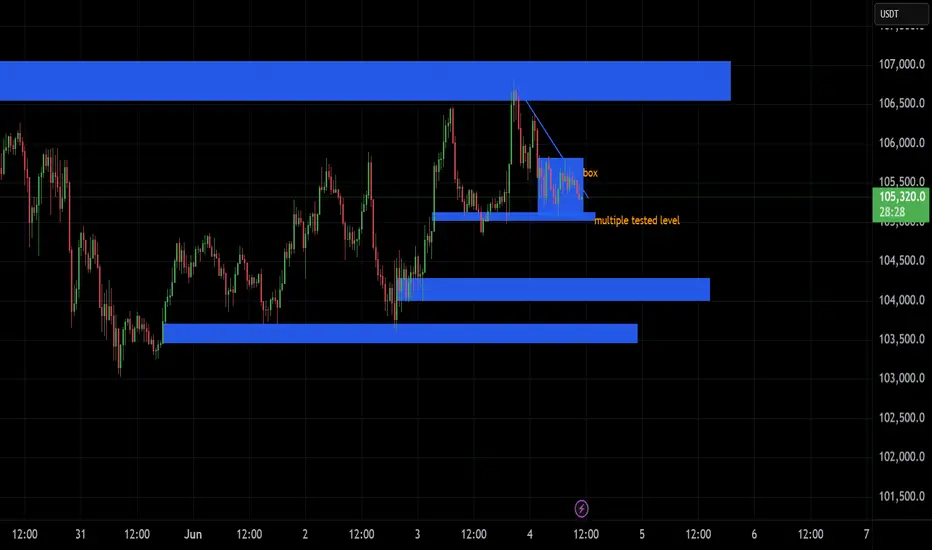
As you can see in the 1-hour timeframe, yesterday the price made another upward move and formed its resistance at the 106586 level and a bottom at 105087.
📈 For a long position, considering the uptrend in higher timeframes such as the daily and weekly, we can enter upon a breakout of 106586. A bounce of the RSI from the 50 level can act as a good confirmation for the position.
📊 Buying volume is currently increasing, but the price is still sitting on the support bottom and hasn’t moved upward yet. If this volume inflow continues, a breakout of 106586 would be a strong confirmation for a long position.
🔽 For a short position, the first trigger is the breakdown of the 105087 bottom. If this level is broken, we can enter a short. The main short trigger is at 103899.
💥 Conditions are currently favorable for a short position, and the current candle has strong bearish momentum. So, if 105087 breaks, a short position would be appropriate.
👑 BTC.D Analysis
Let’s look at Bitcoin Dominance. After a pullback to the 64.23 level, the next bearish leg continued to 63.93. If 63.93 breaks, the downtrend is likely to continue and the price could fall to 63.50.
✅ If 63.93 holds, dominance may start moving back up toward 64.67.
📅 Total2 Analysis
Now let’s check out Total2. This index is still below the 1.18 level, and breaking this level would confirm a bullish move.
✨ A new bottom has also formed at 1.17. If this level breaks, we can look for a short position.
📅 USDT.D Analysis
Now to Tether Dominance. This index has formed a box between 4.64 and 4.70.
🔔 A breakout above 4.70 could initiate a bullish move in dominance, while a breakdown below 4.64 could trigger a bearish move.
❌ Disclaimer ❌
Trading futures is highly risky and dangerous. If you're not an expert, these triggers may not be suitable for you. You should first learn risk and capital management. You can also use the educational content from this channel.
Finally, these triggers reflect my personal opinions on price action, and the market may move completely against this analysis. So, do your own research before opening any position.
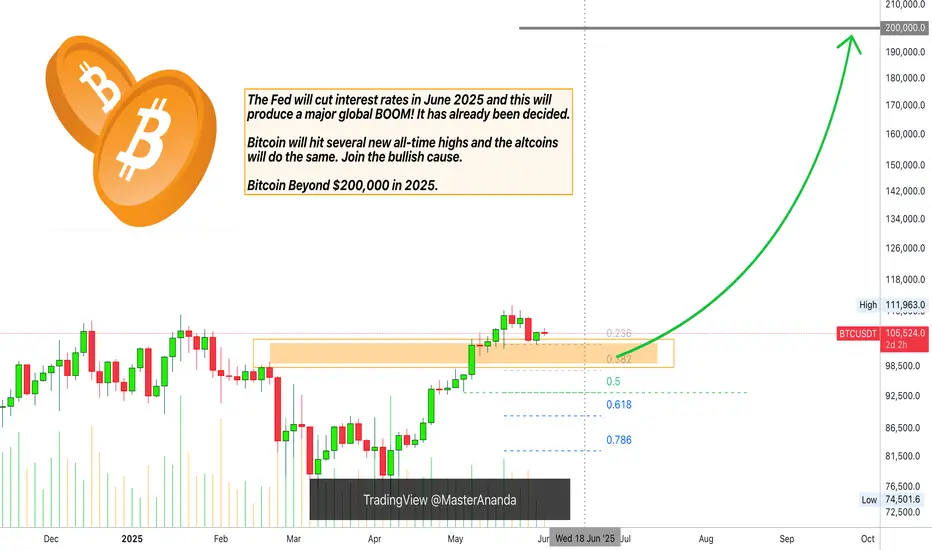
Bitcoin & The FED June 2025 (Beyond $200,000 New All-Time High)Before a major bullish event, the market tends to go sideways or into a retrace. Since the event is bullish, prices grow. Preceding the event the market gives out everything that isn't what will happen after the event, like a detox.
Now, Bitcoin is a very strange monster, kind of like a virus but in the good sense of the word. It changes, mutates, evolves, upgrades outdated decaying systems. So it isn't likely to crash just because the market is about to turn ultra-bullish. It is the other way around, since everybody already knows, nobody is willing to sell. In reality, everybody is buying like there is no tomorrow.
So Bitcoin can go sideways or into retrace until the Fed announces that it is cutting whatever interest, you know these things. So when they do their thing, the market will be ultra-bullish and that's when Bitcoin will produce its bullish continuation. Right now there is a period of consolidation which is being used by the whales as accumulation.
Remember when I was saying you will look like a genius for buying below 80K?
It is the same situation all over again. When Bitcoin is trading at $150,000 or $200,000, you will look like a genius for buying below $110,000. That's the way it is.
So, slightly bearish before the event. There can be a market flush but these are going to be limited because Bitcoins can be lost forever. It is a fight between whales. So if some whales decide to manipulate the market trying to cause some panic, other whales will be happy to buy everything at the lows and prices recover.
This means that Bitcoin will be consolidating until the announcement, after the announcement; "We will cut rates certain numbers of points..." Then all heaven will break loose. It will be money-up good news.
Do what you do, just be good, know that Bitcoin and Crypto will grow there is no way to stop this wave we are all going up. Those that were hating are going to be hated by their own selves because nobody will know who they are. We are going to be party-rocking like a rockstar because not only Bitcoin but we are going on a global bull market. You can bet on it. And if you do, you will be glad you did and you will be extremely happy with the result.
There is no way to stop Bitcoin.
There is no way to stop this wave.
The entire Cryptocurrency market will do awesome in late 2025. Are you prepared?
Thank you for reading.
Namaste.
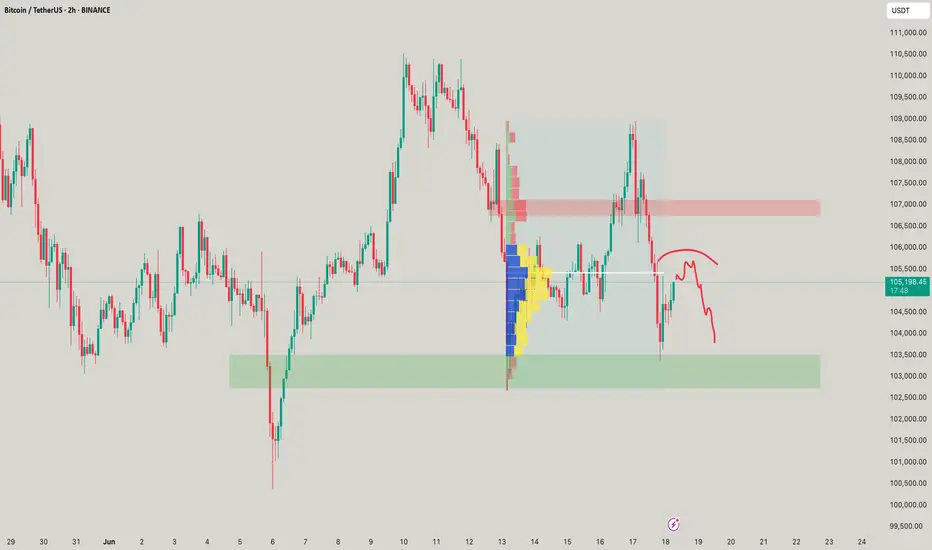
Possible Bear MoveCurrently monitoring its bearish trend and identifying additional potential zones for shorting opportunities.
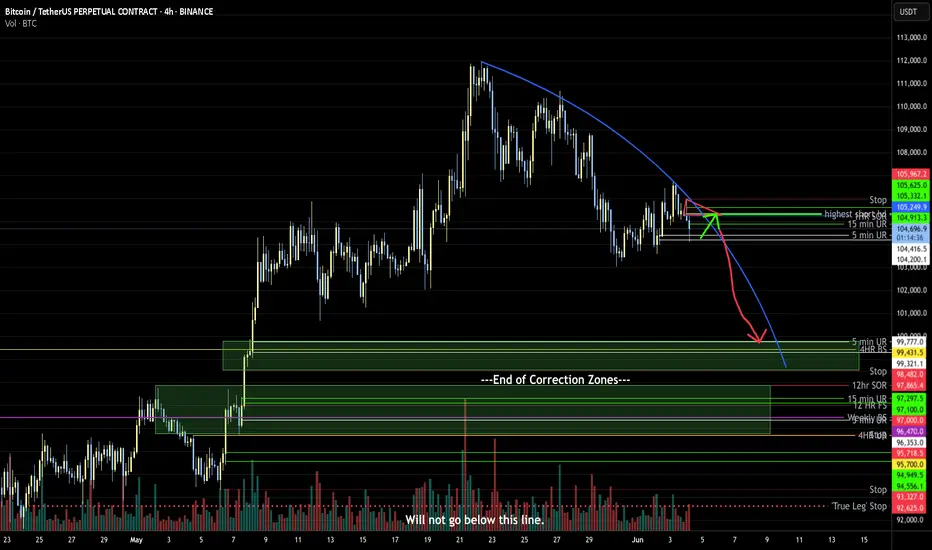
Bitcoin Overall: One More leg down -> Correction finishedIt's likely that BTC will find a short off of the indicated range and move lower to one of the indicated ranges, at which point the correction will have ended and another move to new ATH can begin.
BTC update - June 04 2025Following the previous analysis on BTC, we saw Bitcoin as it crossed below the blue trendline and dumped towards lower levels.
BTC has spent the past couple of days retesting the broken level of 106,700 and now it seems the retest is complete and BTC is ready to continue its move towards lower levels.
Once again it is advised to look for Short setups across the market.

BTC - targeting 98k4H TF
*chart inverted
Observing a trendline break - next leg down would be 98k (-6% retracement)
BTCUSD Breakdown Alert | Bearish Momentum Setup in PlayHello traders!
After a strong uptrend, BTCUSD has now broken below the ascending trendline and is retesting from the underside — a classic bearish continuation signal. This could mark a key shift in market structure.
🔍 Key Observations:
Initial consolidation acted as a launchpad for the prior move.
Clean uptrend with higher highs and higher lows.
Recent trendline break suggests weakening bullish momentum.
Price is currently retesting the trendline from below — often a signal of incoming downside if confirmed.
📉 Bearish Scenario:
If this retest holds, BTCUSD may drop toward $105,000, with the next major support around $102,400. A break below that zone could accelerate the downtrend.
Targets / Support levels
Short-term: $105,000
Major support: $102,400
⚠ Risk Management:
Stick to your trading plan — use stop-losses and size positions carefully. No setup is guaranteed. Follow price action, not the hype.
📊 What’s your bias? Bullish or Bearish?
👍 Like & 🔔 Follow for more technical setups!
#CryptoAnalysis #BTCUSD #TrendlineBreak #TechnicalAnalysis #BearishSetup #TradingView #SupportAndResistance #PriceAction

Today's BTC trading strategy, I hope it will be helpful to youBitcoin has seen a particularly strong rally recently, even breaking through the $110,000 mark, but has pulled back slightly in recent days. Given the current situation, the correction after the previous rapid rise is normal. However, from a long-term perspective, there are still many bullish factors. For example, with economic instability in many parts of the world, countries have been printing large amounts of money to stimulate their economies. As the supply of money grows, assets with a fixed quantity like Bitcoin become more valuable, leading to increased buying demand and upward price momentum. Additionally, more and more powerful institutional investors are taking an interest in Bitcoin. Financial giants like BlackRock are investing large sums of capital, and the influx of substantial funds can also drive Bitcoin's price higher.
From a technical perspective, although the price has declined slightly in recent days, it remains above the 20-day moving average (approximately $102,500) on the daily chart, indicating that the medium-term upward trend has not been disrupted. Another indicator, the RSI, is currently around 50—a neutral level—with an upward movement signaling renewed bullish momentum. Furthermore, the Bollinger Bands have begun to narrow, with the upper band at $106,000 and the lower band at $102,000. The price fluctuating within this range suggests that a significant breakout may be imminent.
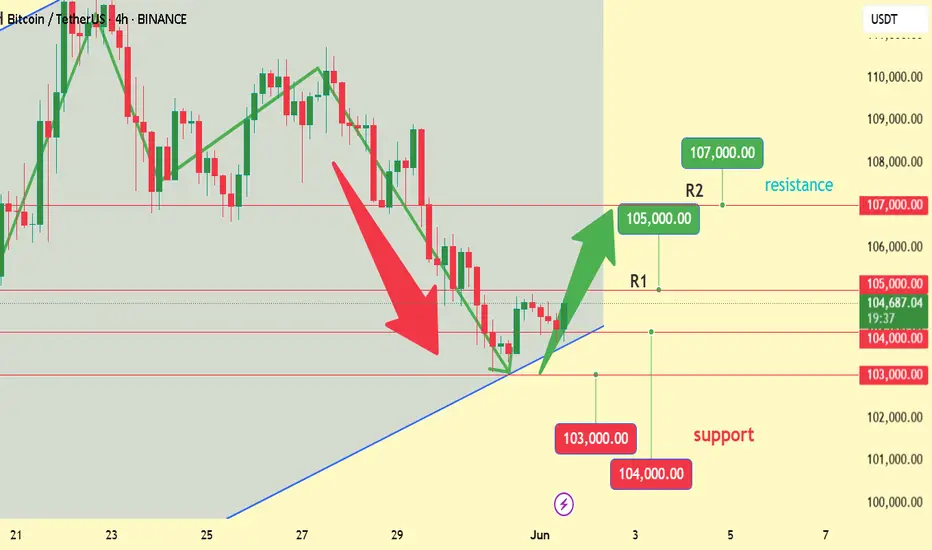
Today's BTC trading strategy, I hope it will be helpful to you
BTCUSDT BUY@103000~104000
SL:101000
TP:105000~107000
BTC Bias consistently points to a dominant and well-established bullish market structure.
strong bullish bias. While short-term reactions might occur after significant liquidity sweeps, the underlying institutional order flow supports further upward momentum
BTC Possible Double BottomBTC I think have a possibility to form a double bottom pattern on daily timeframe aiming to 97k area?

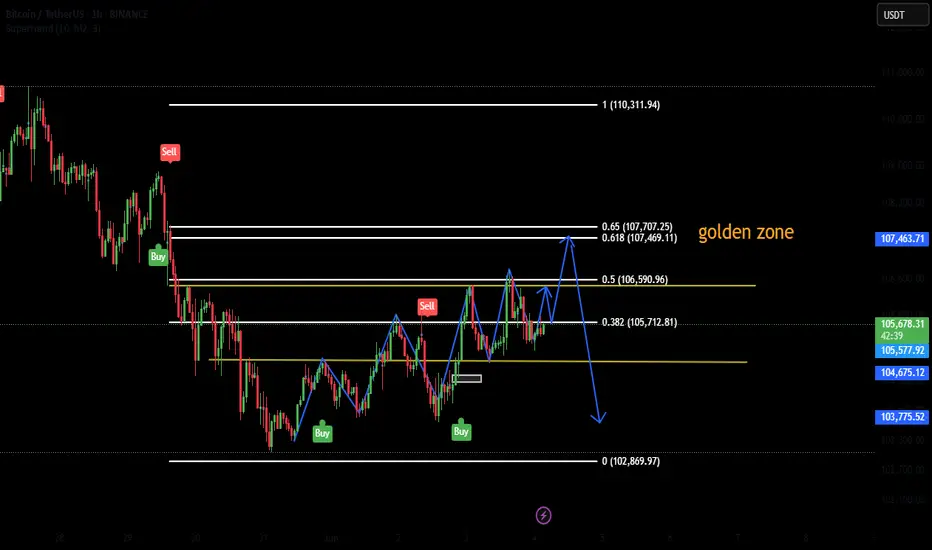
Bitcoin 1H Breakout or Rejection?"Bitcoin is currently in a short-term uptrend, forming higher highs and higher lows on the 1-hour chart. The price is approaching a critical resistance area known as the Golden Zone.
📌 Key Levels to Watch:
0.382 Fib: $105,712
0.5 Fib: $106,590
Golden Zone (0.618–0.65 Fib):
$107,469 – $107,707
Support: $103,775 / $102,869
📝 Trade Idea:
🚀 Long Setup:
Above $105,712 targeting $106,590 and the Golden Zone ($107,469–$107,707)
🔻 Short Setup:
Look for bearish rejection signals within the Golden Zone to target back down toward $103,775 – $102,869
⚠️ Reminder:
Wait for confirmation signals (candlestick patterns, break and retest, or indicators alignment) before executing any trades. Stay disciplined!
BTC- Can it reach 97Kish?As thing suggests the move can only be done when heavy fall is there, but as suggests lets small scalp things to our best!
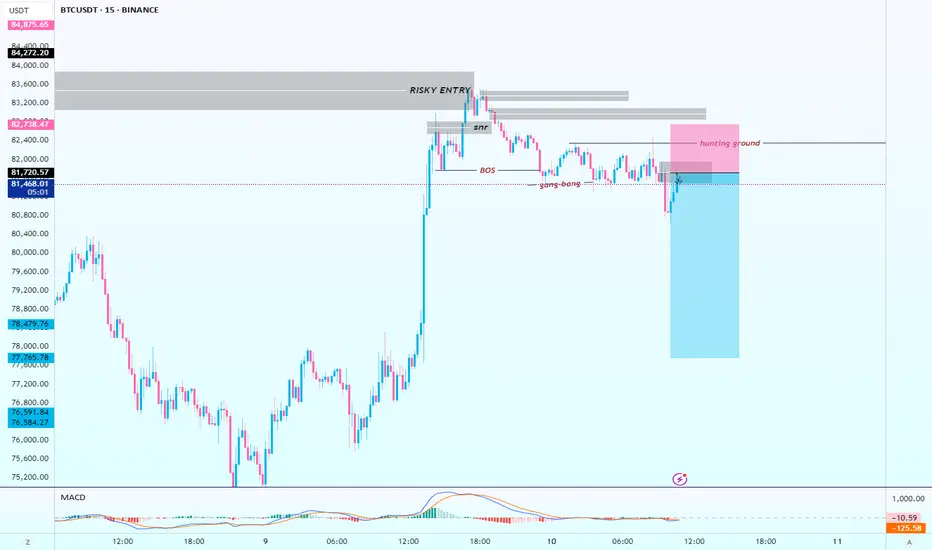
BTC/USDT Long Trade Setup – 1H Chart AnalysisBTC/USDT Long Trade Setup – 1H Chart Analysis
BINANCE:BTCUSDT
Hello traders! Sharing a recent long entry I took on Bitcoin (BTC/USDT) based on price action and liquidity concepts. This trade is taken on the 1-hour timeframe and aligns with my strategy of combining liquidity sweeps, support zones, and market structure shifts.
---
🔍 Trade Overview:
Entry Price: 104,704 USDT
Stop Loss: 103,660 USDT
Take Profit (Target): 108,349 USDT
Risk-to-Reward Ratio (RRR): Approximately 1:3
---
🧠 Trade Idea Behind the Entry:
As you can see on the chart, BTC had been in a downtrend and recently made a strong move into a key liquidity zone. This zone had previously seen multiple touches and rejections, making it an area of interest for both buyers and sellers.
The price swept liquidity below the previous low (labelled as “Liquidity Sweep $$$”), grabbing stop losses of early buyers and triggering limit orders of smart money. This move into the liquidity zone was followed by a strong bullish reaction – a signal that buyers may be stepping in.
Additionally, the "Break of Structure" (BOS) confirms a potential shift in market direction. The reaction from the liquidity zone indicates that this level is holding as new support.
---
🛠️ Why I Took the Trade:
1. Liquidity Sweep: The wick that pierced the liquidity zone signals stop-hunting and accumulation. These moves often precede a strong reversal.
2. Demand Zone Reaction: After the sweep, the candle closed bullish inside the demand box. This shows buyer strength.
3. Risk Management: The stop loss is set just below the liquidity zone to protect from deeper sweeps while keeping the RR healthy.
4. High Probability Target: The target is placed near the next resistance level around 108,349, which also aligns with a clean imbalance that price may want to fill.
---
📊 Technical Confidence:
Confluence Factors:
✅ Liquidity sweep
✅ Demand zone reaction
✅ Market structure shift
✅ High RR
✅ No immediate resistance till target
This type of setup reflects smart money behavior – first pushing price below structure to grab liquidity and then reversing sharply. The bullish momentum after the sweep gave extra confirmation.
---
🧭 What I’m Watching Now:
I will continue monitoring how price reacts around the 105,500–106,000 range. If momentum continues with higher highs and higher lows, I may trail my stop loss to lock in profits.
---
Let me know what you think of this setup! Have you taken a similar trade or are you waiting for confirmation? Drop your thoughts or charts below 👇
Stay disciplined, manage your risk, and trust the process. 🚀
#Bitcoin #BTCUSD #PriceAction #LiquiditySweep #SmartMoney #CryptoTrading #TradingSetup #TechnicalAnalysis #TradeJournal

#Bitcoin Roadmap for 2025–2026 A Deep Corrective Scenario UnfoldI believe the major top for Bitcoin was already printed on May 21st, at $111,000.
From here, I expect a three-wave corrective structure to unfold:
• 🔻 First drop to $69,000
• 🔼 Then a relief bounce to $85,000
• 🔻 Followed by a deeper decline to $46,000
If Bitcoin breaks the historical ascending trendline after reaching $46,000, I anticipate a five-wave bearish structure to continue:
• Further drop to $33,000
• Temporary correction up to $45,000
• And finally, a capitulation wave towards $19,000
I know this may sound early or even extreme to some, but if you review my previous Bitcoin outlooks going back to 2014, you’ll notice that many of these scenarios—however bold—have eventually played out with precision.
📌 Invalidation Level:
This scenario would be invalidated if Bitcoin closes a weekly candle above $115,000.
Good luck, fellow traders—stay sharp and prepared. 🧠📉
⸻

Bitcoin | Long | 3hrsThis technical analysis is for informational and educational purposes only. It does not constitute financial advice. Remember to always research and consult with a professional before making investment decisions. Good luck! 📈💼🚀

BTC for long *The content on this analysis is subject to change at any time without notice, and is provided for the sole purpose of assisting traders to make independent investment decisions.
Test the crucial round-number threshold of $100,000.Affected by sudden news factors, the Bitcoin market has seen sharp fluctuations. The price started a significant downward trend from the $108,900 level and has dropped to around $104,000 as of now. This decline has caused Bitcoin to break through multiple key support levels.
On the daily timeframe, the originally important support range of $106,000 - $107,000 was easily breached, with market bearish forces gaining absolute dominance. Bitcoin is facing significant downward risks and is highly likely to continue falling to test the crucial psychological level of $100,000.
you are currently struggling with losses,or are unsure which of the numerous trading strategies to follow,You have the option to join our VIP program. I will assist you and provide you with accurate trading signals, enabling you to navigate the financial markets with greater confidence and potentially achieve optimal trading results.
Trading Strategy:
sell@104000-104500
TP:102000-1025000

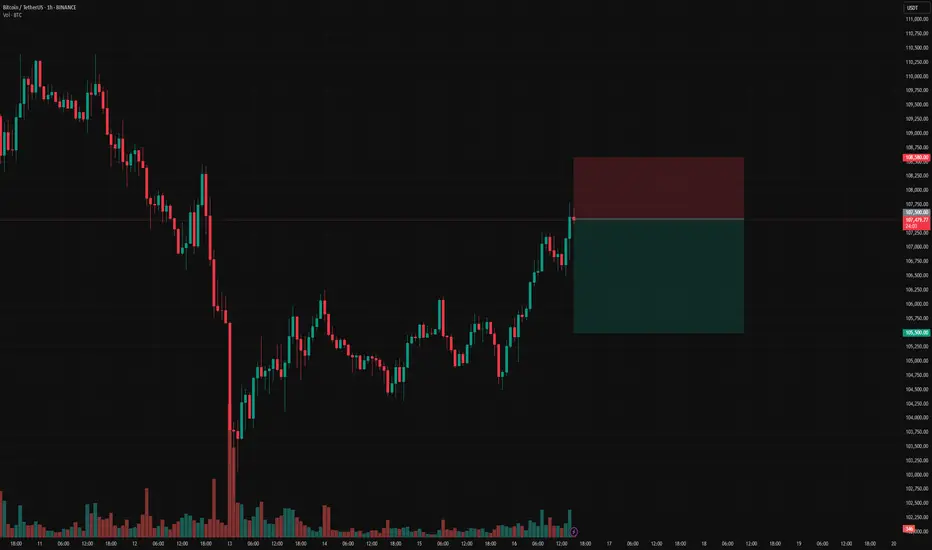
BTCUSDT ShortSet-up: Fade breakouts inside 2‑day 1 % VWAP band
Entry: $107 k‑$107.5 k
Stop: 0.5% -> 108k
Target: Re‑enter VWAP mean $105.5 k
R:R: 3:1
BTC POC, Golden Pocket, S1, FVG confluence @ 105kBTC POC, Golden Pocket, S1, FVG confluence @105k
Nice confluence here for a bounce. I would take profit quickly though with bearish momentum still strong.
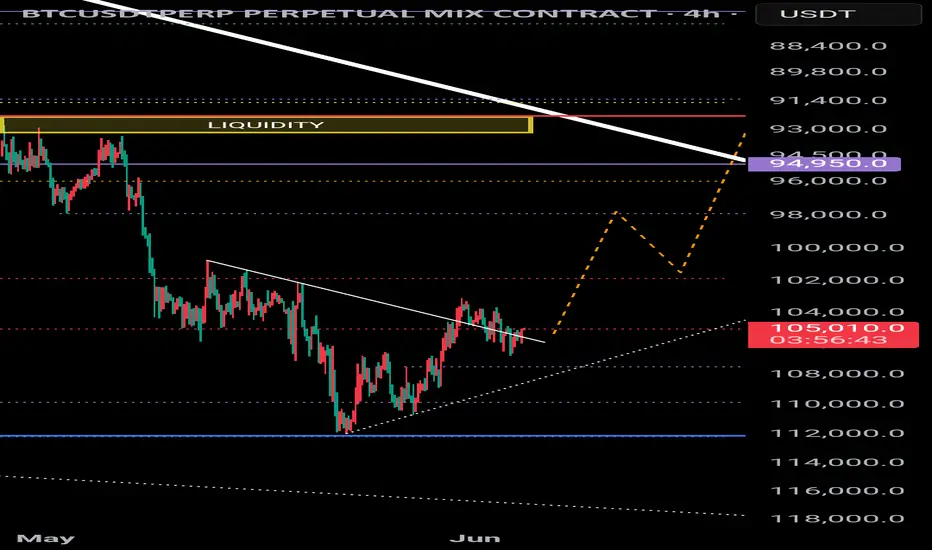
BTC - AnalysisWe’re currently back at the short-term trend reversal zone,
which has been reactivated after price moved 3% away from it.
The zone itself spans 1.6%, so a new reaction from this level is likely.
If the bottom at $102,500 holds,
we’ve activated a valid bullish structure that could take us up to the $119,000 target zone —
which also overlaps with a weekly target region.
We’ll see what the next few days bring...
Key events to watch right now:
1️⃣ Israel & Iran – Will the conflict escalate or calm down?
2️⃣ Tomorrow’s FOMC meeting – Will QT be addressed?
Feel free to drop any questions or feedback —
I’ll read and respond to everything.
LFG 🚀

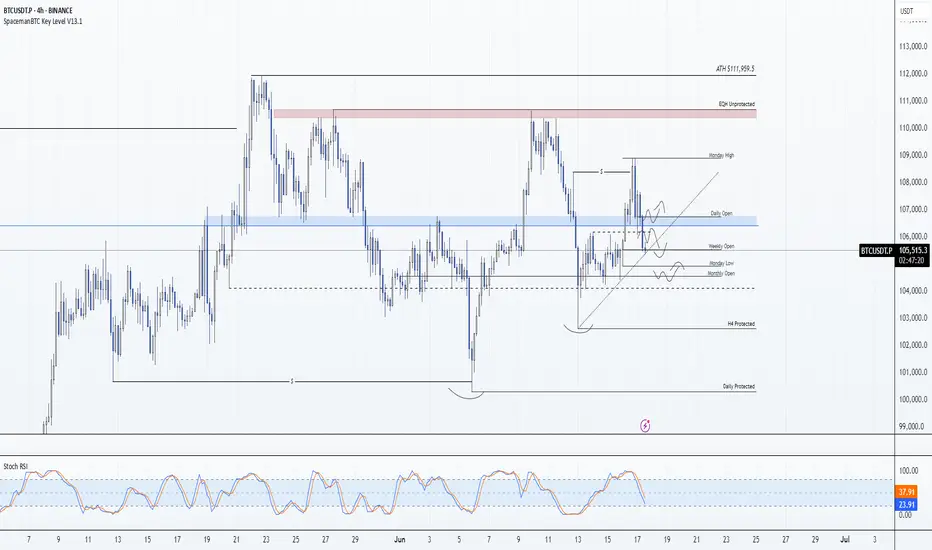
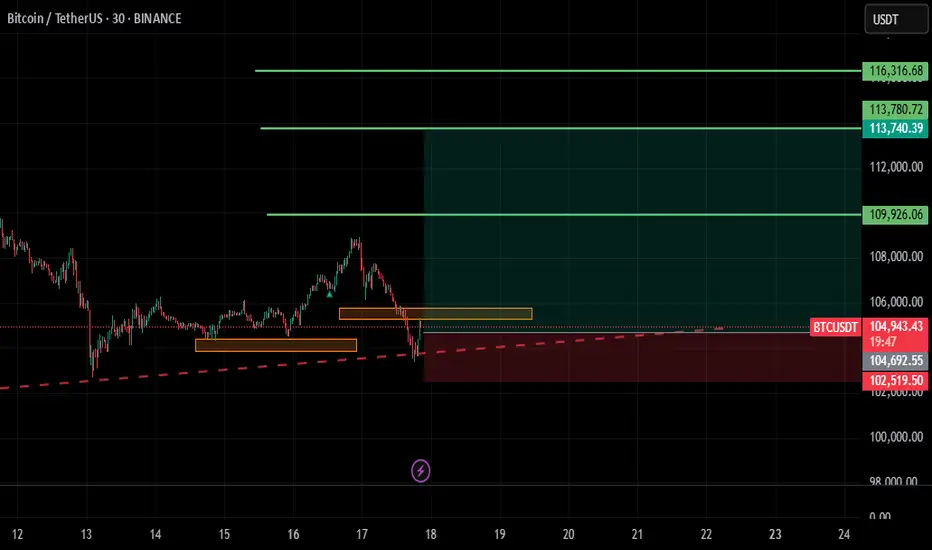
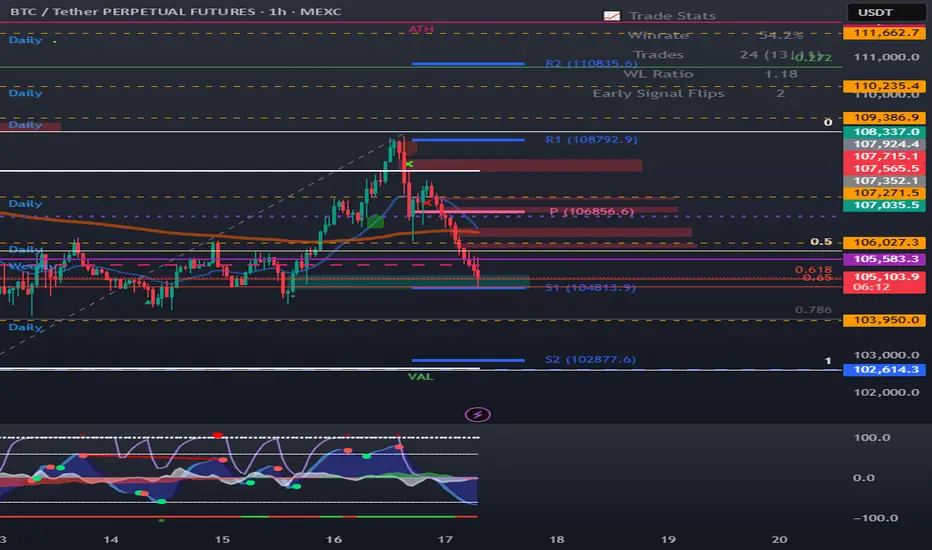
BTC Bias Map: 17/06/25Daily Bias Map:
- Bitcoin lost key support at 106,500
- I am leaning more bearish now that this key support is lost.
- Market is heavily driven by news and uncertainty.
- Key levels like Monday low and monthly low cluster in the same region — likely last bastions of support.
- Expecting a possible larger shakeout toward weak lows nearby, which don’t look appealing for entries.
- Will watch for potential long scalp triggers around monthly open or Monday low but will likely stay side-lined. Unless I see a potential good short setup form.
- With FOMC news tomorrow I’m avoiding heavy involvement the risk is not worth it in this volatile environment.
Discipline means knowing when to step back. In all likelihood I'll let the market develop today unless a extremely clean trade develops.