Bitcoin Multiframe: Key clusters to watch before FOMC__________________________________________________________________________________
Technical Overview – Summary Points
__________________________________________________________________________________
Momentum: Dominant bullish structure across all major timeframes (MTFTI = Up).
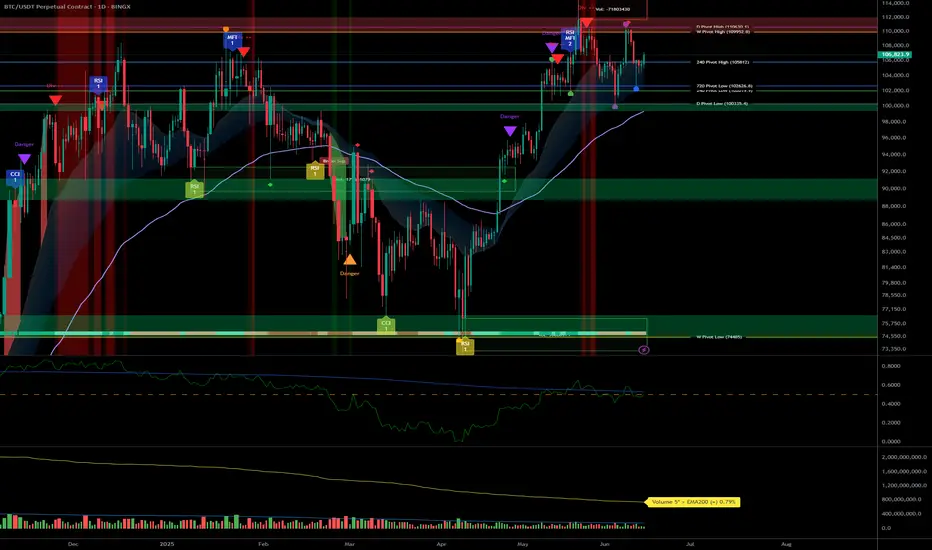
Supports/Resistances: No HTF pivot engaged; key on-chain support at $97.6k, resistance at $115.4k.
Volume: Central oscillation within range; no major surges observed, consolidation on micro-TF.
Multi-timeframe behaviors: Bullish structure dominates, technical pullback on 4H-1H-15min without major breaks.
__________________________________________________________________________________
Strategic Summary
__________________________________________________________________________________
Overall Bias: Structurally bullish as long as key supports hold (97.6k–104.5k zone).
Opportunities: Buy confirmed dips on on-chain cluster/H4-H2 area, target 110–115k extension post-FOMC positive catalyst.
Risk zones: Extreme volatility expected around FOMC (June 17–18); strict risk management, avoid overexposure.
Macro catalysts: FOMC (rate decision, dot plot), Fed leadership stability, Israel-Iran geopolitical tensions.
Action plan: Patience until FOMC; favor setups on clear price reaction, tight stops below 97.5k (on-chain support).
__________________________________________________________________________________
Multi-Timeframe Analysis
__________________________________________________________________________________
1D: Bullish momentum, price at range center ($106k). Watch for pivot break.
12H: Persistent bullish bias, confluence with 1D.
6H: Expected consolidation, bullish structure.
4H: Technical pullback, bullish structure remains. Key anticipated support 105k–104.5k.
2H: Likely move towards lower range. Up bias confirmed.
1H: Technical correction within overall Up trend.
30min/15min: Seller sequence, trend intact, no major break.
Risk On / Risk Off Indicator remains “Up” across all frames, boosting the positive view despite short-term correction.
Executive summary:
Strong bullish convergence from Daily → 15min timeframes.
Ongoing short-term pullback, no HTF pivot breaks.
Any break below $97.6k would invalidate the swing bullish scenario.
__________________________________________________________________________________
Macro, Economic Calendar, On-chain & Risk Management
__________________________________________________________________________________
Macro:
FOMC imminent (June 17–18): waiting – volatility on rate/dot plot.
Geopolitical risk (Iran-Israel): sustained global risk-off may escalate.
BTC shows strong resilience at 106k.
Economic calendar (key points):
June 17–18: FOMC — maximum impact (stocks, FX, crypto)
June 17: Fed leadership rumors — potential volatility, BTC stable
June 17, 08:30 UTC: USA — retail sales (May/core)
On-chain:
Key support at $97.6k (STH cost basis), resistance at $115.4k.
Long-term holders are distributing, but bullish accumulation pressure intact.
Clustering may amplify short-term directional moves.
Key scenarios:
Bullish: Extension to 110–115k if FOMC positive, stop below 97.6k.
Bearish: Break of 97.6k = risk of drop towards 92.9–95.4k.
Management: Avoid exposure pre-FOMC, active monitoring, strict stops.
Patience & discipline: Only size up with post-FOMC validated reaction or confirmed breakout. On-chain cluster = invalidation radar for bullish bias.
__________________________________________________________________________________
BTCUSDT.P trade ideas
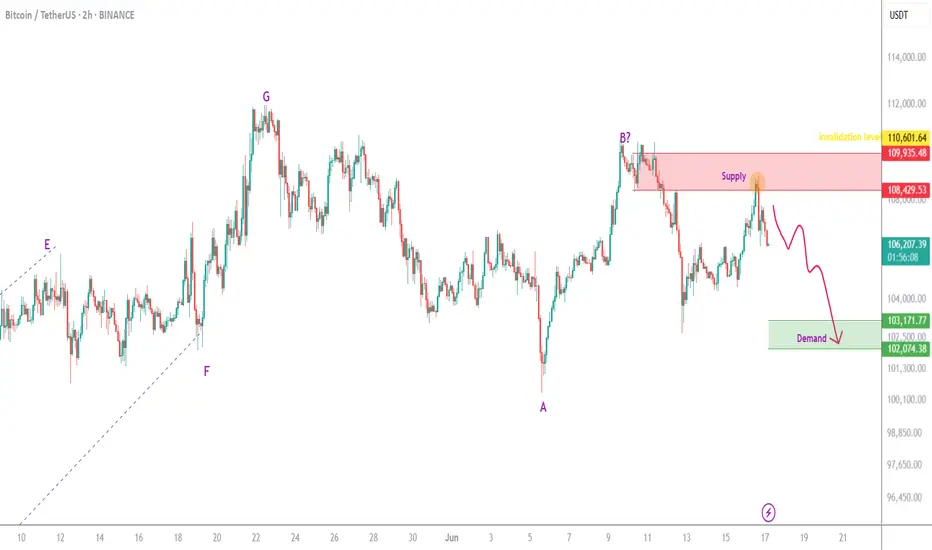
BTC is still bearishThe red zone seems to have had enough orders to reject the price downward. It is expected that the price will drop at least to the green zone below.
There will be some fluctuations along the way.
A daily candle closing above the invalidation level would invalidate this analysis.
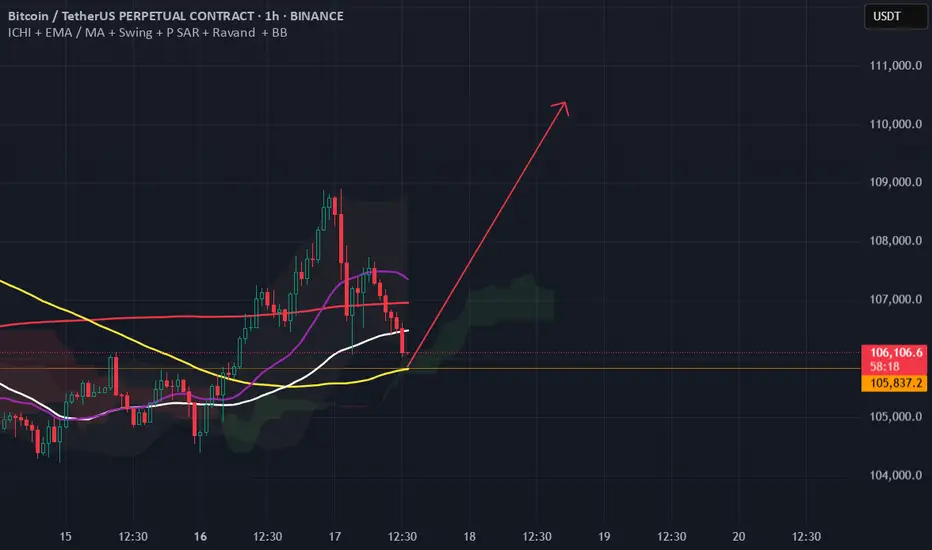
BTCUSDTHi . after a crash market because of war , we can get big gain of this chance , MA 100 in 1h can hold and Reverse move to 110300$ . #BTC LONG Limit buy : 105800$ , Lev : 100x , SL : 105500$ , Target : 110300$
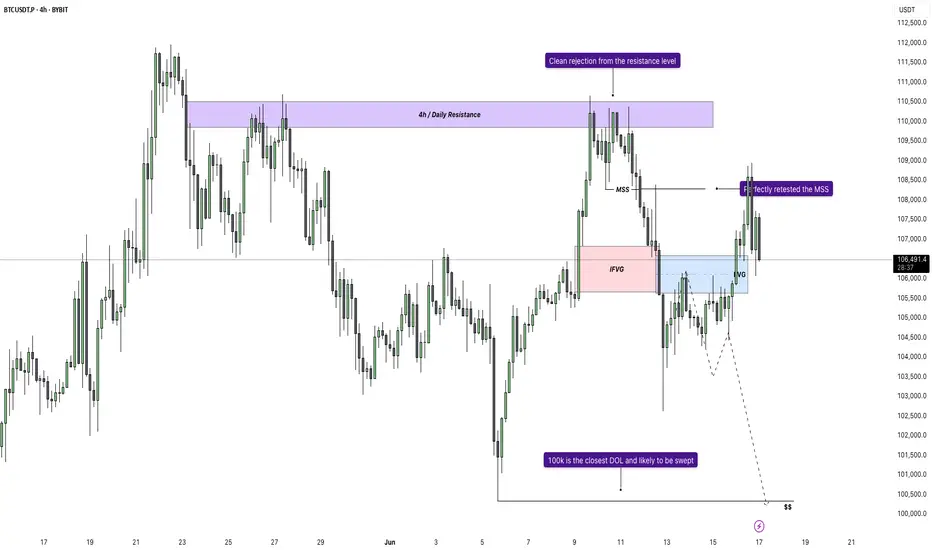
Bitcoin - Bears vs Bulls: $100k next?Price recently tapped into a well-defined 4H and daily resistance zone and was met with an immediate rejection. That rejection wasn’t just a reaction, it led to a confirmed market structure shift as price broke the previous low. This transition from higher highs to a lower low signals the first sign of bearish control, flipping the short-term bias and setting the tone for a move lower.
Retest of MSS and Inversion Fair Value Gap
After the break in structure, price retraced directly into the origin of the move, retesting the same zone where the shift occurred. A previously bullish 4H gap has now flipped into resistance, rejecting price perfectly. This inversion, where a bullish imbalance turns into a bearish reaction zone, confirms the change in direction and strengthens the downside narrative.
New FVG as Entry Opportunity
The latest bearish impulse created a clean new fair value gap just above current price. A retest of this gap would offer a high-probability continuation setup, as it aligns with both recent structure and order flow. This zone becomes the critical level for bears to defend, and unless price reclaims it, the expectation remains for continuation toward lower liquidity.
Liquidity Outlook and Bearish Target
Below current price, a large pool of liquidity is sitting just above a major psychological round number. That level hasn’t been swept yet and is a likely downside magnet. With no meaningful support between the current FVG and that draw on liquidity, price is likely to reach for it next. This fits the typical sequence following a market structure shift: rejection, shift, retest, continuation, and liquidity sweep.
Momentum and Contextual Confluence
Zooming out slightly, the current move fits within broader bearish momentum that has been developing across timeframes. There’s no sign of strong bullish absorption, and each push higher has been met with efficient selling. This isn’t a chaotic breakdown, but a controlled sequence of lower highs and lower lows, supported by clean structural shifts and consistent rejection zones.
Conclusion
The chart tells a clear story. A clean rejection from a key resistance zone led to a confirmed bearish structure shift, followed by a textbook retest and fresh fair value gap. As long as price remains below that gap, the setup favors continuation lower, with the nearest liquidity pool being the most likely draw. This remains a high-probability bearish scenario until proven otherwise by a shift back above invalidation levels.
___________________________________
bitcoin oh bitcoinBitcoin has been pumping in the past few days pretty massively. Why? There are 2 main reasons - the first reason is that Bitcoin has finished a major WXY corrective wave, and the second is that Bitcoin swept liquidity below a triangle (see my previous post for details). That was a very good opportunity to buy/long Bitcoin at that specific level I described in the previous analysis. But let's focus on the present and future!
We always want to find strong levels on the charts so we have a great entry point/take profit target. The next strong level is definitely the 0.618 FIB, which Bitcoin can hit in the very short term. Also, below the 0.618 FIB, we have a strong horizontal zone, which can also act as a strong resistance. Bitcoin should definitely go there and retest this zone.
We want to see how Bitcoin is going to react in the zone and FIB, but you can create a new limit order to short Bitcoin there so you don't miss anything. So currently I am temporarily bullish on Bitcoin, and in the next update I will make a big analysis on Bitcoin and a very likely scenario for the next months. What will the price of Bitcoin be in December? Please like/boost my idea right now.
Write a comment with your altcoin + hit the like button, and I will make an analysis for you in response. Trading is not hard if you have a good coach! This is not a trade setup, as there is no stop-loss or profit target. I share my trades pri
bitcoin is hotBitcoin has been pumping in the past few days pretty massively. Why? There are 2 main reasons - the first reason is that Bitcoin has finished a major WXY corrective wave, and the second is that Bitcoin swept liquidity below a triangle (see my previous post for details). That was a very good opportunity to buy/long Bitcoin at that specific level I described in the previous analysis. But let's focus on the present and future!
We always want to find strong levels on the charts so we have a great entry point/take profit target. The next strong level is definitely the 0.618 FIB, which Bitcoin can hit in the very short term. Also, below the 0.618 FIB, we have a strong horizontal zone, which can also act as a strong resistance. Bitcoin should definitely go there and retest this zone.
We want to see how Bitcoin is going to react in the zone and FIB, but you can create a new limit order to short Bitcoin there so you don't miss anything. So currently I am temporarily bullish on Bitcoin, and in the next update I will make a big analysis on Bitcoin and a very likely scenario for the next months. What will the price of Bitcoin be in December? Please like/boost my idea right now.
Write a comment with your altcoin + hit the like button, and I will make an analysis for you in response. Trading is not hard if you have a good coach! This is not a trade setup, as there is no stop-loss or profit target. I share my trades privately. Thank you, and I wish you successful trades!
bitcoin testing waterBitcoin has been pumping in the past few days pretty massively. Why? There are 2 main reasons - the first reason is that Bitcoin has finished a major WXY corrective wave, and the second is that Bitcoin swept liquidity below a triangle (see my previous post for details). That was a very good opportunity to buy/long Bitcoin at that specific level I described in the previous analysis. But let's focus on the present and future!
We always want to find strong levels on the charts so we have a great entry point/take profit target. The next strong level is definitely the 0.618 FIB, which Bitcoin can hit in the very short term. Also, below the 0.618 FIB, we have a strong horizontal zone, which can also act as a strong resistance. Bitcoin should definitely go there and retest this zone.
We want to see how Bitcoin is going to react in the zone and FIB, but you can create a new limit order to short Bitcoin there so you don't miss anything. So currently I am temporarily bullish on Bitcoin, and in the next update I will make a big analysis on Bitcoin and a very likely scenario for the next months. What will the price of Bitcoin be in December? Please like/boost my idea right now.
Write a comment with your altcoin + hit the like button, and I will make an analysis for you in response. Trading is not hard if you have a good coach! This is not a trade setup, as there is no stop-loss or profit target. I share my trades privately. Thank you, and I wish you successful trades!

bitcoin is coolBitcoin has been pumping in the past few days pretty massively. Why? There are 2 main reasons - the first reason is that Bitcoin has finished a major WXY corrective wave, and the second is that Bitcoin swept liquidity below a triangle (see my previous post for details). That was a very good opportunity to buy/long Bitcoin at that specific level I described in the previous analysis. But let's focus on the present and future!
We always want to find strong levels on the charts so we have a great entry point/take profit target. The next strong level is definitely the 0.618 FIB, which Bitcoin can hit in the very short term. Also, below the 0.618 FIB, we have a strong horizontal zone, which can also act as a strong resistance. Bitcoin should definitely go there and retest this zone.
We want to see how Bitcoin is going to react in the zone and FIB, but you can create a new limit order to short Bitcoin there so you don't miss anything. So currently I am temporarily bullish on Bitcoin, and in the next update I will make a big analysis on Bitcoin and a very likely scenario for the next months. What will the price of Bitcoin be in December? Please like/boost my idea right now.
Write a comment with your altcoin + hit the like button, and I will make an analysis for you in response. Trading is not hard if you have a good coach! This is not a trade setup, as there is no stop-loss or profit target. I share my trades privately. Thank you, and I wish you successful trades!

bitcoin is going crazyBitcoin has been pumping in the past few days pretty massively. Why? There are 2 main reasons - the first reason is that Bitcoin has finished a major WXY corrective wave, and the second is that Bitcoin swept liquidity below a triangle (see my previous post for details). That was a very good opportunity to buy/long Bitcoin at that specific level I described in the previous analysis. But let's focus on the present and future!
We always want to find strong levels on the charts so we have a great entry point/take profit target. The next strong level is definitely the 0.618 FIB, which Bitcoin can hit in the very short term. Also, below the 0.618 FIB, we have a strong horizontal zone, which can also act as a strong resistance. Bitcoin should definitely go there and retest this zone.
We want to see how Bitcoin is going to react in the zone and FIB, but you can create a new limit order to short Bitcoin there so you don't miss anything. So currently I am temporarily bullish on Bitcoin, and in the next update I will make a big analysis on Bitcoin and a very likely scenario for the next months. What will the price of Bitcoin be in December? Please like/boost my idea right now.
Write a comment with your altcoin + hit the like button, and I will make an analysis for you in response. Trading is not hard if you have a good coach! This is not a trade setup, as there is no stop-loss or profit target. I share my trades privately. Thank you, and I wish you successful trades!
7 days ago
Note
Bitcoin hit my profit target of 0.618 FIB and continues to the upside. It looks like we are going to hit 109,000 USD in the short term, which is a very strong resistance! Middle of the previous big range, so prepare for a bounce here.
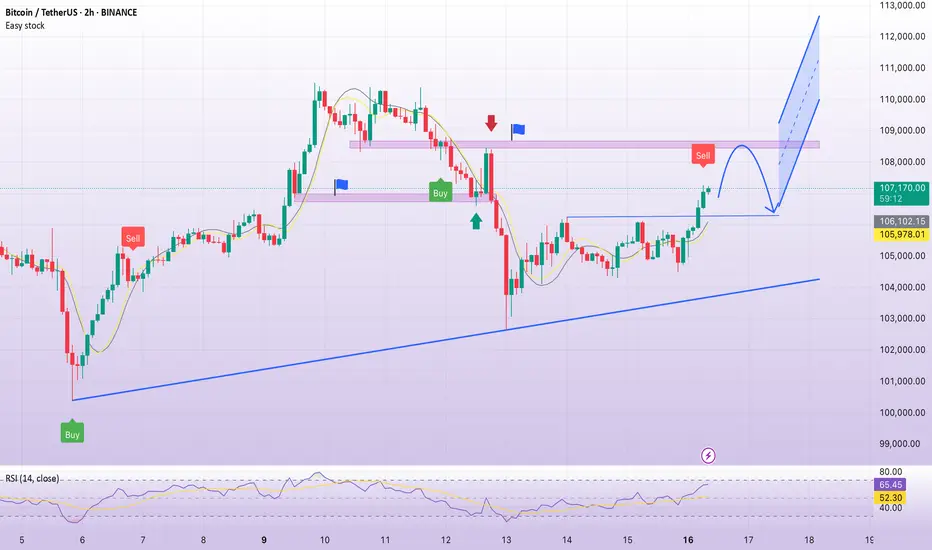
BTC PLAYING THE BOXES AND PRINTING Made good money from last trades now play new boxes
**Mastering Zones: Your Quick Trading Guide!**
Remember the core logic:
* **🔵 Blue Zone:**
* **PUMPS FROM BLUE** (Look for buys!)
* **DUMPS IF BREAKS BLUE** (Consider sells/exit longs!)
* **🔴 Red Zone:**
* **DUMPS FROM RED** (Look for sells!)
* **PUMPS IF BREAKS RED** (Consider buys/enter longs!)
Apply this to your charts for clear signals. Stay sharp!

BTC BUY OPPORTUNITY From the H1 perspective, more buy entries are made as price closed at 108712 today. A buy. Opportunity is envisaged from the current market price. Our target profit is the all time high. Take advantage of this opportunity now.
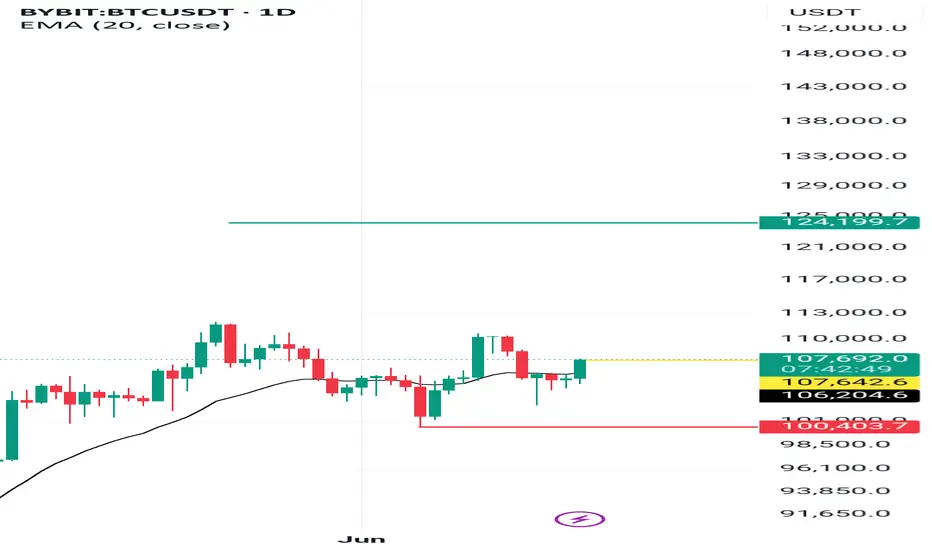
BTC VAH, Golden pocket, R3, confluence resistance at 108kBTC VAH, Golden pocket, R3, confluence resistance at 108k
We had a nice up move but now hitting a confluence of resistance. I'm looking for shorts for the correction before moving up again.
Looking at bearish divergence on smaller time frames for entry.

POC, Daily, Golden Pocket, S1 confluence support @ 104000POC, Daily, Golden Pocket, S1 confluence support @ 104000
Very strong support here. I'm putting a limit order anticipating a quick bounce.

BTC-----Buy around 107500, target 108000-109000 areaTechnical analysis of BTC on June 16:
Today, the general trend is still relatively obvious, so the trading strategy is to buy at a low price.
Today's BTC short-term contract trading strategy:
Buy in the 107500 area, stop loss in the 106500 area, and target the 108000-109000 area;

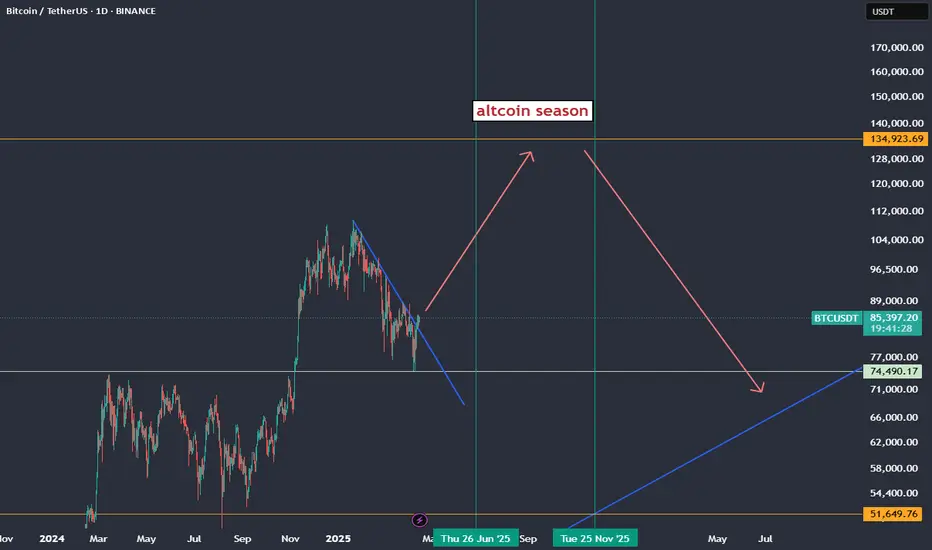
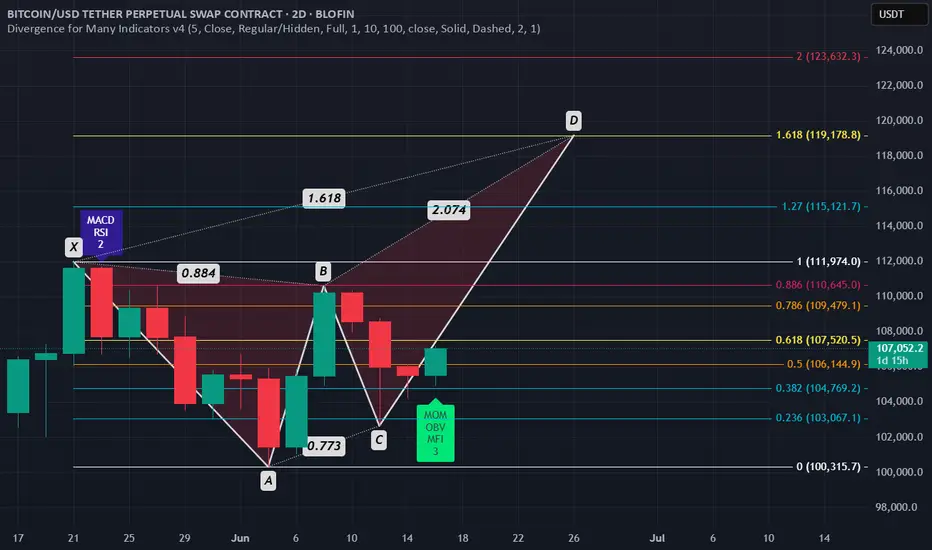
BTC doing a 1.618 means altcoin season is on🔥 Why 1.618 on BTC = Altcoin Season Coming
The 1.618 Fib extension is a common target for wave 3 or wave 5 in Elliott Wave theory. Once BTC hits it:
Many traders start taking profit on BTC.
That capital usually flows into ETH and major alts, then mid/small caps.
BTC dominance often peaks or stalls after hitting 1.618, which historically signals:
ETH/BTC starts rising
Altcoins gain strength against BTC and USDT
Retail and sidelined liquidity get attracted by BTC gains, but then chase faster % returns in alts.
🧠 Example Playbook
BTC breaks out → Runs hard → Hits 1.618 (e.g., from last correction low to current high)
ETH/BTC bottoms → ETH/USDT starts to run
Majors like SOL, AVAX, MATIC, DOT follow
Mid/small caps explode last (aka “altseason” proper)
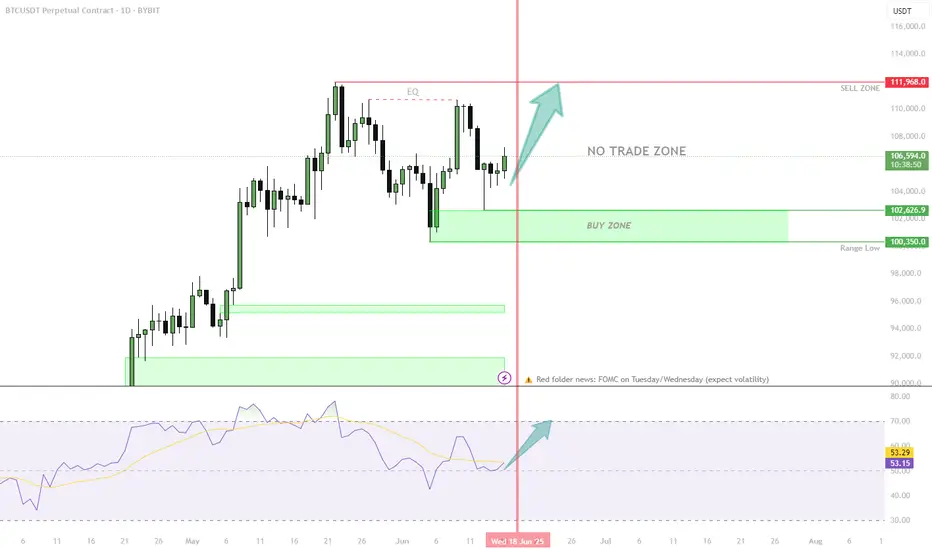
BTC Plan: 16/06/25Bitcoin Bias Map – Monday BINANCE:BTCUSDT BINANCE:BTCUSDT.P
Current Context:
- Impulsive leg up completed.
- Reclaimed 106,400–106,500 on 4H timeframe with displacement.
- Higher low established on 4H.
- Equal highs around 110,700 on 4H, immediate draw on liquidity for bulls. Beyond that, all-time highs as targets.
Key Levels:
- Support: 106,400–106,500 region.
- Risk: Loss of this region H4 likely triggers a fast revisit to ~100k.
Price Action Signals:
- H4 overbought; M30 oversold — potential scalp long entry for move toward equal highs.
- H12 neutral but moving out of oversold.
- Daily neutral but price sitting in a daily bearish fair value gap.
Trade Plan:
- No interest in shorting unless 106,400 breaks decisively.
- No confirmed swing failure point yet to justify short trigger.
- Looking to enter long on pullback when H1 becomes oversold.
- Ready to flip short if wrong with clear structure break.
Personally, looking for longs. Until 106,500 is lost my bias is up now till EQHs. this is a strong reaction

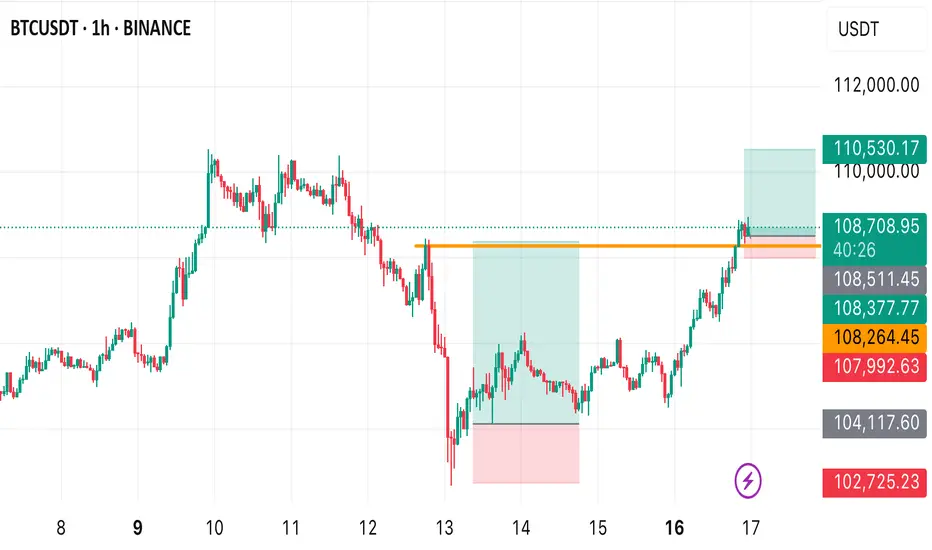
BTC Weekly Game Plan: Key Levels & Clear Setups!Short Scenario:
Enter on confirmed rejection (SFP or bearish MSB) from Equal Highs ($110,700) or BPR ($108,000)
Targets: $105,000 → $102,600 (Weekly Draw)
Invalidation (stop): Above $112,000 (Range High)
Long Scenario:
Enter on confirmed bounce (bullish MSB or SFP) at Weekly Draw ($102,600) or Range Low ($100,300)
Targets: $108,000 → $110,700
Invalidation (stop): Below $99,500 (under Range Low)
🔔 Triggers & Confirmations:
M15/H1 confirmation required: SFP or clear MSB before entry.
Avoid entries if price slices through levels without a reaction.
📝 Order Placement & Management:
🔻 Sell Limits: $110,700 & $108,000
🛡️ Short Stop: $112,100
🎯 Short Targets: $105,000 → $102,600
🔼 Buy Limits: $102,600 & $100,300
🛡️ Long Stop: $99,500
🎯 Long Targets: $108,000 → $110,700
🚨 Risk Warning:
Shorts are against HTF bullish momentum, increasing risk.
High volatility expected due to FOMC meetings (Tuesday/Wednesday).
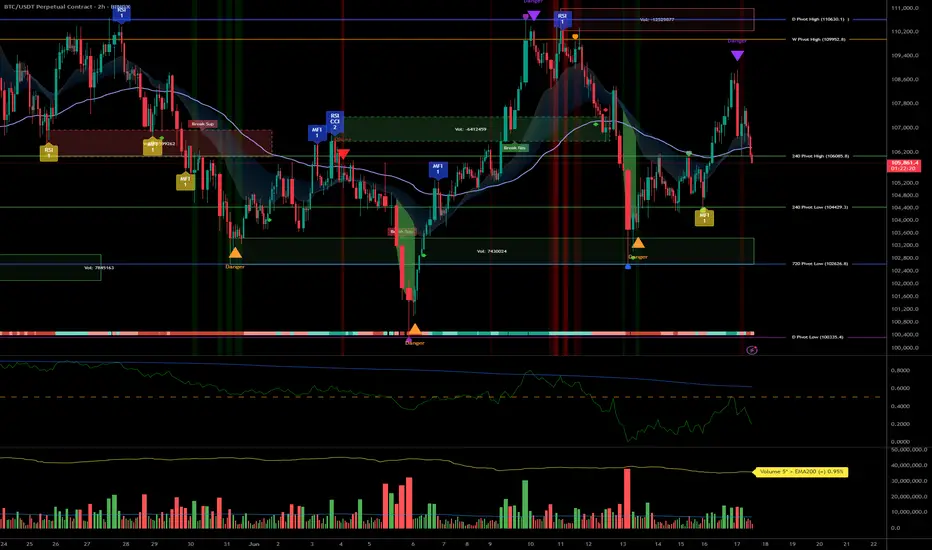
BTC/USDT: Sector Momentum and Decision Zone Ahead of the Fed__________________________________________________________________________________
Technical Overview – Summary Points
➤ Strong multi-timeframe bullish momentum, confirmed by the Risk On / Risk Off Indicator signaling “Strong Buy” across all timeframes (daily, 12H, 6H, 4H down to intraday).
➤ Major supports (102,600–104,250 $) act as the market’s anchor; the 105,800–106,100 $ resistance remains the key level to break for a confirmed further bullish leg.
➤ Volumes are weak to normal, with no recent distribution, climax, or panic/extreme behavior (ISPD DIV neutral); market remains rational.
➤ Short-term TFs (1H, 2H) are more hesitant—favoring consolidation/range, suitable for scalping or risk management rather than directional breakout trades.
__________________________________________________________________________________
Strategic Summary
➤ Dominant bullish technical context, but facing key resistance, with macro and on-chain signaling for active caution.
➤ Opportunity: Buying pullbacks on 104,250–102,600 $, targeting extension if clean breakout above 106,100 $. Partial profit-taking into the 110–111k $ highs.
➤ Risk zone: Invalidation if there is a decisive break <102,000 $ or major red volume climax on failed resistance retest.
➤ Key catalysts this week: Fed/FOMC decision, major geopolitical events.
➤ Plan: Favour methodical accumulation pre-Fed, reinforce/swing post-announcement according to technical resolution.
__________________________________________________________________________________
Multi-Timeframe Analysis
1D : Trading below broad 105,800–111,000 $ resistance, Risk On / Risk Off Indicator strongly positive, normal volumes, no euphoria (ISPD DIV neutral). Healthy structure, upward bias confirmed.
12H/6H : Consolidation at major support; recent rebounds from 102–104k, no exhaustion signals. MTFTI Up but 2H-1H corrective divergence.
4H/2H : Range market, major supports defended, no breakout yet. MTFTI locally Down, indicating mild internal corrective dynamic.
1H/30min/15min : Intraday range, technical micro-bounces, weak directional bias, moderate volumes, no abnormal behavior. Scalping preferred below resistance, rigorous risk management.
Risk On / Risk Off Indicator : Strong aligned buy signal across all TFs, sector environment supportive.
__________________________________________________________________________________
Multi-Timeframe Key Points Summary
Strong bullish market, behavioral and technical stability.
Breakout >106,100 $ = legitimate bullish extension, 110k+ target.
Invalidation below 102k $: go to cash, wait for stabilization.
Volatility expected around (Fed/geopolitical) events: adjust sizing/stops accordingly.
__________________________________________________________________________________
Fundamental, Macro & On-Chain Analysis
Fed (FOMC June 17–18): Major breakout/volatility catalyst.
Geopolitical tensions (Israel/Iran): Risk-off spikes expected, watch liquidity zones.
On-chain: Key support at 100–102k $; no major distribution, long-term holders remain strong, options/futures point to underpriced volatility risk.
Strategy: Prefer gradual accumulation on supports, reduce exposure pre-Fed, confirm new swings post-FOMC.
__________________________________________________________________________________
Action Plan Summary
Accumulate on pullback 104,250–102,600 $, stop below 101,900 $.
Breakout >106,100 $: Target 110k–111k $, partial TP, monitor volume/volatility.
Avoid overtrading pre-FOMC or amid major geopolitical news.
Risk/Reward >2 on pullback – strict management mandatory.
__________________________________________________________________________________
Conclusion & Context Mastery
The market remains structurally bullish and supported by the combination of technical, sector and on-chain factors. However, macro/geopolitical volatility requires increased caution as the FOMC approaches. Focus on support entries, avoid chasing resistance until confirmed, and apply tight stops in this catalyst-rich context.
__________________________________________________________________________________
MARKET TECHNICAL BREAK DOWN FOR 16TH TO 20TH JUNE📊 Market Technical Breakdown – EURUSD, AUDUSD, XAUUSD & BTCUSDT 🔍
Traders,
Get ready for this week’s precision-driven analysis across four major markets:
✅ EURUSD – Is the euro gaining strength or facing more downside?
✅ AUDUSD – Key zones to watch as the Aussie reacts to USD data.
✅ XAUUSD (Gold) – Will gold hold strong or give in to bearish pressure?
✅ BTCUSDT – Bitcoin’s momentum shift: Are bulls still in control?
This breakdown covers:
🔹 Clean chart analysis
🔹 Key levels (support & resistance)
🔹 Trade ideas with potential entries & exits
🔹 My personal trading insight for each pair
🎯 Whether you're a beginner or a seasoned trader, this breakdown will help sharpen your bias and build confidence in your trades.
👉 Watch the video till the end to catch all setups, confirmations, and bonus tips for the week.
Drop a comment if you found it helpful or want to see a pair included in the next breakdown!

My BTC Play With a Macro BoostThis isn't about guessing.
This isn’t hype.
This is what happens when structure, liquidity, and macro fundamentals align.
Let me break it down:
Technical Perspective
BTC just pulled a classic trap.
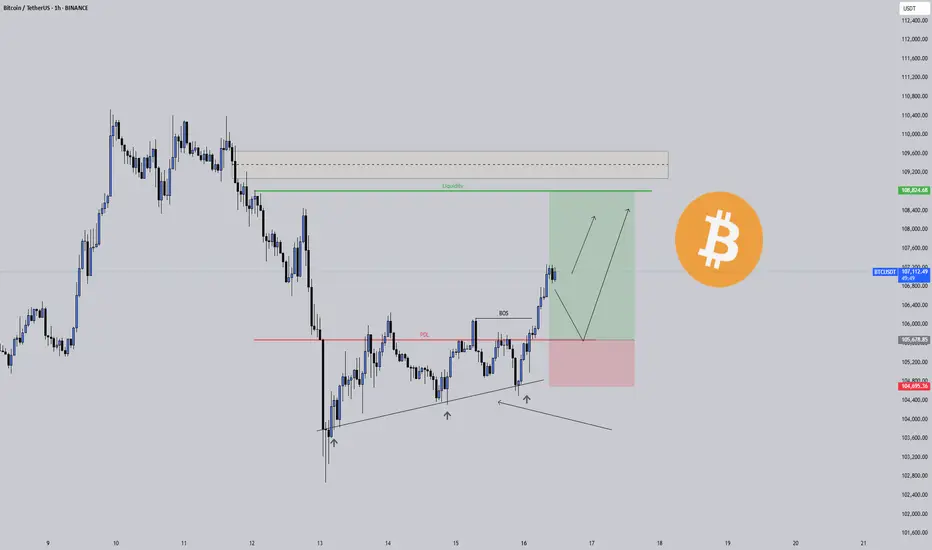
✅ Liquidity Sweep: Price dipped below the 4PDL (Previous Day's Low), sweeping out late longs and triggering emotional shorts.
✅ Break of Structure (BOS): Price broke cleanly broke strucutre, confirming bullish intent.
✅ Fair Value Re-entry Zone: We now have a clean FVG zone if price pulls back.
But that’s not all...
🔼 Retail Pattern Detected :
Look closely, there's a textbook ascending triangle in there. Retail traders often use it to predict bullish breakouts. What they see as a triangle, we see as smart money coiling pressure before the move.
Fundamentals Supporting the Structure
This move isn’t just technical, it’s backed by real market weight:
Public companies are buying Bitcoin by the billions: MicroStrategy, Trump Media, Metaplanet they’re not “speculating,” they’re storing BTC as a treasury asset.
Institutional inflows are accelerating: ETFs, sovereign interest, and large-cap investors are building long positions — and it’s beginning to reflect in the chart.
The U.S. is formalizing a Bitcoin reserve policy.: Call it political, strategic, or monetary — either way, it reinforces that dips like this are being bought by giants.
The candle doesn’t lie but neither does the macro narrative when they both point in the same direction.
Mindset Tip: Ride Logic, Not Emotion
This setup teaches us something important:
You don’t have to catch every move. You just need to understand why it moved — and position accordingly.
If it pulls back, don’t panic. Let the market invite you, not rush you.
BTC accumulates, back to 108,500Plan BTC today: 16 June 2025
Related Information:
The price of gold is nearing its all-time high as tensions in the Middle East escalate, but analysts say they’re doubtful Bitcoin will do the same as investors prioritize other safe-haven assets.
The price of gold rose to $3,450 per ounce on Monday, just $50 shy of its all-time high of just below $3,500 in April, according to TradingView.
The usually slow-to-move asset has gained a whopping 30% since the beginning of the year, catalyzed by US President Donald Trump’s trade tariffs and, more recently, an escalation of military action in the Middle East following an Israeli missile strike on Iran on June 13, which caused Bitcoin prices to fall.
Gold prices have also been linked with inflationary pressures, as it is considered a safe haven and an inflation hedge by investors.
personal opinion:
The crypto market recovered at the beginning of the week after being affected by war news. It will almost certainly continue to maintain the 4.5% interest rate, so it will be difficult to break ATH this week.
Important price zone to consider :
Sell point: zone 108.400 - 108.600 SL : 109.100
Take profit : 107.900 - 107.000 - 106.000
Sustainable trading to beat the market