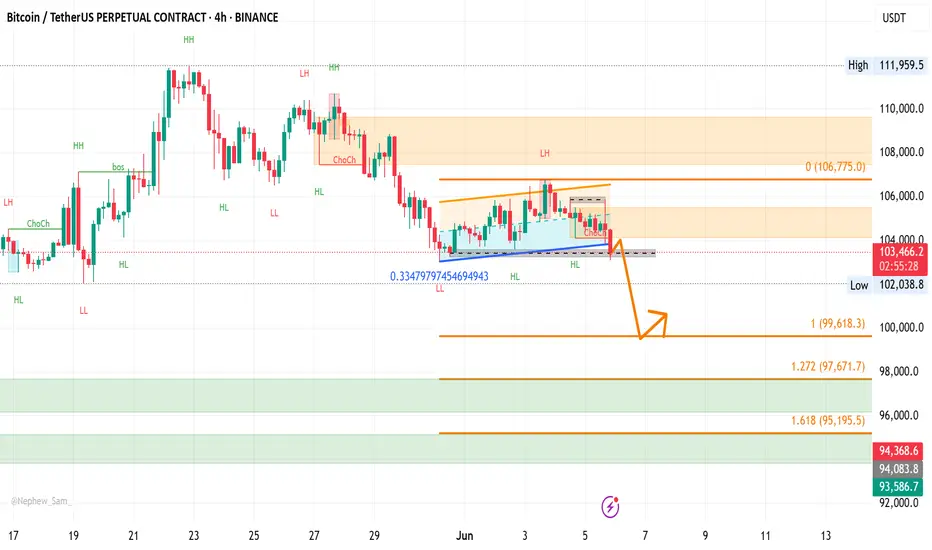
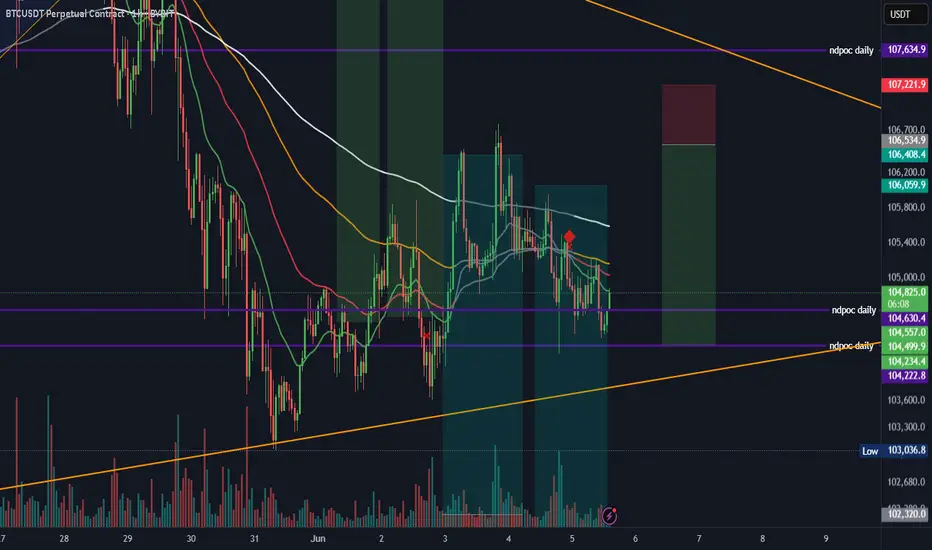
Bitcoin 05/06/2025I can see in this level of price , buy in timeframe h4. Now we are bearish, the next step would be to drop to the H4 candle purchase zones. pay attention with yours buyss.
Bye bye
Lucas Gomez
BTCUSDT.P trade ideas

Why Do Trendlines, Chart Patterns Only Work Probabilistically?Why Do Resistance, Support, Trendlines, Fibonacci, and Chart Patterns Only Work Probabilistically?
(Meaning they are sometimes accurate, sometimes not)
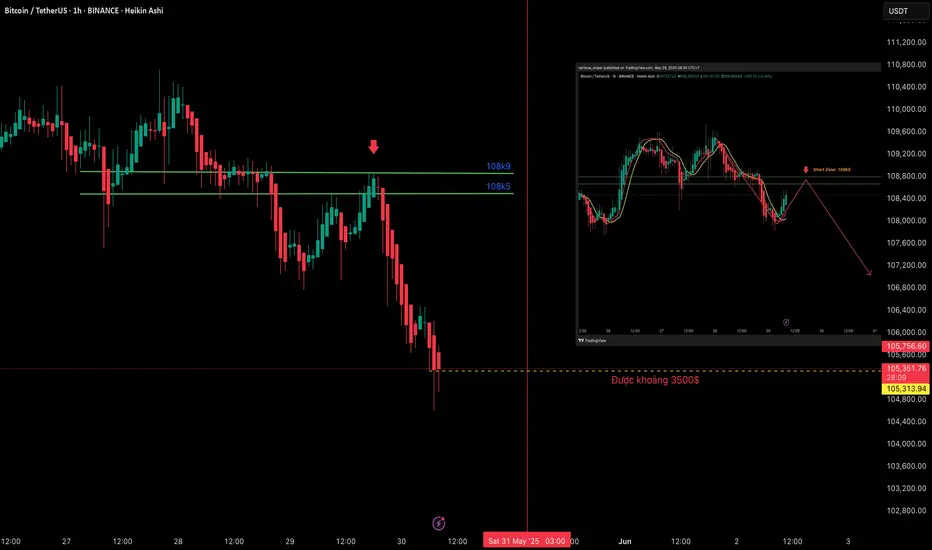
In an uptrend, we follow the strategy of "buying at the bottom, selling at the top." But in a downtrend, what strategy should guide us? It’s the opposite: "shorting at the top and closing the short at the bottom." The approach is not much different from spot trading. We still use tools to identify tops and bottoms to execute our shorting plan and close positions.
For BTC on the D1 timeframe, the trend remains bearish. According to my system, BTCUSDT formed a peak on D1 on May 27 and May 28, with two "has peak D1" signals. This suggests that if we follow a short strategy, we would take profits at the D1 bottom.
In terms of price, we could wait around the $100k level to observe price action for profit-taking. Alternatively, using a bottom-detection system, we would close the position when a "has bottom" signal appears, regardless of whether the price hits $100k. It depends on the real-time market dynamics at that moment. The price might drop further to $95k or $93k, or it may not even reach $100k. Fixing a specific price level—whether it’s a resistance, support, trendline, or Fibonacci level—may not fully capture the overall real-time market context.
This is why sometimes the price hits the exact fixed zone, but other times it overshoots, undershoots, or a larger timeframe intervenes and breaks these fixed zones. That’s because price zones, trendlines, resistance, support, and Fibonacci levels are based on historical context.
In real-time, we are dealing with the present, which is vastly different from historical context. For example, differences in political leadership, monetary policies, wars, geopolitics, or capital inflows can all create disparities. This is why trendlines, resistance, support, Fibonacci levels, and chart patterns are not always accurate in the present or only work probabilistically.
Stay sharp, brothers!
2 Scenarios for BTCNow that the cup and handle formation has been reached and the correction finished, I think we have 1 more leg up.
It's also possible that we fall from here, but I think another fakeout upwards is likely as bearish divergence forms on the month, but isn't quite there yet (RSI needs 1 more higher high to confirm bearish divergence)
Either way, my short targets are the 0.618 fibs. I am expecting the typical -70-75% crash by 2027 before the next cycle begins

#BTC Double Top Bearish Structure, Beware of Pullback📊#BTC Double Top Bearish Structure, Beware of Pullback📉
🧠From a structural perspective, we broke below the neckline of 106510, which means that the bearish double top pattern is established, so we need to be wary of the coming of a plunge.
➡️As I said in my last analysis, we stabilized and rebounded after testing the support near H1, but I was not satisfied because my order was swept after I moved up the SL, so we cancelled the risk and also meant that we might cancel the possible future profits.
➡️However, I still succeeded because I stuck to my trading plan and tried some short trades after the price rebounded near the blue resistance line. 50% of the profit has been locked in because I am worried that the market will jump back and forth between support and resistance, and there is a gap to be filled near 109200.
⚠️If we fail to hold the support near 106500 tomorrow, then we will see a plunge.
Let's see👀
🤜If you like my analysis, please like💖 and share💬 BITGET:BTCUSDT.P

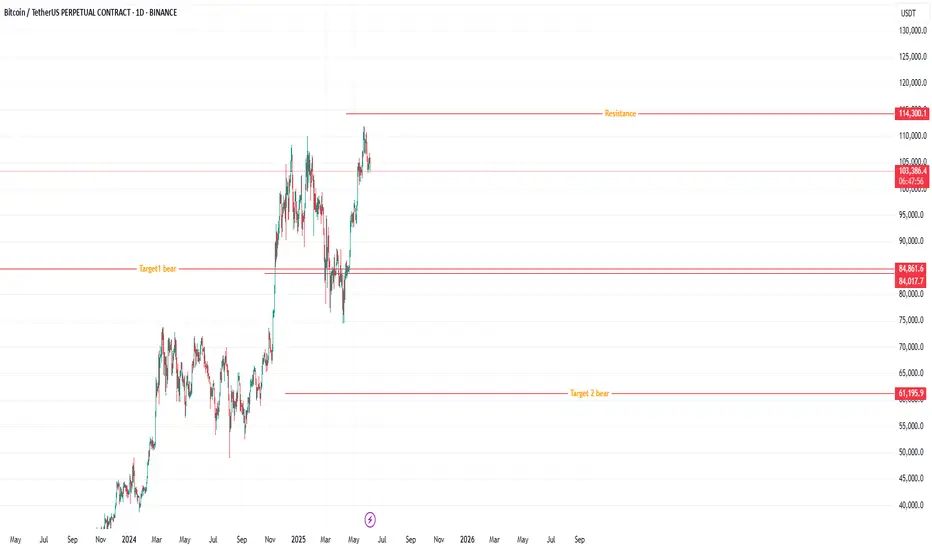
BTC next bull runBTC is expected to undergo a short-term retracement before reigniting its bullish momentum and advancing toward new highs
Bitcoin Wave Analysis – 5 June 2025
- Bitcoin broke support zone
- Likely to fall to support level 98,000.00
Bitcoin cryptocurrency recently broke the support zone located between the key support level 102150.00 (which reversed the price multiple times from the start of May) and the 50% Fibonacci correction of the upward impulse from last month.
The breakout of this support zone accelerated the active short-term ABC correction 2, which started earlier from the major multi-month resistance level 110,000.00.
Bitcoin cryptocurrency can be expected to fall to the next support level 98,000.00 (former strong resistance from February).

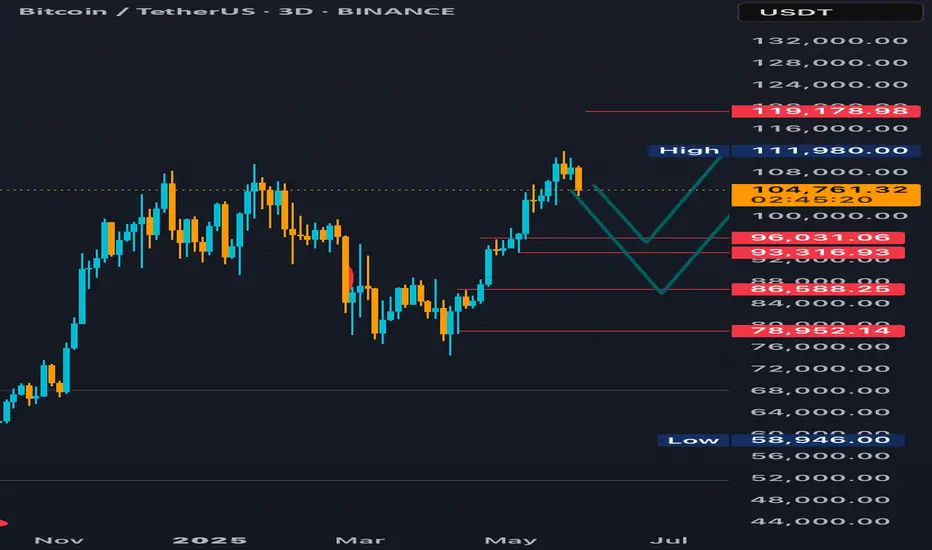
Bitcoin - Bearish double top or bullish cup and handle ?As CRYPTOCAP:BTC reached a new high, we got a clear double top setup unfolding.
The question is now how this will unfold ? Honest answer : We can't know as price can unfold in many different patterns from here.
For now , we have to respect the bearish double top setup and therefore remain bearish on this as long as price is below 109.600$ .
BUT seen the somewhat good general market context for now and the potential for a surge in bitcoin demand, we have to be open to the possibility to turn bullish here when possible.
A double top setup can easily turn into a cup and handle setup, that means we could see price consolidate some more before rising again. But for that to happen, we need price to hold some key support levels , which for now is the 20day EMA in green on my chart. IF the 20dEMA is broken, we can simply look for the 50dEMA in black as the next potential support zone.
Also, from an Elliott Wave perspective, it's quite simple, if price move above the 78.6% Fibonacci retracement level, although not always, more often than not we see price go up to the 127.2% and 138.2% levels around 120K here.
So, what can we do from here ?
For the bulls ? Simple, stay out and only look for setups on key support as mentioned above, for now you can use the 20dEMA for a small long entry with a very tight stop.
For bears ? Respect the short side as long as possible and use the support zones for profit taking and if support breaks look for new entries or to add to your positions if you want to be more aggressive.

Bitcoin is looking great so far!Once the potential Wave 2 correction is over, we can enter a potential Wave 3 on the daily timeframe, reaching at least 140k before the next "major" correction.

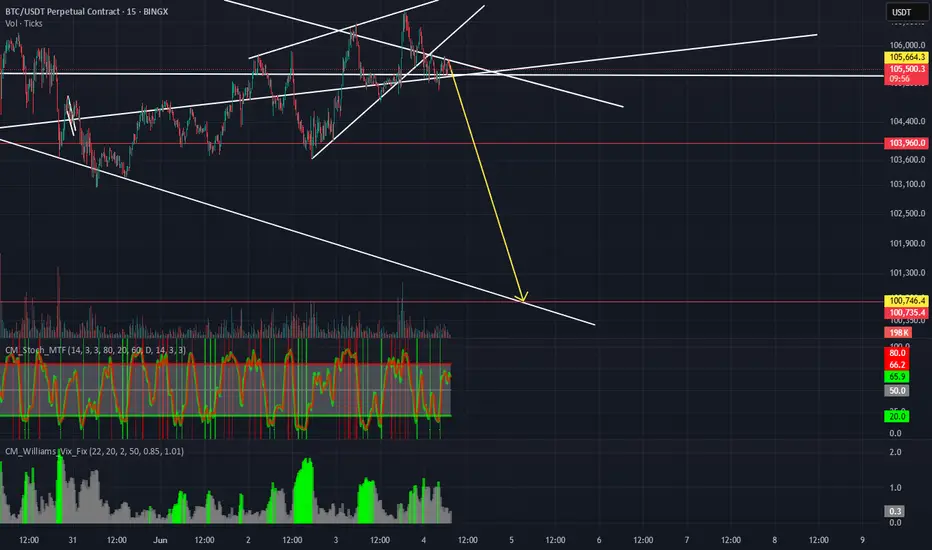
BTC bearish ideaBitcoin has been moving inside a downward channel and despite multiple attempts to break above, it still remained inside this channel, I believe this trend continues.
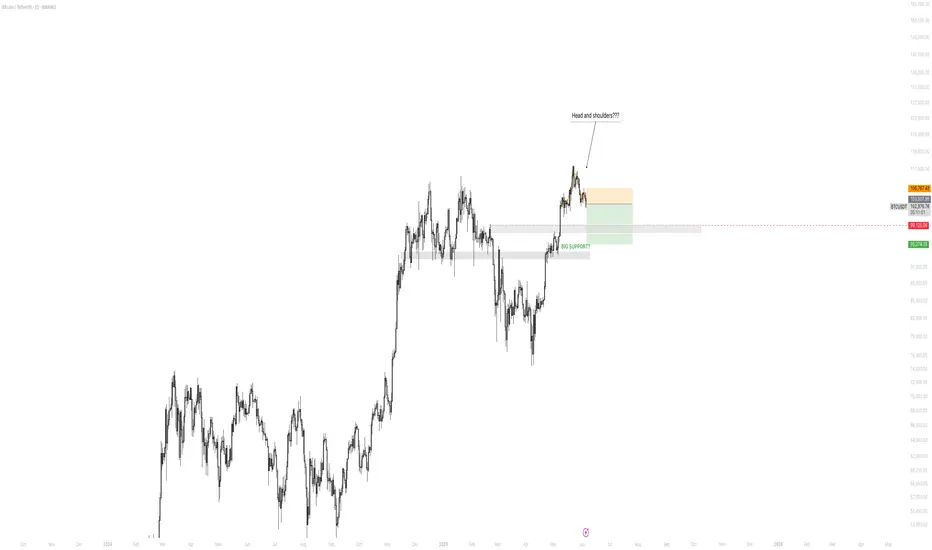
BTC PATo me it seems that the BTC chart is printing a traditional head and shoulders pattern, which would indicate probable lows at least in the short term.
Btc 99,999 Waiting/looking for a correction in june after a breakout, 99,7 or it could get nasty. Will watch for a break back above 99,7 to target 112k
Elliot Waves on the daily timeframeWave 5 should wrap up by tomorrow, and BTC should be set to hit new highs.

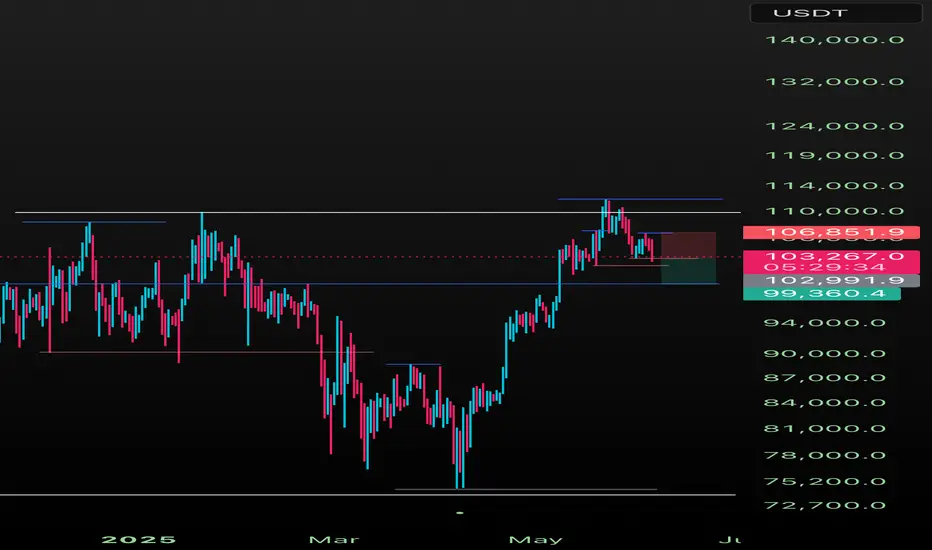
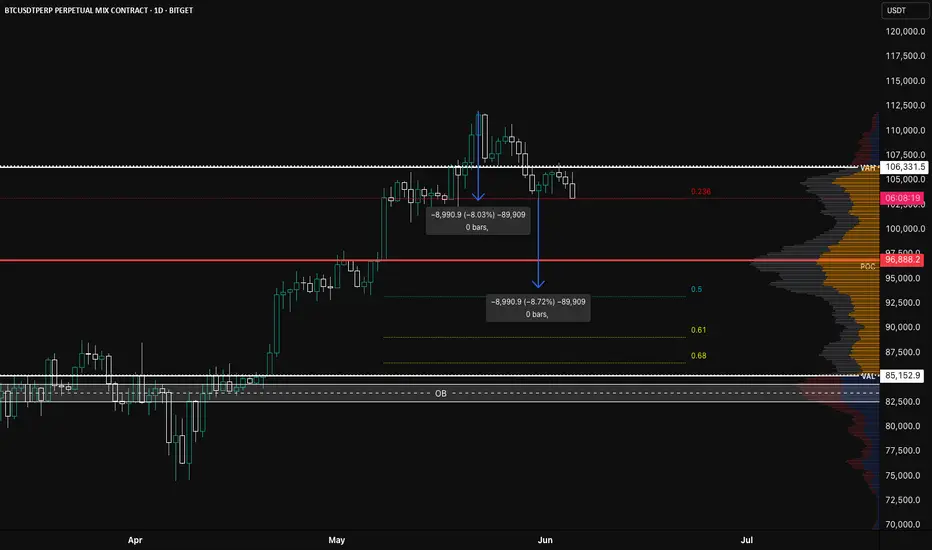
BTC/USDT.P Rejection Confirmed? Eyeing Breakdown Toward 50% FibBitcoin just lost two critical levels in rapid succession:
1️⃣ Value Area High ($106,331)
2️⃣ Previous Monthly High ($105,000)
We’re now closing candles back inside prior structure, showing signs of weakness and potential distribution at the highs.
📉 The Bearish Setup
Price is hovering above the 0.236 retracement. A break and daily close below this level could complete what looks to be the right shoulder of a developing head and shoulders pattern. The distance from head to neckline lines up with a projected move down toward the 50% Fibonacci level ($91,500) — which also aligns closely with the POC ($96,888) as an intermediate stop.
🎯 Targets:
• Neckline/Break Level: $102,800
• Mid-Target (POC): $96,888
• Main Target (0.5 Fib): $91,500
• Confluence zone lower: 0.618 to 0.68 (watch for reversals)
🧠 Context Notes:
• The current 2-leg rejection (~8% each) gives symmetry to the pattern
• High volume nodes around POC could act as reaction areas
• This short setup remains valid while price is closing below ~105k and failing to reclaim VAH
If this structure plays out, it’s a classic example of a failed breakout turning into a strong breakdown — the kind of move that catches late bulls off guard.
Btc daily chartBtc daily chart, key levels.
For a bullish scenario price needs to hold resistance as support
BTCUSD Analysis – Bearish Elliott Wave Structure UnfoldingAfter BTC recently made a high around 111,959, we observed a clear impulsive bearish move followed by minor pullbacks.
The current market price stands at 103,396, and based on the structure, it appears that BTC is unfolding a bearish Elliott Wave pattern. If this holds, we could be in the midst of Wave 3, which typically shows strong momentum and continuation.
Key downside levels to watch:
99,620
97,670 – This level also aligns with a bullish breaker on the 4H chart, making it a potential area of interest for buyers.
Strategy:
My current approach is to sell on pullback, targeting the formation of lower highs and aiming for a break below the recent lower lows.
Bitcoin (BTC/USDT) Technical Analysis Bitcoin (BTC/USDT) Technical Analysis | Pressure Builds Below Trendline
As outlined in the previous analysis, BTC dropped sharply after rejecting both a key horizontal resistance and the descending trendline (green). The price has now reached the orange support zone, and volatility is picking up.
🔻 Bearish Scenario: Breakdown Potential
As long as Bitcoin remains below the descending green trendline, the bearish bias stays intact. If the orange support breaks to the downside, watch for the next key levels:
$103,879 – short-term support
$103,286 – deeper support with price reaction potential
$102,600 – major demand zone
This could open the door to a broader correction.
🟢 Bullish Scenario: Breakout Attempts
On the flip side, if BTC breaks above the pink resistance zone, a short-term recovery may begin. Key upside levels to watch include:
The green descending trendline
$105,305 and $105,650 – important resistance clusters
A confirmed breakout could shift momentum back to the bulls.
📌 Summary
BTC is at a critical crossroad. A breakout or breakdown from current levels could define the next leg.
📊 Wait for candle confirmation and volume reaction before entering.
💥 If you found this breakdown helpful, smash that follow button for clean, real-time setups — no noise, just sharp trades.
📈 Let’s grow your trading game together!

BTC looking brittleBTC 1 hour chart just passed DOWN 50 and 200 SMAs. Probably nothing, or maybe something bigger is brewing given that it's a speculative asset with massive volatility.

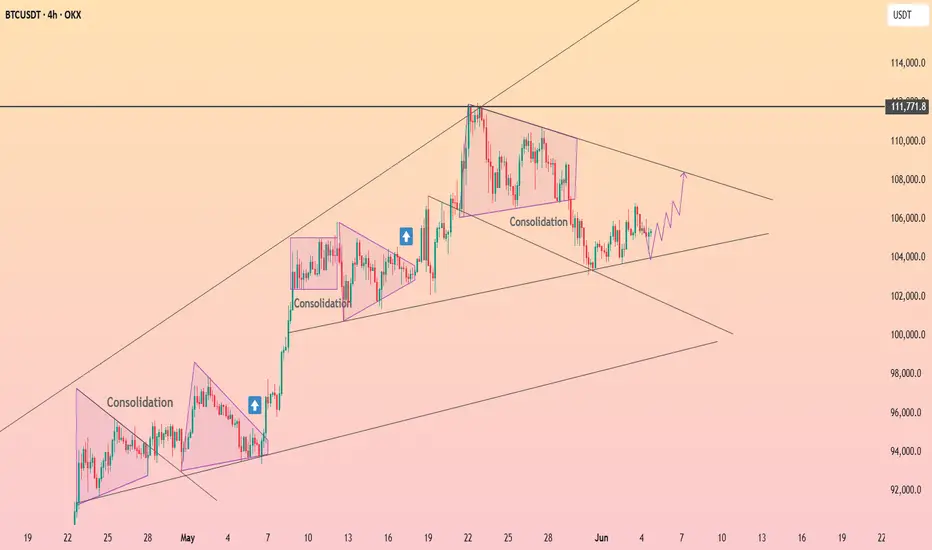
HolderStat┆BTCUSD pennant pauseCRYPTOCAP:BTC cools under 106 k inside a narrowing pennant pinned to its long-term rising rail. Successive ascending consolidation triangles hint at continuation, projecting a thrust toward the 111 k resistance shelf. Holding the pattern’s base keeps breakout odds tilted north.
BTC/USDT Analysis – Continued Rotation
Hello everyone! This is a daily market analysis from a CryptoRobotics trader-analyst.
Yesterday, after testing the local resistance at $105,400, Bitcoin shifted to a downward movement — but not for long. Selling pressure was very weak, and the initiative was quickly taken over by buyers. However, after a second test of that same level, selling resumed again, indicating that sellers currently hold the upper hand.
Main expectation: a test of the local low at $103,000, from where a return into the sideways range and a potential retest of the upper sell zone is likely.
Sell Zone:
$107,000–$109,800 (accumulated volume)
Buy Zones:
Around $100,000 (aggressive buying volumes)
$98,000–$97,200 (local support)
$93,000 level
$91,500–$90,000 (strong buying imbalance)
This publication is not financial advice.

BTC SHORT BTC SHORT
ENTRY : 106534.9
PROFIT : 104234.4
STOP : 107221.9
ALL trading ideas have entry point + stop loss + take profit + Risk level.
hello Traders, here is the full analysis for this pair, let me know in the comment section below if you have any questions, the entry will be taken only if all rules of the strategies will be satisfied. I suggest you keep this pair on your watchlist and see if the rules of your strategy are satisfied. Please also refer to the Important Risk Notice linked below.
Disclaimer
BTC:Trendline Test in Play Wait for Breakdown Before Shorting📉 Bitcoin 4H Chart: Trendline Test in Play — Wait for Breakdown Before Shorting
On the 4-hour timeframe, Bitcoin is currently testing a key orange trendline, which has so far acted as a bullish continuation support. Every time the price has touched this trendline, it has bounced back up — making it critical to wait for confirmation before opening any short positions.
---
🔻 Short Setup:
⛔ Don’t short early. Wait for the trendline to be clearly broken
📍 Entry Trigger: Short below $103,822.8 after trendline breakdown
📌 This level acts as a technical trigger confirming bearish continuation
---
🟢 Long Setup Remains Valid:
📍 Entry Trigger: Break and close above $106,491
---
🧠 Why Patience Matters:
The orange trendline is a continuation trendline, and historically, BTC has bounced upward each time it's tested. Premature shorts may result in being caught in a reversal. Wait for a confirmed close below the trendline + $103,822.8 before entering.

This head and shoulder structure may push price to 95kThis head and shoulder pattern may push price to 95k. At 95k we have weekly moving average bands and they will act as support. But as recent history suggest it will be a very choppy downward move.

BTC LONG $105800BTC Long Setup 🚀
Ideal entry at key support zone.
Tight SL to manage risk.
TP set for a strong risk/reward ratio (1:2).
Institutional volume and whale activity confirming the move.
Let’s ride this uptrend! 🔥
