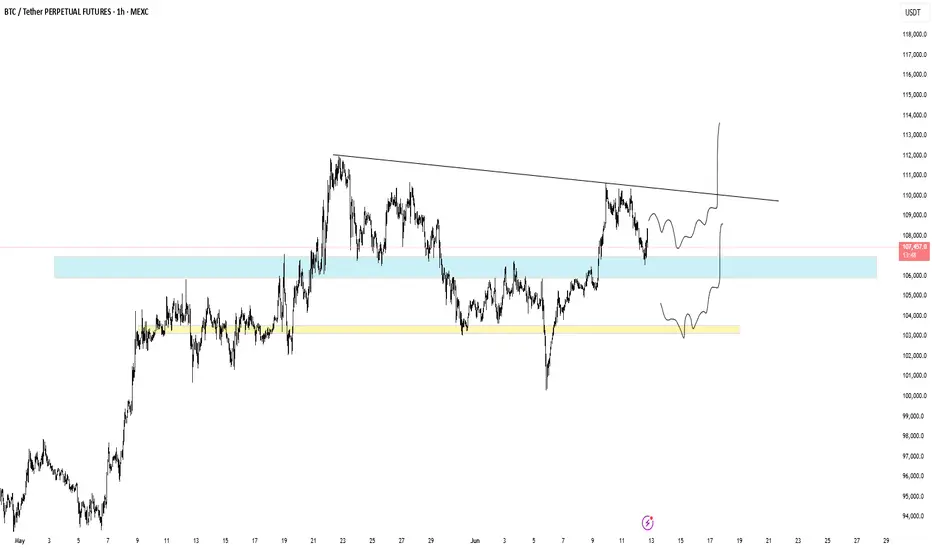
#BTCUSDTbearish side of the btc is slow, as the volume of sell is not that high...…any strategy doesn't fit the lower low, i am seeing btc to the 132k.
anyone overthere with a new different strategy regarding btc?
BTCUSDT.P trade ideas
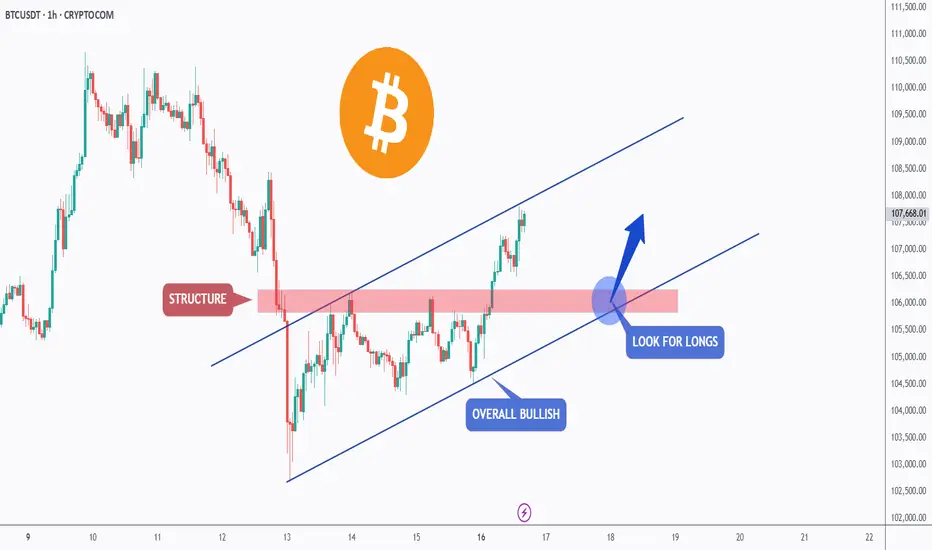
BTC is Bullish!Hello TradingView Family / Fellow Traders. This is Richard, also known as theSignalyst.
📈BTC has been overall bullish trading within the rising channel marked in blue.
Moreover, the red zone is a strong structure!
🏹 Thus, the highlighted blue circle is a strong area to look for buy setups as it is the intersection of structure and lower blue trendline acting as a non-horizontal support.
📚 As per my trading style:
As #BTC approaches the blue circle zone, I will be looking for bullish reversal setups (like a double bottom pattern, trendline break , and so on...)
📚 Always follow your trading plan regarding entry, risk management, and trade management.
Good luck!
All Strategies Are Good; If Managed Properly!
~Rich
bitcoin btc shortshort entry :107.300 , STOP LOSS: 108.400 , PROFIT TARGET 101.000
RR 1:5 BINANCE:BTCUSDT.P
Bitcoin Showing Bullish Intentions as Selling Pressure Weakens📈 Bitcoin Showing Bullish Intentions as Selling Pressure Weakens
In the last three 4H candles, we’ve seen a decline in volume alongside smaller candle bodies, even as the price has moved slightly lower. This typically signals weakening selling pressure and increasing bullish interest.
As long as price doesn't print a lower low below $105,500 and fails to break above $110,246, Bitcoin is likely building structure for a potential bullish breakout. If the current level holds and BTC begins to rally from here, the new higher low would likely be around $107,000 — reinforcing the bullish trend structure.
🧠 Key Insight: Wait for a clear long trigger before entering; the market is currently in a cool-off phase, not a reversal.

Bitcoin sell short go 50k Bitcoin is ready to correct towards $56,000 after the double-top pattern on the weekly time frame.
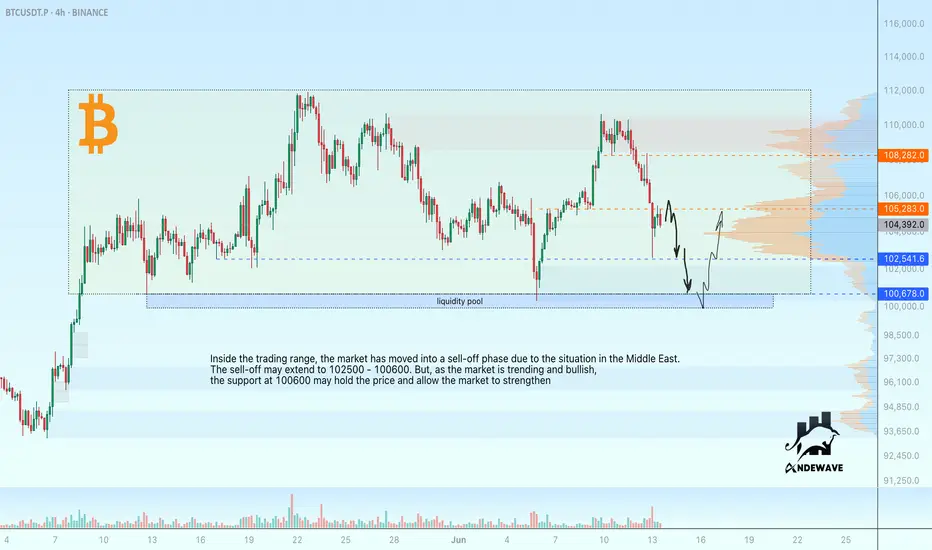
BTC gathers liquidity ahead of growth Inside the trading range Bitcoin has moved into a sell-off phase due to the situation in the Middle East. The sell-off could extend to 102500 - 100600. But as the market is trending and bullish, the support at 100600 may hold the price and allow the market to strengthen
Scenario: A false break of the resistance at 105280 is formed. Accordingly, I am initially waiting for a decline to 102500. If 102500 fails to hold the move, bitcoin could then head to the liquidity pool. A false break of 100600 may give a chance for a rise to 105200 - 108200.
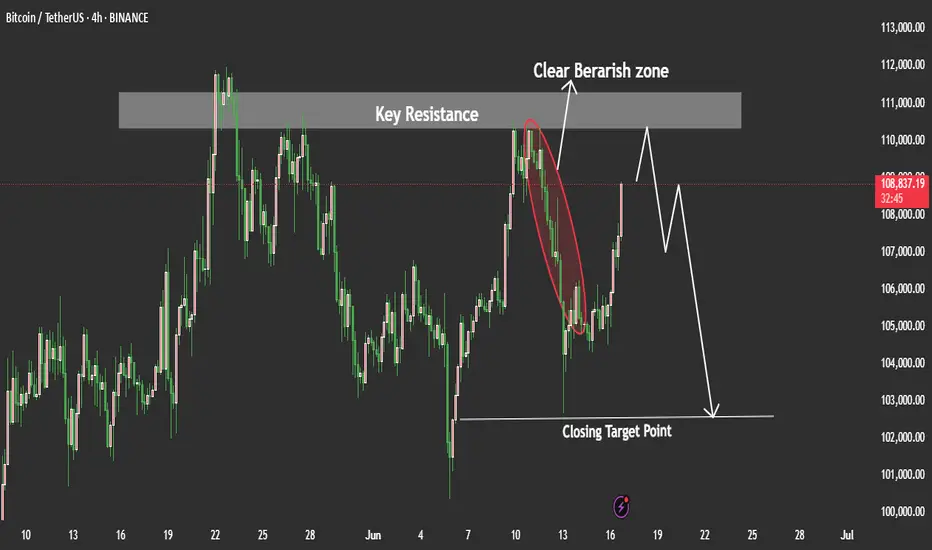
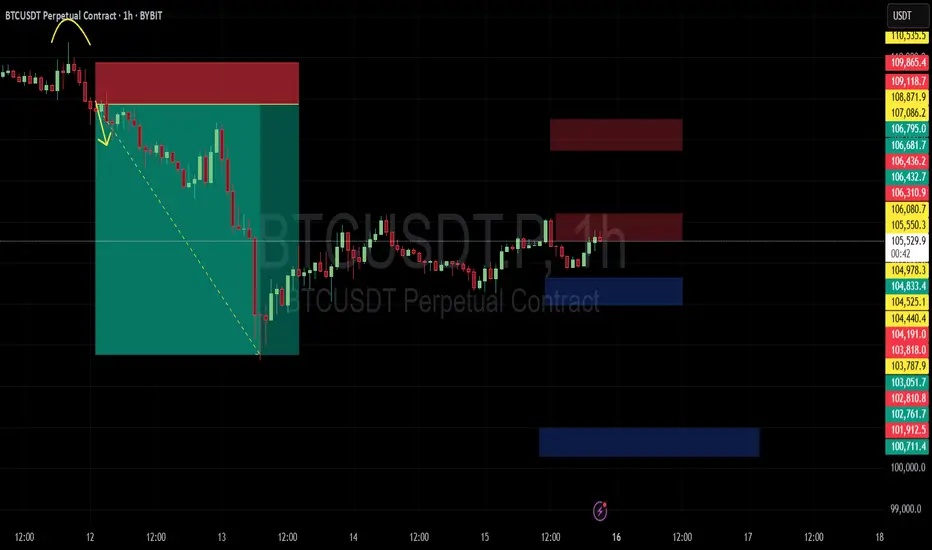
Bitcoin– bearish momentum builds after rejection at $109KIntroduction
Bitcoin (BTC) is currently showing weakness after forming a lower high at $109,000. This level acted as a significant point of rejection, and since then, BTC has been moving lower. The price has broken through key support areas, indicating a possible shift in market structure. In this analysis, we’ll break down the recent price action, explain the technical signals behind the move, and discuss what could be expected in the short term.
Rejection from the 0.786 Fibonacci Level
The rejection at the $109,000 level aligns perfectly with the 0.786 Fibonacci retracement on the 4-hour timeframe. This level is often seen as a strong resistance point during corrective moves, and in this case, it held firmly. The precision of this rejection gives it more weight, and since hitting that point, BTC has been steadily declining. This move down suggests that buyers were unable to push through the resistance, leading to increased selling pressure.
Break of the 4H Bullish FVG
As BTC started its decline from $109,000, it broke through the bullish Fair Value Gap (FVG) that had formed earlier on the 4-hour chart. This gap previously served as a support zone but has now been decisively broken with strong volume. The loss of this level is significant, as it marks a breakdown of the bullish structure and opens the door for further downside movement. In the process of this move lower, BTC has created a new bearish FVG on the 4-hour timeframe. This gap remains open and could potentially act as a magnet for price to revisit, offering a possible short entry if price retraces into that zone. However, the clear break below the previous bullish FVG indicates a shift in momentum and supports a more bearish bias for now.
Downside Target at $102.7K
Given the recent breakdown, the next key level to watch is around $102,700. This area marks the wick low on the 4-hour timeframe and stands out due to the size and sharpness of the wick. Such large wicks often leave behind unfilled orders, which markets tend to revisit over time. The presence of these resting orders makes this level a likely target for the ongoing move down. It also acts as a strong area of potential support, where buyers might step back in if the price reaches that point.
Conclusion
With the rejection from the 0.786 Fibonacci level and the failure to hold the bullish 4H FVG, BTC has shown clear signs of weakness. The breakdown in structure suggests a continuation to the downside is likely, with $102.7k being the most immediate target. This level could serve as a strong support zone due to the unfilled orders left behind by the previous wick. Until BTC reclaims key support levels or shows a shift in momentum, the bias remains bearish in the short term, and traders should remain cautious while expecting further downside.
Thanks for your support.
- Make sure to follow me so you don't miss out on the next analysis!
- Drop a like and leave a comment!

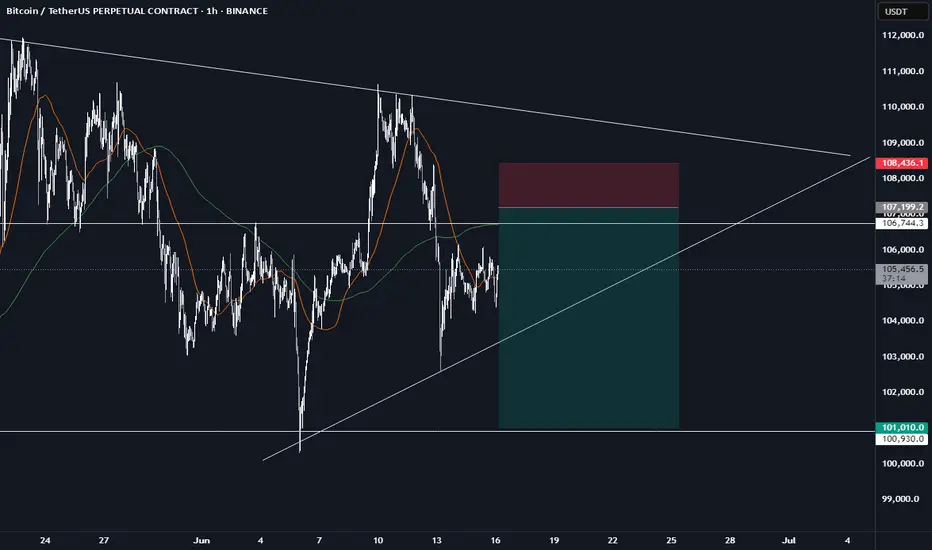
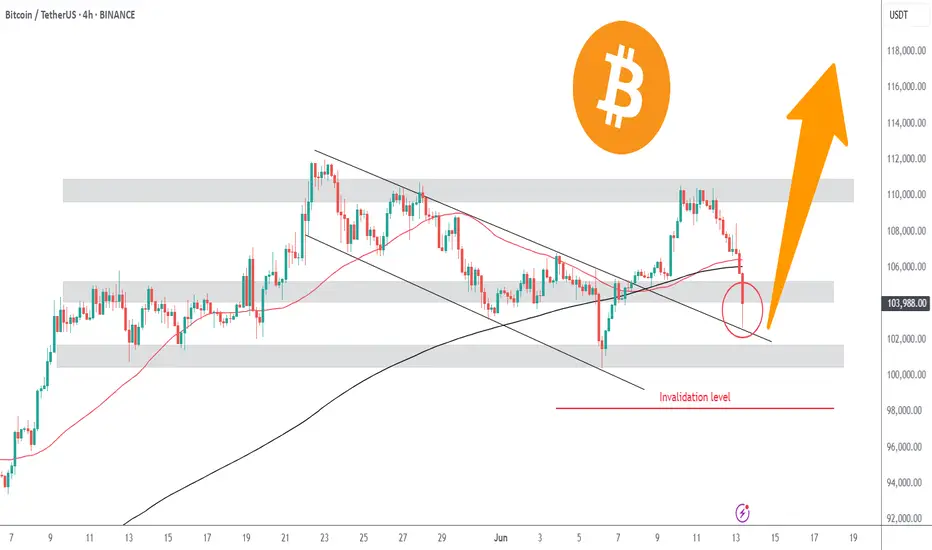
Bitcoin Retests Broken Channel | Bounce to $110k?Bitcoin is currently retesting the broken downward channel. This selloff was a market shock reaction due to Israel's airstrikes on Iran. Price found support around $103k, at the daily timeframe 50SMA. The daily 50SMA also served as support in the previous drop to $100k last week.
In the chart's red circle is likely where many long leveraged positions had their stop losses or liquidation levels. We can safely assume this event was a liquidity hunt as Bitcoin remains strong above $100k. A healthy pullback to retest.
Historically, we have seen similar market shock selloffs like this. One example is the 1st of October 2024 Iran strikes on Israel. Bitcoin crashed 5% from $63k to $60k. What followed after was a recovery to over $100k, never seeing $60k again.
Will Bitcoin recover?
We still have multiple bullish developments. Institutions are becoming increasingly interested in Bitcoin, the US Bitcoin reserve, SEC x Ripple case settlement, SOL ETF approval, Fed rate cuts, among others.
Provided that the conflict does not escalate, once the market panic reaction is over, we can expect a healthy bullish continuation, as long as Bitcoin remains above $100k.
We also have a massive pool of short liquidity above $111k. Once we break above this level it will be a short-squeeze to $120k.
Sidelined Due to Geopolitical Tensions in the Middle East🛑 Sidelined Due to Geopolitical Tensions in the Middle East
Due to the rising geopolitical tensions and the ongoing conflict in the Middle East, I’ve decided to stay out of the market for now. War-related news often triggers short-term volatility, driven more by fear and uncertainty than technical or fundamental analysis. I prefer to wait until the market stabilizes and the emotional reactions fade, allowing for more reliable trade setups.
BTCUSDT: Sharing of the Latest Trading StrategyAll the trading signals today have resulted in profits!!! Check it!!!👉👉👉
Fundamental Analysis:
The Federal Reserve's potential rate cut is expected to increase market liquidity, driving up prices of risk assets like Bitcoin.
Positive developments in China-U.S. trade talks have boosted market risk appetite, benefiting Bitcoin's price.
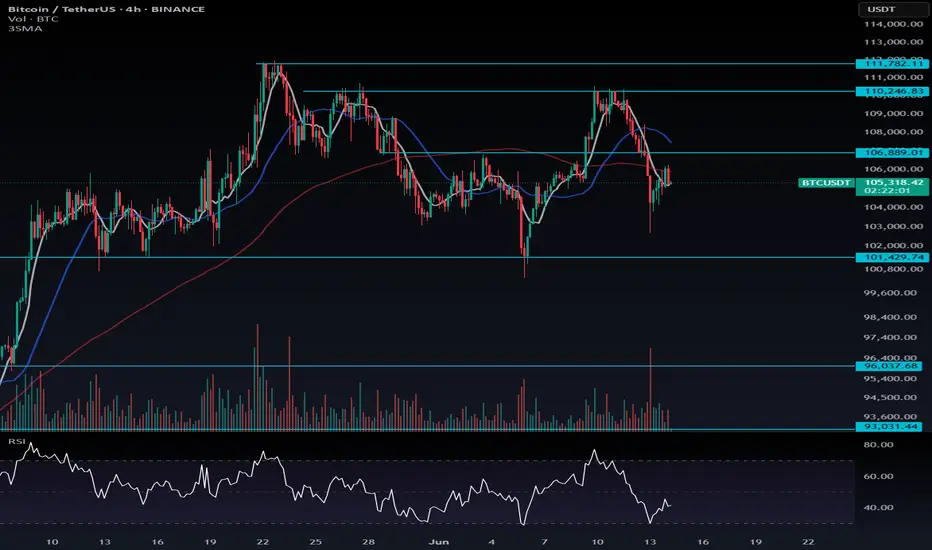
Technical Analysis:
Bitcoin rebounded strongly from the June 5 low of $100,377, with the RSI quickly recovering from oversold territory to around 55, indicating robust rebound momentum.
The lower Bollinger Band near $101,000 provided strong support, and price has now returned above the middle band.
Overhead resistance: $107,000 and $108,000
Support levels: $103,000, $101,500, and $100,000
Trading Recommendation for Aggressive Traders
Consider initiating light long positions if price pulls back to the $103,000–$103,500 zone.
Trading Strategy:
buy@ 103000–103500
TP:106000-108000
Share accurate trading signals daily—transform your life starting now!
👇 👇 👇 Obtain signals👉👉👉

BTCUSDT Price may Test as Short TermBTC/USDT Price Analysis (Interpretation):
BTC/USDT recently tapped into a well-defined rejection zone on the 4H and Daily timeframes. This zone has previously acted as strong resistance.
Given this, we could expect a potential move to the downside unless the price breaks above that rejection zone with strong momentum. However, before the downside move fully plays out, there is a chance the price may retest the 102,500 level again — possibly as a liquidity grab or a false breakout — before resuming a bearish push. My Goal is 102,500 lets we see how how the price will plays out.
if you like tis idea and if you find good thing in this analysis share in comments we need support from you Guys.
Next Volatility Period: Around June 22
Hello, traders.
If you "Follow", you can always get new information quickly.
Have a nice day today.
-------------------------------------
(BTCUSDT 1M chart)
The morning star candle that we often heard about when studying candles appeared.
However, since the candle has not closed yet, the shape of the candle may change.
In stock charts, there were cases where the movement could be predicted with the shape of these candles, but in the coin market, it is impossible to predict.
The reason is that trading is possible 24 hours a day.
Most candle shapes occur with gaps, allowing for a comprehensive interpretation, but in the coin market, gaps are not likely to occur, so I think there is nothing that can be known from the shape of the candles.
Therefore, it is recommended not to try to analyze the chart with the actual shape or pattern of the candles.
However, you need to study to be able to read the arrangement of the candles in order to set support and resistance points.
Even this is not difficult to indicate support and resistance points because there are indicators that indicate support and resistance points.
-
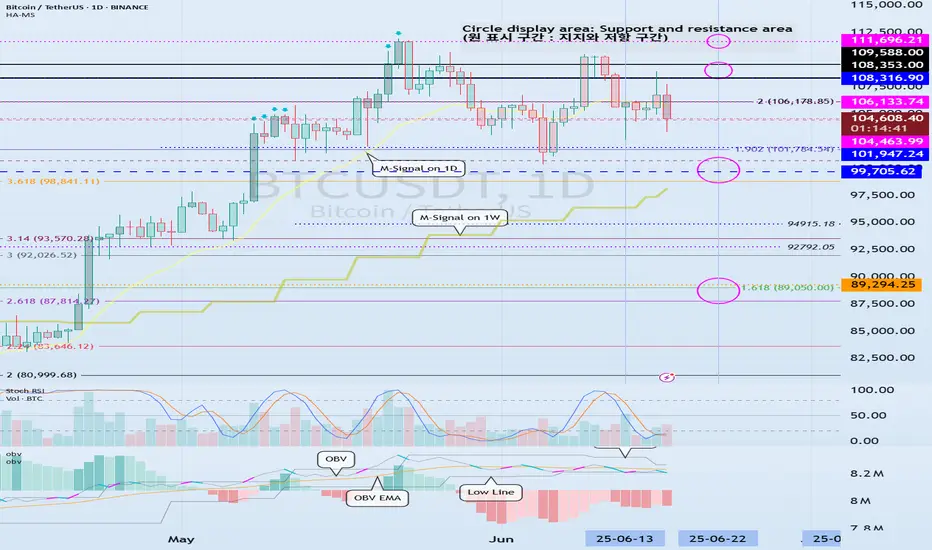
(1W chart)
The 104463.99 point is the DOM (60) indicator point, which corresponds to the end of the high point.
Also, the 99705.62 point is the HA-High indicator point, which corresponds to the middle of the high points.
Therefore, the 99705.62-104463.99 section can be interpreted as the high point boundary section.
The actual trend is likely to occur while falling from 99705.62.
The importance of the 99705.62 point is increasing because the M-Signal indicator on the 1W chart is rising near the HA-High indicator point.
If it falls below the M-Signal indicator on the 1W chart, it is possible that the trend will be determined again when it meets the M-Signal indicator on the 1M chart.
Also, if it falls from the HA-High indicator, it can meet the HA-Low indicator.
Therefore, if the price starts to fall, you should check whether the HA-Low indicator is generated.
The fact that the HA-Low indicator was created means that it rose from the low range.
That is, just as the HA-High indicator corresponds to the midpoint of the highs, the HA-Low indicator corresponds to the midpoint of the lows.
The end point of the lows corresponds to the DOM(-60) indicator point.
-
(1D chart)
For this reason, it is important to see support around 104463.99-106133.74.
The trend is likely to appear after the next volatility period, around June 22nd (June 21st-23rd).
Therefore, we should consider the 104463.99-106133.74 range as the middle range,
- and see if it falls below 99705.62,
- or rises above 108316.90.
Accordingly, we should create a response strategy and be prepared not to panic when a trend appears.
-
The OBV is currently below the Low Line.
Therefore, if it does not receive support at the 104463.99 point, it is likely to fall again.
Since the OBV oscillator is still below the 0 point, we can see that the selling pressure is strong.
However, looking at the overall movement of the oscillator, we can see that the selling pressure is decreasing.
Therefore, if there is another decline, the key issue is whether there is support near 99705.62.
-
In summary, the area around 104463.99 is playing an important role as support and resistance.
Therefore, after the next volatility period, around June 22, we need to check and respond to the direction in which it deviates from the 99705.62-108316.90 range.
-
Thank you for reading to the end.
I hope you have a successful trade.
--------------------------------------------------
- This is an explanation of the big picture.
(3-year bull market, 1-year bear market pattern)
I will explain more details when the bear market starts.
------------------------------------------------------
GME COLLAPSE - NET SELLOFF - MARKET ANALYSISGameStop (GME) is dropping in after-hours trading following its $1.3 billion convertible senior notes offering, which investors see as potential dilution. Similarly, Cloudflare (NET) is also falling due to concerns over its $1.75 billion convertible debt offering, which could impact shareholder value.
On the flip side, Oracle (ORCL) surged after reporting strong Q4 earnings, with cloud infrastructure revenue expected to grow over 70% in fiscal 2026. This could provide a tailwind for the broader cloud sector.
The market’s pullback today was much needed, with many stocks retesting key breakout zones

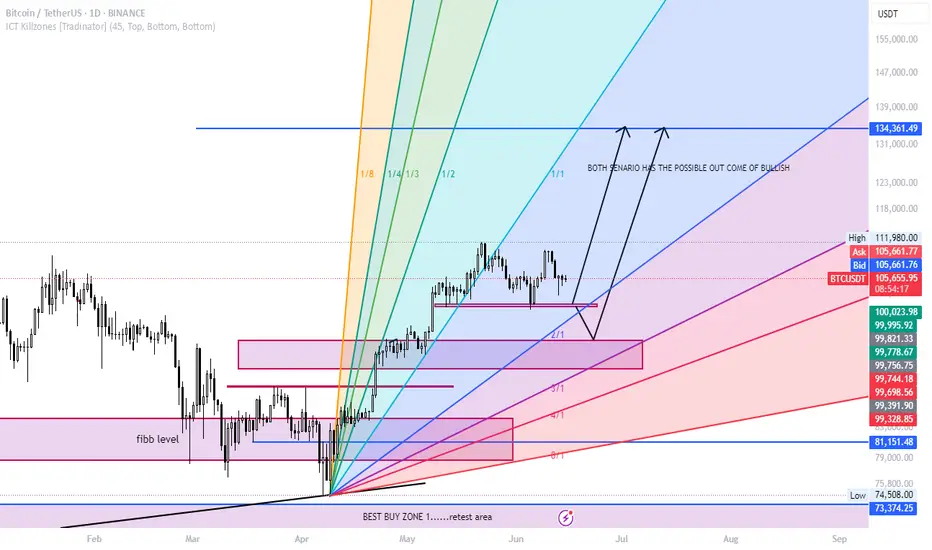
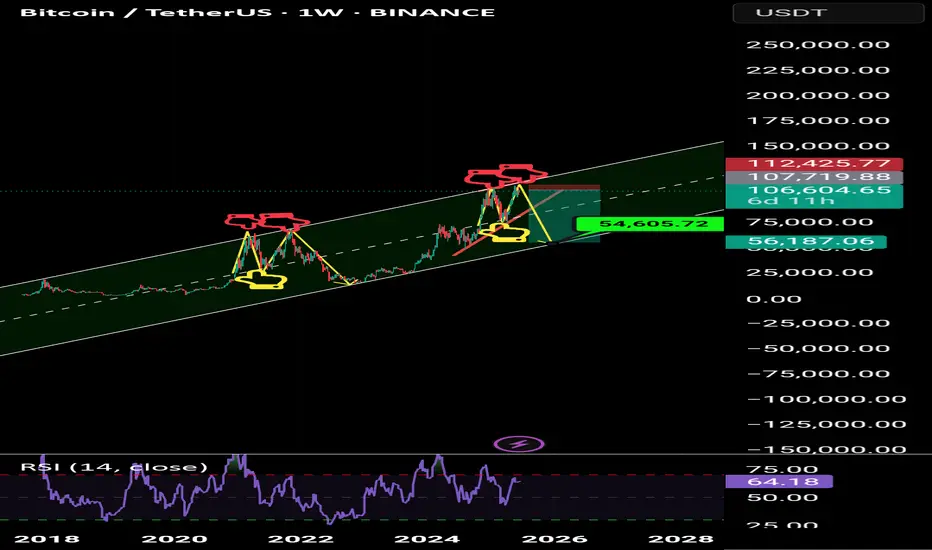
$BTC/USDT MAJOR PUMP? or MAJOR DUMP?BTC, the worlds biggest and fastest growing coin. With a market cap in the Trillions, we are facing a major moment.
Will price dump? or will it pump and go above and beyond.
Lets find out in this analysis!
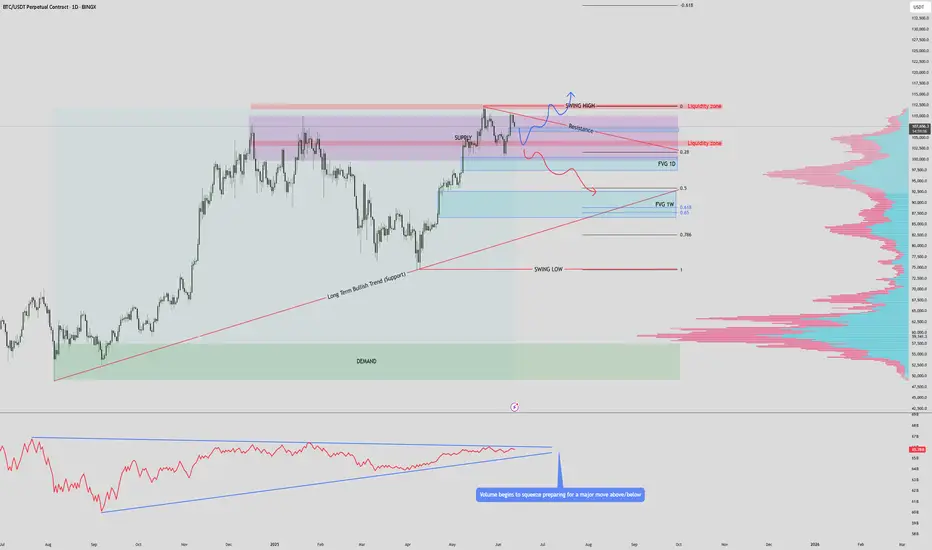
1. Trend Overview
HTF Bullish:
Price remains above the long-term bullish trendline, showing strong macro support.
Recent price action is consolidating within a major supply zone and liquidity cluster — signaling indecision before a breakout or breakdown.
📈 2. OBV (On-Balance Volume) Analysis
OBV is coiling in a symmetrical triangle, indicating a volume squeeze.
This tightening range typically precedes a major breakout or breakdown, matching the price consolidation near resistance.
🔄 Market Structure
Price has formed a potential top just under the supply/liquidity zone (~$110,000–$112,000).
Swing High is defined just below $112K.
Key structure zones are:
Resistance zone at current levels.
Support zones:
1D FVG ($97K) and Weekly FVG ($87K–$93K)
🟪 Supply & Demand Zones
Supply Zone: $100k - $112k — multiple rejections here indicate this is a key short-term ceiling.
Demand Zone: Deep support between $50-$57K, aligns with trendline and historical value area.
🔵 Fair Value Gaps (FVGs)
1D FVG: $97K area — may act as magnet if price breaks below resistance.
1W FVG: $87K–$93K — stronger structural level to watch.
If both are filled, price may meet the bullish trendline around $90K.
🧠 Liquidity Zones
Above current price: ~$112K is marked as a liquidity grab area — stop hunts may occur before major reversal.
Below: FVG zones could trigger a liquidity sweep downwards before reversal.
🔴 Volume Profile
Strong high-volume node (HVN) around $80K–$97K: acceptance zone, likely to act as magnetic support.
Above $110K is a low-volume node (LVN): if broken cleanly, price may accelerate quickly toward $120K+.
✅ Bullish Scenario
Break above $112K → sweep liquidity → continuation toward $120K–$125K. (Price Discovery)
OBV breakout upwards would confirm.
Hold above FVG 1D if retested = healthy bullish continuation structure.
❌ Bearish Scenario
Rejection at supply → drop to FVG 1D ($97K), then potentially Weekly FVG (~$93K).
If OBV breaks downward, it confirms bearish volume divergence.
Breakdown below trendline could target deeper into demand zone (~$70K+).
📌 Summary
Bias: Neutral-bullish short term, bullish macro (above trendline).
Key Breakout Level: $112K.
Critical Support: $91K–$97K (FVG cluster).
Confirmation: OBV breakout + clean structure break.
Invalidation: Weekly close below long-term trendline and FVG zones.
Bitcoin (BTCUSDT) - Price Consolidating Inside Sym. Triangle - DBITCOIN (BTCUSDT) price has recently bounced up from above the 50EMA (yellow line).
Since May 2025, price has been consolidating sideways and has now formed a symmetrical triangle (blue lines). 10% to 20% volatility could be incoming for Bitcoin this summer.
The key resistance prices that Bitcoin has yet to breakout above are: $110000, $112000, $115000, and $120000+.
Support prices are holding at this time, such as $105000, $104000, $102000, and $100000, $95000.
If price holds above $100,000 to $105,000, there is still a chance that Bitcoin can continue to uptrend and rally higher this year in 2025.
However, if $100,000 price and support levels are lost, a new downtrend could occur and price could possibly test the 200EMA zone (red line).

BTC 4HR Fair value gap/golden pocket trade to POCBTC 4HR Fair value gap/golden pocket trade to POC.
2:1 risk reward and maybe let a little bit run in case we go banana bull mode.
BTC channels chart Here I provide you what I believe to be BTC channels down trend channels in terms of being bullish each dotted channel is median and all darken red are tops and bottoms currently we are at median level and as long as we hold this level we can get a bounce to top channel if not then targets of bottom channel it may not be clear the first time but trying channels can provide extra clarity and here’s my chart to witness the BTC breakouts since 2022

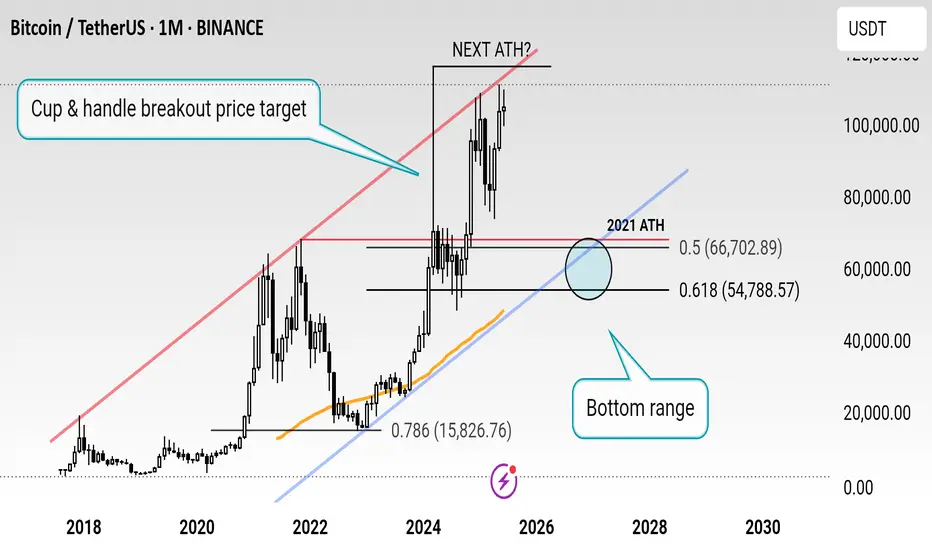
$BTCUSD Predictions support line
Bitcoin traders, get ready for an epic ride! This chart shows BTC still has to hit the price target from the Cup & Handle breakout, pushing it toward a major channel resistance! Once it peaks, a bear market could kick in, driving prices down to the support line. Buckle up for the volatility ahead!
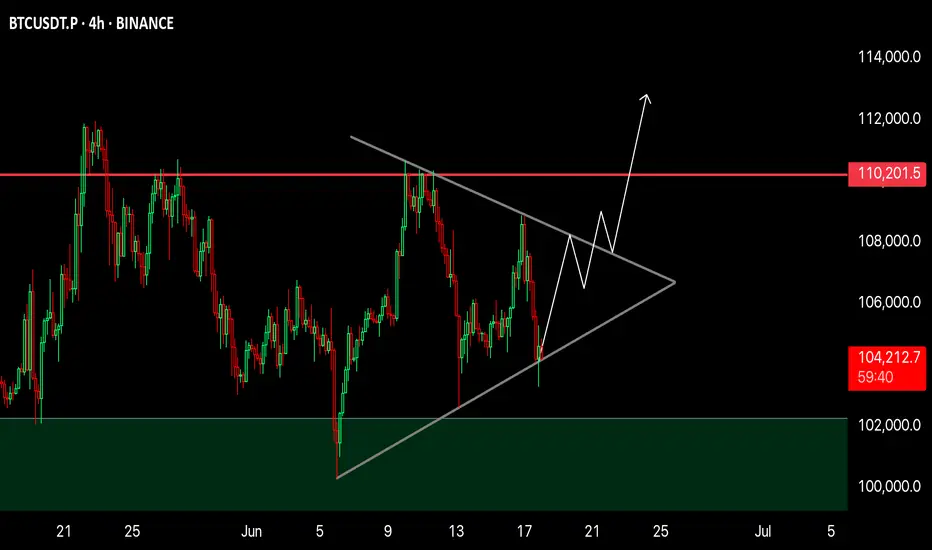
BTC 4H Analysis📈 BTC 4H Analysis – Symmetrical Triangle Breakout Loading
Bitcoin is currently consolidating inside a Symmetrical Triangle, forming higher lows and lower highs – a classic sign of volatility compression.
🔹 Structure: Symmetrical Triangle
🔹 Support Holding Strong – bulls defending the zone
🔹 Breakout Expected Soon
🔹 Major Resistance: $110,200
🔹 Breakout Target: $112,000+
Price is coiling up. Break above the triangle = strong bullish continuation likely.
🚀 Eyes on breakout — next move could be explosive!
NFA | DYOR
Uncontrolled Greed: Save Your Portfolio by these strategies Think fear is the only emotion causing big losses? Think again — this time, it’s all about greed .
🤯 That feeling when you don’t close a profitable position because you think it still has room .
📉 Let’s dive into the chart and see how even pro traders fall into the greed trap .
Hello✌
Spend 3 minutes ⏰ reading this educational material.
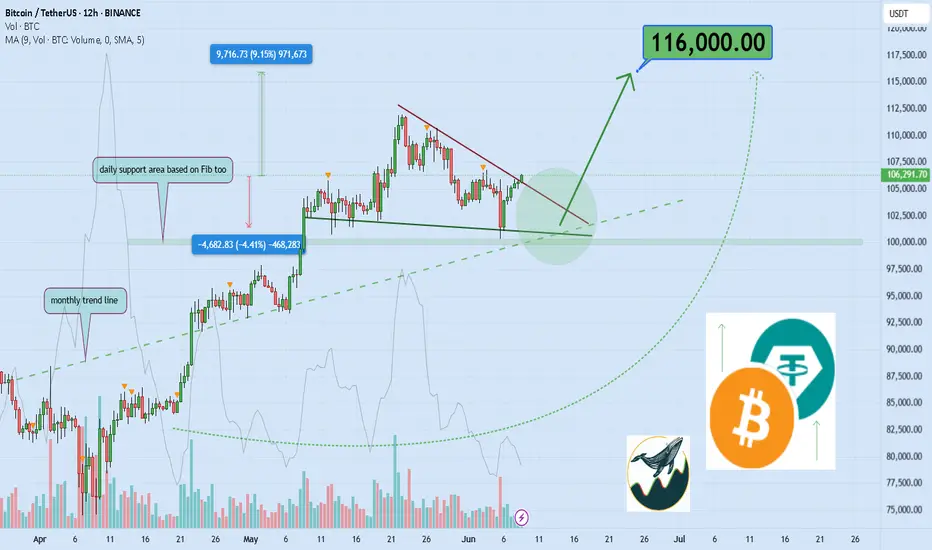
🎯 Analytical Insight on Bitcoin:
Bitcoin is currently testing a major monthly trendline alongside a key daily support zone, both aligning with Fibonacci retracement levels.📐 This confluence suggests a potential upside move of at least 9%, with a primary target projected near the $116,000 mark .📈 Market participants should watch this level closely as it may serve as a pivot for mid-term price action.
Now , let's dive into the educational section,
🧠 The Psychology of Greed in Trading
Greed speaks quietly but hits hard. It whispers: “Just a bit more. Let it run.”
But that’s the same voice that turns green into deep red. Markets don’t care about your dreams.
When a small win turns into a big loss — that’s greed in action.
No one knows the top. Trying to predict it out of emotion is how portfolios get wrecked.
Greed often spikes after multiple winning trades — when overconfidence kicks in.
That’s when you need data, not dopamine.
📊 TradingView Tools That Help Tame Greed
TradingView isn’t just a charting platform — if used right, it can be your emotional assistant too.
Start with RSI . When it crosses above 70, it signals overbought zones — prime time for greedy entries.
Volume Profile shows you where the smart money moves. If you see high volume at price peaks, it’s often too late to jump in.
Set up Alerts to get notified when your indicators hit key levels — avoid reacting in real-time chaos.
Use Replay Mode to rewatch old setups and identify where greed affected your past decisions.
Customize Chart Layouts per market type. Having a focused view helps you act based on logic, not emotion.
🛡 Strategies to Defeat Greed
Pre-define your take-profit and stop-loss before you enter. Non-negotiable.
Create a Psych Checklist: “Am I trading based on a missed move? Or a solid signal?”
After every trade, reflect on what drove your decisions — fear, logic, or greed?
Take a trading break after a streak of wins. That’s when greed loves to sneak in.
Withdraw a portion of your profits to reinforce the habit of securing gains.
Practice on demo during volatile days to build emotional discipline.
Never try to win back all losses in one trade — that’s greed’s playground.
If you're sizing up every position just because "the market is hot", pause.
Focus on surviving, not conquering. Long-term traders are calm, not greedy.
✅ Wrap-Up
In crypto's wild swings, greed destroys faster than any technical mistake.
Enter with a plan. Exit with purpose. Greed-based trades usually end with regret.
Emotional control equals long-term survival. Trade smart — not just hungry
📜 Please remember to do your own research before making any investment decisions. Also, don’t forget to check the disclaimer at the bottom of each post for more details.
✨ Need a little love!
We put so much love and time into bringing you useful content & your support truly keeps us going. don’t be shy—drop a comment below. We’d love to hear from you! 💛
Big thanks ,
Mad Whale 🐋
BTC Drops again ?
**Mastering Zones: Your Quick Trading Guide!**
Remember the core logic:
* **🔵 Blue Zone:**
* **PUMPS FROM BLUE** (Look for buys!)
* **DUMPS IF BREAKS BLUE** (Consider sells/exit longs!)
* **🔴 Red Zone:**
* **DUMPS FROM RED** (Look for sells!)
* **PUMPS IF BREAKS RED** (Consider buys/enter longs!)
Apply this to your charts for clear signals. Stay sharp!
btcwill be looking on long on BTC using 2 confluence.
1 is under nearest resistant that turn to support
or the
0.75 confluence