BTC high adjustment may fall back below 100,000
Technical analysis of Bitcoin (BTC): high-level shock consolidation, pay attention to the key breakthrough direction
Trend structure analysis
Daily level: The overall strong upward trend is still maintained, but it will enter the high-level adjustment stage in the short term.
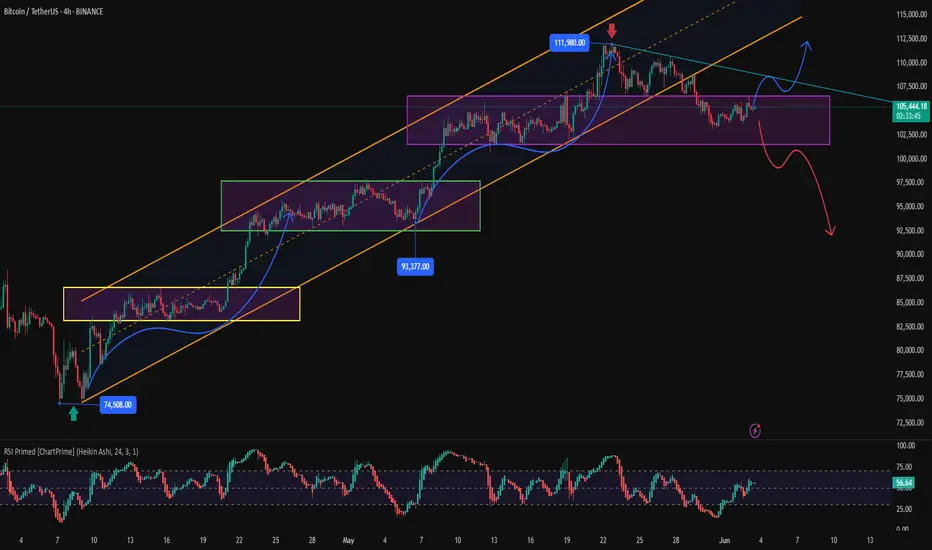
4-hour level: Previously, it was a step-by-step upward channel, and the price climbed from 74,500 (double bottom support) to 112,000, and then fell back and fell below the upward channel, entering a horizontal consolidation.
1-hour level: It is currently in the correction range of the last round of rise in 4 hours, and a 101,500-106,500 shock box is formed in the short term.
Key support and resistance
Upper resistance: 106,500 (upper edge of short-term range), 108,000 (suppression of downward trend line)
Lower support: 101,500 (lower edge of short-term range), 98,000 (deeper callback support)
Operation strategy
Short-term trading (buy low and sell high within the range)
Long order reference: 101,500-102,000 area, stop loss 100,500, target 105,000-106,500
Short order reference: 106,500-107,000 area, stop loss 108,000, target 103,000-101,500
Swing trading (pay attention to trend breakthrough)
If the rebound is blocked at 106,500-108,000 (suppression of downward trend line), short orders can be arranged with a target below 101,500.
If it breaks through 108,000, it may restart the upward trend. You can go long after the pullback, with the target of 112,000.
Summary
Bitcoin is in a high-level shock correction in the short term. Before breaking through the 101,500-106,500 range, you can sell high and buy low. If it falls below 101,500, it may further pull back; on the contrary, breaking through 108,000 may continue the upward trend. It is necessary to pay close attention to the breakthrough of key positions and adjust strategies flexibly.
BTCUSDT.P trade ideas
BTC/USDT: Strong Bullish Alignment, All Signals Green (01/06/25)__________________________________________________________________________________
Technical Overview – Summary Points
__________________________________________________________________________________
Momentum: Bullish structure confirmed by Risk On / Risk Off Indicator (“BUY” across all timeframes).
Key Supports: 103k–104k, consolidated on every horizon (1D to 15min).
Resistances: 105.5k–108k (short-term), 110k as a main pivot.
Volume: Moderately high, with no climax or distribution signals.
Behaviour: Proprietary indicators (ISPD DIV) show strong bullish confluence across timeframes; no divergences or significant bearish signals.
__________________________________________________________________________________
Strategic Summary
__________________________________________________________________________________
Directional Bias: Dominant bullish bias across all timeframes.
Opportunities: Tactical entries on pullbacks to 103k–104k, main exits >108/110k.
Risk: Invalidation below 101k; watch for extreme volumes or major macro catalysts.
Catalysts: Strong global risk-on dynamics (tech rally, institutional flows, weak USD); monitoring SEC regulation and macro events (NFP, CPI, FED).
Plan of action: Buy defended support zones, reduce on exuberance >110k, dynamic stop below 101k, stay reactive ahead of major events.
__________________________________________________________________________________
Multi-Timeframe Analysis
__________________________________________________________________________________
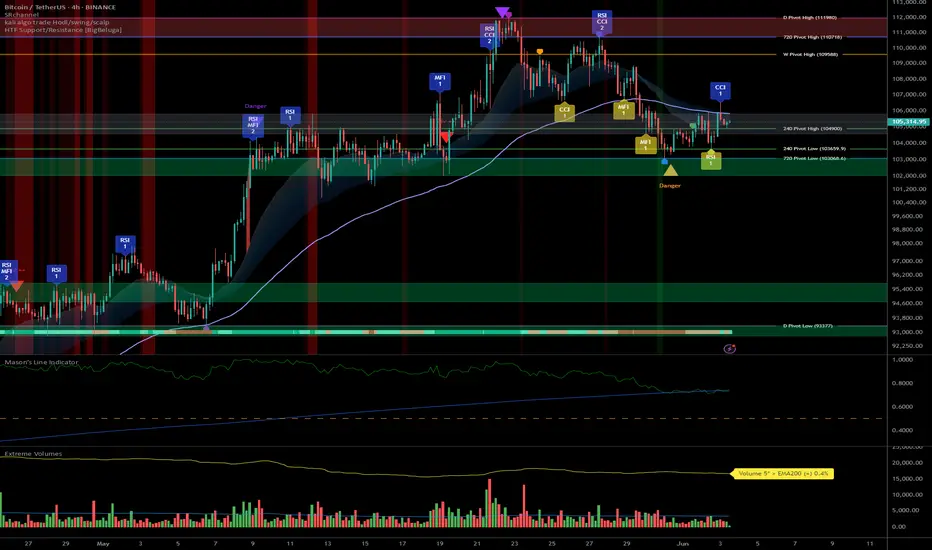
1D: Major resistance at 110k (Pivot High), strong support 101–104k, Risk On / Risk Off Indicator “BUY,” healthy volume; maintained momentum.
12H: Confluent resistance 105.5–110k, support 102.5–104k, bullish indicators, no divergence or volume climax.
6H: Resistances 105.5/108k, solid support 103–104k, strict bullish confirmations.
4H: Clustered resistances 105.5/108k, dense support 103–104k, digestion phase in volume (healthy consolidation).
2H: Major pivots 105–108k, supports 103k/101.5k, strong demand on pullback.
1H: Barriers 105.5–106k, support 103.4–104.2k, no bearish signals.
30min: Spot resistance at 105.5k+, support 103.8–104.2k, microstructure favors buying, weak selling pressure.
15min: Support 104k, resistance 105.5–106k, intraday flow remains pro-buy on weakness.
Risk On / Risk Off Indicator: Consistent “BUY” signal across all timeframes — sector and behavioural momentum alignment.
ISPD DIV: Positive histogram, no red zones or distribution alerts.
Volumes: Normal to moderately high, no climax suggesting trend end.
Summary: Strong multi-timeframe technical alignment. Bullish momentum, firmly defended supports. No imminent reversal signals, healthy consolidation within dominant risk-on trend.
__________________________________________________________________________________
Strategic & Fundamental Synthesis
__________________________________________________________________________________
Technical bias: Strong bullish conviction as long as 103–104k is defended, supported by Risk On / Risk Off Indicator/ISPD.
Fundamentals: Macro momentum (Nasdaq/US tech rally, weak USD), OI and spot dominance high, growing euphoria (ATH ~111k), watch for potential distribution if buyer exuberance peaks (P/L ratio 12:1).
Scenarios: Buy on defended flows 103–104k, TP >108–110k; caution on extreme volume at support.
Macro: Anticipate reactions to major events (NFP, CPI, FED). If a key event is due within 48h: prudence, adapt post-release.
Opportunities: Potential rotation to altcoins (SOL/ETH), short-term swing as BTC momentum pauses.
Momentum prevails, but caution warranted on any volume spikes or major macro headlines. Market remains a buy at support, optimal strategy is dynamic pullback/TP management, strict discipline in case of high-volume sell-off.
__________________________________________________________________________________
Actionable Summary
__________________________________________________________________________________
Entry: Buy securely on 103–104.2k zone
Stop: Hard invalidation if <101k (on volume)
Take Profit: 108–110k+
Risk: Excessive on-chain euphoria, violent support break
Stay agile near major releases and watch flow rotations (BTC/ALT)
__________________________________________________________________________________
TradeCityPro | Bitcoin Daily Analysis #106👋 Welcome to TradeCity Pro!
Let’s dive into Bitcoin and the key crypto indices. As usual, I’ll be reviewing the futures triggers for the New York session.
⏳ 1-Hour Timeframe
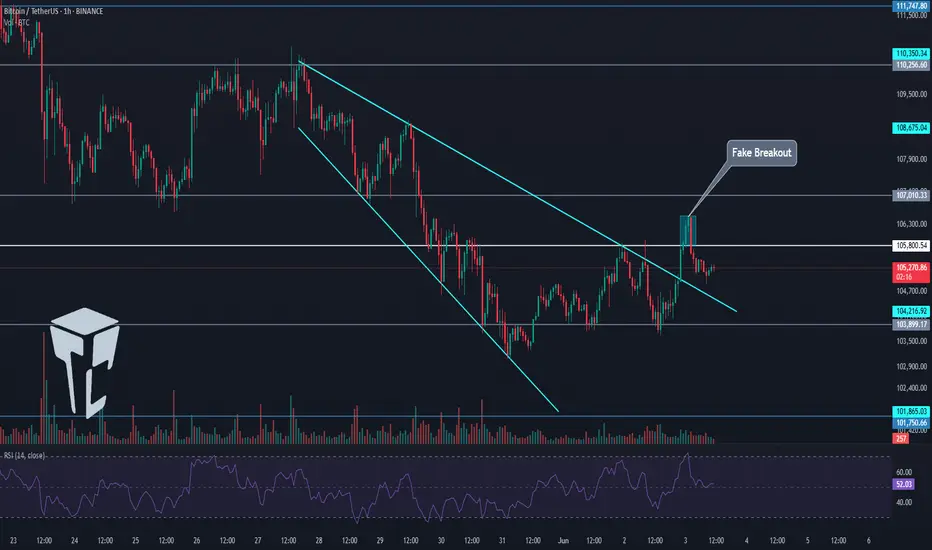
On the 1-hour chart, the 105800 trigger was activated yesterday and Bitcoin’s trendline was broken. However, the price failed to hold above 105800 and quickly fell back below, making it a fake breakout.
⚡️ For now, I’m keeping the 105800 level as the long trigger to observe how the price reacts. We need to wait for a clear reaction to this zone to better refine the trendline. On the next test, if it breaks successfully, we can enter a long position.
🔍 If a higher low forms above 103899 and the RSI finds support above 50, the likelihood of breaking the 105800 resistance increases, potentially leading to a stronger upward move.
✨ On the short side, since the 105800 breakout failed, bearish momentum could increase. A breakdown below 103899 would trigger a short position with a target at 10750.
If you’ve already opened a short position before this trigger, be aware that it's a risky trade and shouldn’t be relied on as a long-term position.
👑 BTC.D Analysis
The downtrend in Bitcoin dominance has continued following the breakdown of 64.29, and now it has also broken below 64.15, heading toward 63.87.
⭐ For now, BTC dominance is temporarily bearish. If the market corrects, Bitcoin might fall harder, but if the market recovers, altcoins could perform better — unless BTC dominance reverses trend.
📅 Total2 Analysis
Yesterday, the long trigger at 1.16 was activated, and now the index has reached 1.18. Thanks to falling Bitcoin dominance, altcoins have outperformed Bitcoin.
✔️ If 1.18 breaks, the uptrend could continue. Key levels to watch next are 1.21 and 1.24.
📅 USDT.D Analysis
This index formed a lower high below 4.79 yesterday and is now retesting 4.70 after breaking below it.
🎲 If this pullback gets rejected, it confirms weakness in USDT dominance — which supports long positions on altcoins. However, if USDT.D climbs back above 4.70 and it turns into a fake breakdown, there’s a strong chance it could revisit 4.79 or even break that resistance.
❌ Disclaimer ❌
Trading futures is highly risky and dangerous. If you're not an expert, these triggers may not be suitable for you. You should first learn risk and capital management. You can also use the educational content from this channel.
Finally, these triggers reflect my personal opinions on price action, and the market may move completely against this analysis. So, do your own research before opening any position.
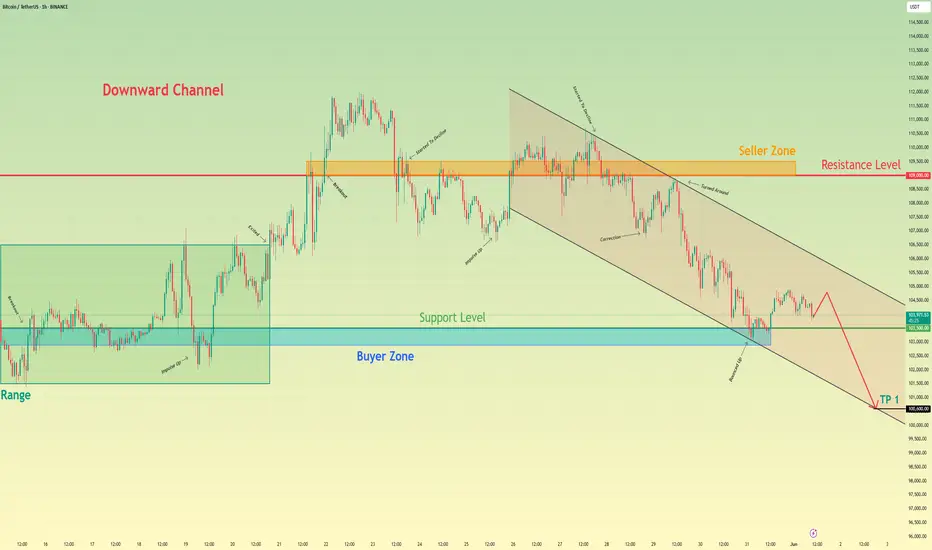
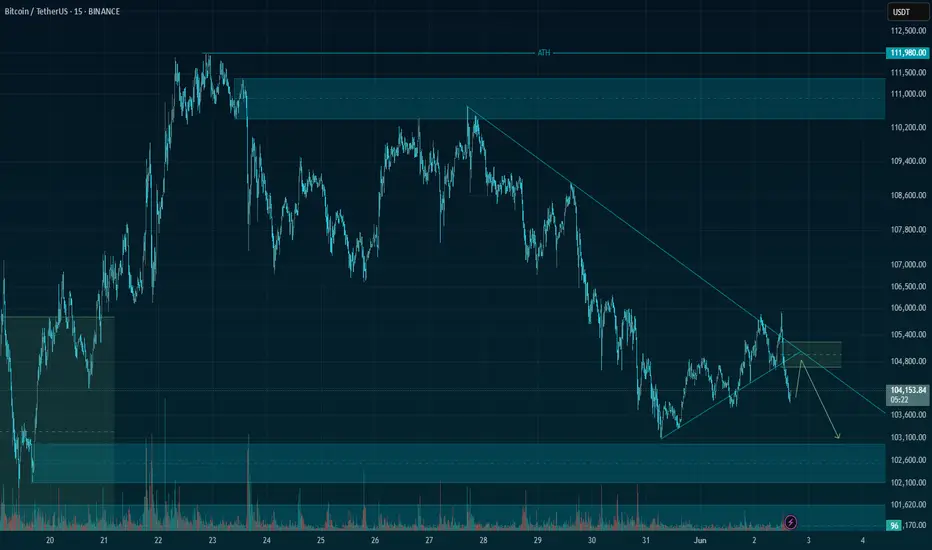
Bitcoin may break support level and continue to fall in channelHello traders, I want share with you my opinion about Bitcoin. Previously, price was moving inside a horizontal range, consolidating between resistance and the buyer zone near 103500 - 102900. The market lacked clear direction, and price repeatedly rebounded within this structure, failing to build strong momentum either way. Eventually, BTC exited the range and began forming a downward channel. This shift introduced a clear bearish bias, with each high being lower than the previous one. Price action started respecting the descending resistance and support lines, confirming the structure. Sellers consistently stepped in from the seller zone near 109000 - 109500, pushing the price downward with each retest. Currently, BTC is hovering around the support level at 103500 points, showing short-term weakness. The latest reaction from this area didn’t generate significant bullish follow-through. In my view, BTC is likely to break through this support and continue falling inside the channel. That’s why I’ve placed my TP at 100600 points, which matches the support line of the channel and offers a logical downside target. Please share this idea with your friends and click Boost 🚀
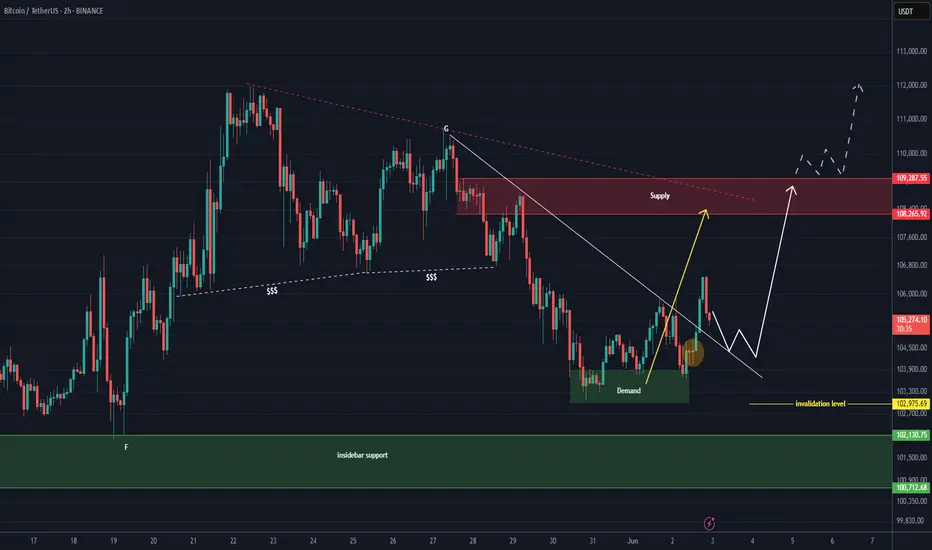
DeGRAM | BTCUSD fixed above the $104,000 level📊 Technical Analysis
● Bulls twice defended the 103-105 k demand and purple trend-line, turning the zone into a springboard; price also reclaimed the inner grey trend-median, preserving higher-lows in the 7-week rising channel.
● A fresh ascending triangle is coiling under 111 k; pattern height projects to the red 112-115 k supply/channel roof once 111 k gives way, while invalidation rises with the trend-line at 103 k.
💡 Fundamental Analysis
● CoinShares reports a third straight week of spot-ETF inflows (+US$1 bn) and the BTC exchange reserve just printed a new 3-year low, signalling supply squeeze. Meanwhile, ISM manufacturing slipped back below 50, cooling U.S. yields and the DXY and reviving crypto appetite.
✨ Summary
Long 104-106 k; triangle break >111 k targets 112 k → 115 k. Bull view void on a 16 h close beneath 103 k.

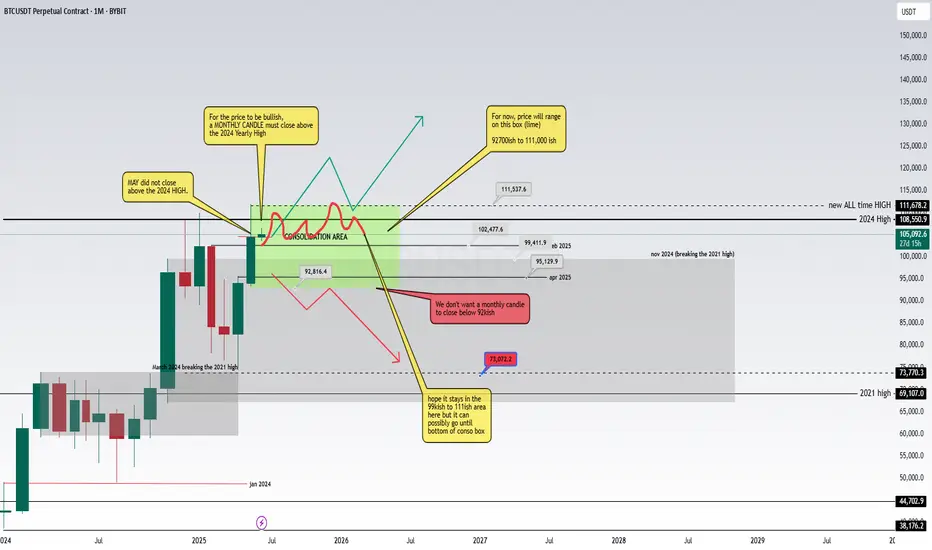
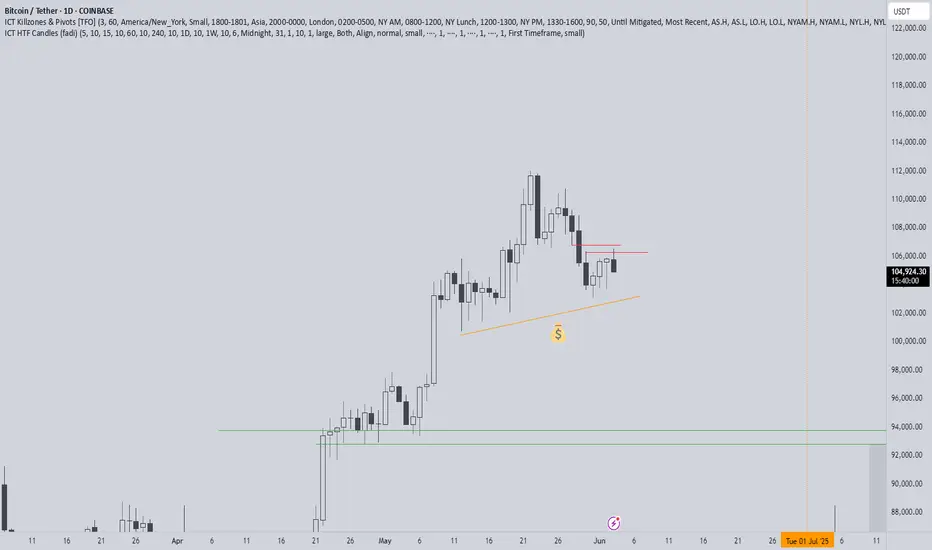
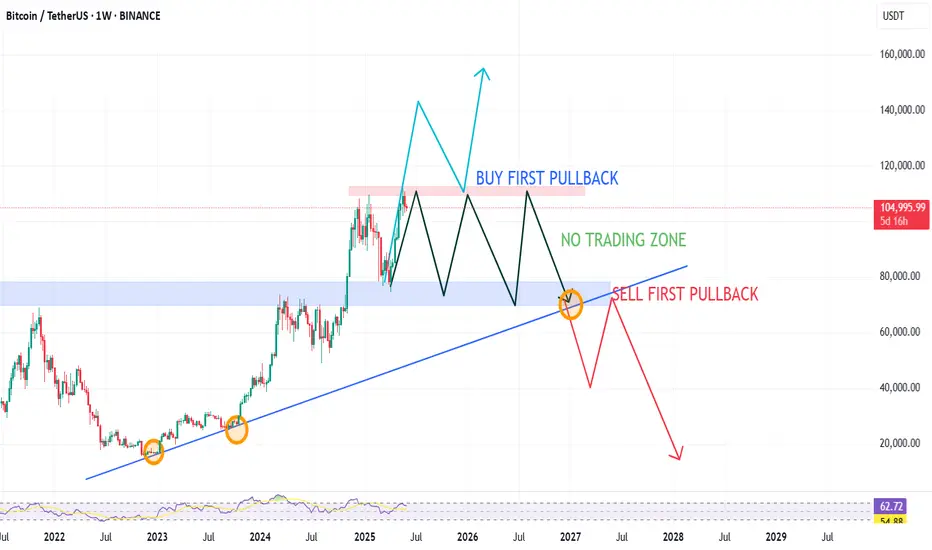
BTC - High Level Analysis (DAILY TF)Just a DAILY tf view of the High Level Analysis.
> It shows where the price may range in the next few days, weeks or months.
Key points:
We need a monthly candle above the yearly high(2024) in order for BTC
to continue its bullish momentum.
Otherwise, we expect it to range on the 92kish to 111kish area (with possible low time frame wicks on both top or bottom)

Long trade
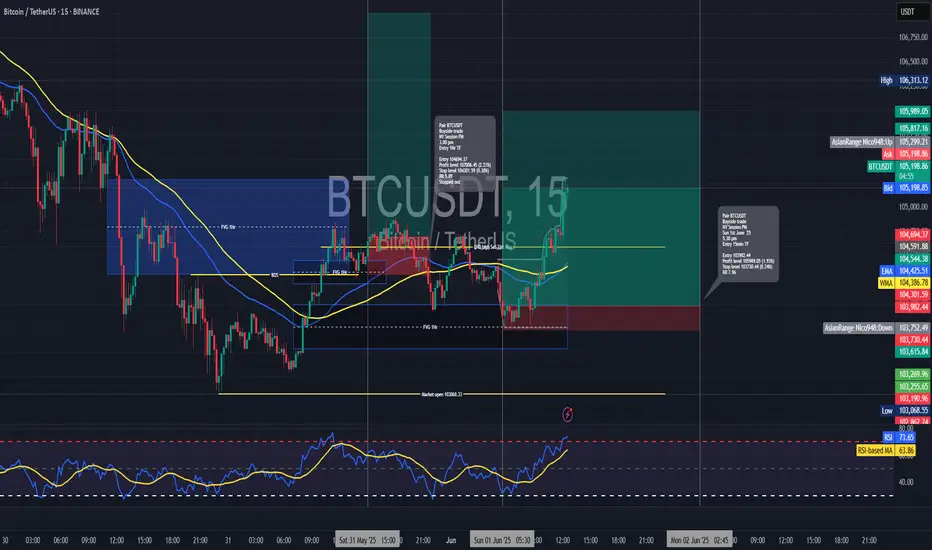
BTCUSDT (Buyside Trade)
🗓 Date: Sunday, 1st June 2025
⏰ Time: 5:30 PM
📍 Session: New York PM
📈 Timeframe: 15-Minute (Intraday Setup)
📊 Market Structure Tool: Break of Structure + FVG (Fair Value Gap) Retest
🧠 Confirmation Tool: RSI overbought
🔹 Trade Details:
Entry Price: 103,982.44
Take Profit: 105,989.05 (+1.93%)
Stop Loss: 103,730.44 (−0.24%)
Risk-Reward Ratio: 7.96
🔹 Technical Breakdown:
Market Structure:
The price broke out of its recent range and confirmed a higher high.
Entry taken on retest into a bullish FVG within the discount zone.
Order Flow / Liquidity:
The liquidity grab below the short-term low provided a clean spring setup.
Quick absorption followed by a bullish engulfing candle confirmed entry.
BTC - High Level Analysis (monthly)High level analysis of BITCOIN for the next few days, weeks or months
BTC USDT ANALAYSISBTC/USDT At Now Previou Resistant But Still Uptrend Untill Not Break Support Trendline So Im Watchin If Break Resistant Level Then Have Fresh Pullback I Will Buy,If Moving Around Support & Resistant Area Im Waiting Im Not Doing Anything,If Break Support Area Then Have Rretest I Will Buy Btc Its Just My Planing Please Comment Me Your Plan. THANK YOU
7X Monday. My next scalp ideaDaily Update – Tuesday
Congratulations to everyone who took the trades yesterday—we landed two juicy setups that I believe were the trades of the day. We’re already up 7X for the week, and it's only Tuesday. 🔥
The second trade in London was undoubtedly juicier than the first. You take what you get and keep it moving. Let's see what today brings.
I'm currently eyeing a continuation long, as Bitcoin has shown enough strength to break structure on the 2H, albeit undecisively. This calls for caution—we may be setting up for a 4H lower high, with the next target at 110K.
The road there won’t be smooth—it’ll have its tides, turns, and plenty of opportunities.
📚 Today’s class will be sometime this afternoon, before 6 PM London time—so stay tuned for the juiciest scalps.
🎥 Video recap dropping later today — stay tuned.
Weekly Class Schedule
🕒 Monday – 3PM GMT
🕒 Tuesday – Pre 6PM GMT
🕒 Friday – TBC

Last drop to 98kHi Traders,
It looks like we see on daily an head and shoulders pattern outplay.
Whatch out and trade carefully.
I closed my longs with profit and whatch out the outplay of this possible scenario.
Good luck to all of you !
#BTC Downside risk has not been lifted📊#BTC Downside risk has not been lifted⚠️
🧠Unfortunately, it is $34 away from the second target of our short strategy of 103,000.
But don't worry, the ideal target area of the short structure has not been achieved, and the downside risk has not been lifted, so we still need to look for short opportunities after the rebound.
➡️From the current structure, the aggressive pressure level is around 106,000, and the overlapping resistance area is around 106,500-107,800.
⚠️The weekend's rise is deceptive and belongs to the repair stage after the big drop. We may see a bigger drop next week!
Let's see👀
🤜If you like my analysis, please like💖 and share💬 BITGET:BTCUSDT.P

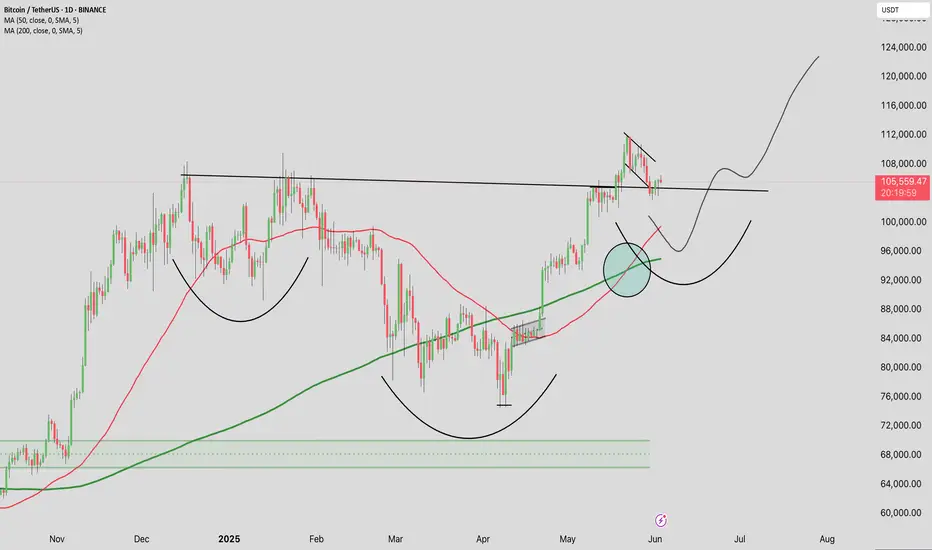
Bitcoin trend price analysis!Chart Pattern: Inverted Head and Shoulders (iH&S)
The chart shows a classic reversal pattern of the head and shoulders formation.
Left Shoulder: Late January 2025
Head: April 2025
Right Shoulder: Potentially forming near current levels (~$100K–$102K)
This bullish reversal pattern often leads to a strong bounce if the neckline is respected.
Support Zones:
$98,000 – $100,000: 50 EMA (red) and retest of the area near the neckline
$94,500 – $95,000: 200 EMA (green), last resort support
Resistance Levels:
$108,000 (horizontal neckline resistance)
$112,000 and $125,000 (bullish breakout targets)
Scenario Outlook
Bullish Case: If BTC maintains the $100K area and breaks above $108K with volume → rally towards $115K–$125 K.
Bearish Case: Breakdown below $94K invalidates the iH&S structure

Short-term trade ideas. Explaining my reasoning + Elliot Wave cShort-term trade ideas. Explaining my reasoning + Elliot Wave count.
Sound is not perfect. Will be fixed for the next episode :)
GL & HF

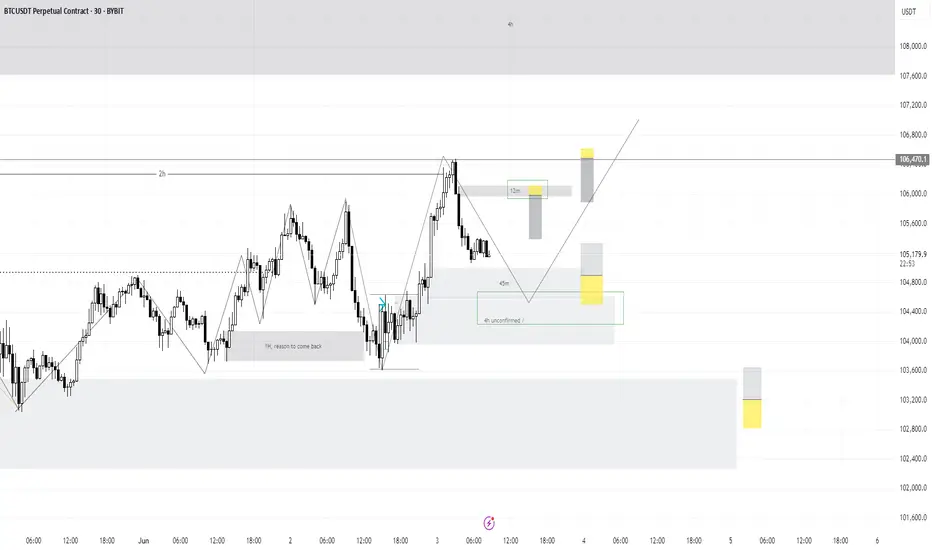
BTC NewUpdate (2H)This analysis is an update of the analysis you see in the "Related publications" section
As we had identified in the previous analysis, the price could have reversed to the upside from either the upper or lower green zone. It seems that the orders in the upper green zone were sufficient.
Given the break of the trigger line, the area marked by the yellow circle is now a key zone for us. If the price pulls back to this yellow circled area, it could move toward the red zone. And if the red zone is broken, we might witness a new all-time high (ATH).
The closure of a 4-hour candle below the invalidation level will invalidate this analysis.
For risk management, please don't forget stop loss and capital management
Comment if you have any questions
Thank You
BTCUSDT – Ready for the next downward move🚀 Trade Setup Details:
🕯 #BTC/USDT 🔽 Sell | Short 🔽
⌛️ TimeFrame: 15m
--------------------
🛡 Risk Management:
🛡 If Your Account Balance: $1000
🛡 If Your Loss-Limit: 1%
🛡 Then Your Signal Margin: $1369.86
--------------------
☄️ En1: 104838.38 (Amount: $136.99)
☄️ En2: 105096.3 (Amount: $479.45)
☄️ En3: 105280.29 (Amount: $616.44)
☄️ En4: 105464.61 (Amount: $136.99)
--------------------
☄️ If All Entries Are Activated, Then:
☄️ Average.En: 105190.14 ($1369.86)
--------------------
☑️ TP1: 104215.87 (+0.93%) (RR:1.27)
☑️ TP2: 103752.49 (+1.37%) (RR:1.88)
☑️ TP3: 103166.5 (+1.92%) (RR:2.63)
☑️ TP4: 102425.86 (+2.63%) (RR:3.6)
☑️ TP5: 101614.34 (+3.4%) (RR:4.66)
--------------------
❌ SL: 105957.69 (-0.73%) (-$10)
--------------------
💯 Maximum.Lev: 75X
⌛️ Trading Type: Swing Trading
‼️ Signal Risk: ⚠️ High-Risk! ⚠️
🔎 Technical Analysis Breakdown:
This technical analysis is based on Price Action, Elliott waves, SMC (Smart Money Concepts), and ICT (Inner Circle Trader) concepts. All entry points, Target Points, and Stop Losses are calculated using professional mathematical formulas. As a result, you can have an optimal trade setup based on great risk management.
⚠️ Disclaimer:
Trading involves significant risk, and past performance does not guarantee future results. This analysis is for informational purposes only and should not be considered financial advice. Always conduct your research and trade responsibly.
💡 Stay Updated:
Like this technical analysis? Follow me for more in-depth insights, technical setups, and market updates. Let's trade smarter together!
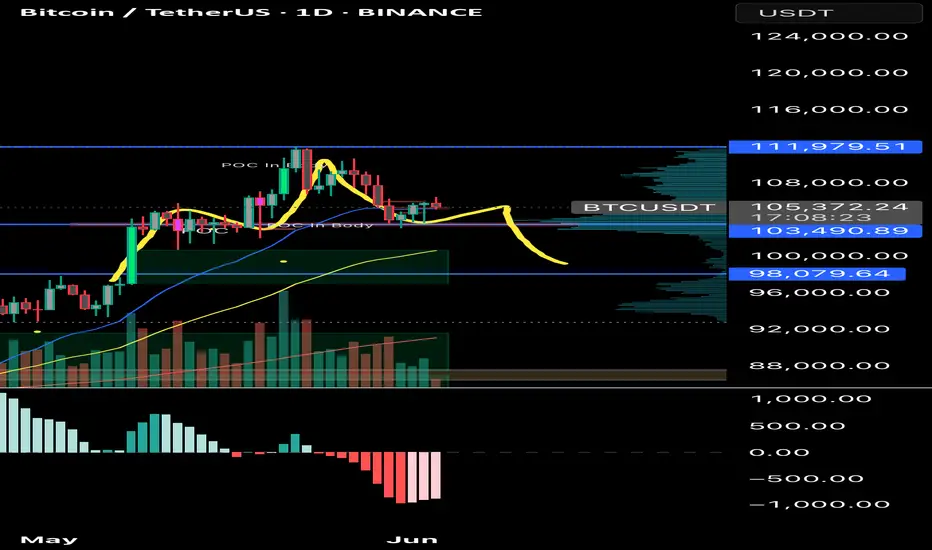
Is Bitcoin Crashing or Just a Psychological Trap Unfolding?Is this brutal Bitcoin drop really a trend shift—or just another psychological game?
Candles tell a story every day, but only a few traders read it right.
In this breakdown, we decode the emotional traps behind price action and show you how not to fall for them.
Hello✌
Spend 3 minutes ⏰ reading this educational material.
🎯 Analytical Insight on Bitcoin:
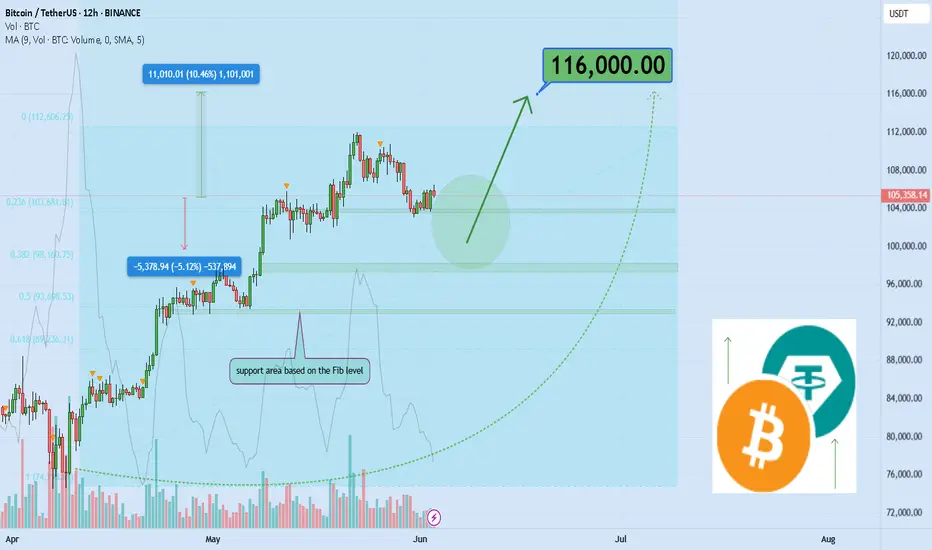
📈 Bitcoin is currently respecting a well-structured ascending channel, with price action aligning closely with a key Fibonacci retracement level and a major daily support zone—both acting as strong technical confluence. Given the strength of this setup, a potential short-term move of at least +10% seems likely, while the broader structure remains supportive of an extended bullish scenario toward the $116K target. 🚀
Now , let's dive into the educational section,
🧠 The Power of TradingView: Tools That Spot the Mind Games
When it comes to psychological traps in the market, a huge part of them can be spotted by just looking at the candles—with the right tools. TradingView offers several free indicators and features that, when combined wisely, can act like an early warning system against emotional decisions. Let’s walk through a few:
Volume Profile (Fixed Range)
Use the “Fixed Range Volume Profile” to see where real money is moving. If large red candles appear in low-volume zones, it often signals manipulation, not genuine sell pressure.
RSI Custom Alerts
Don’t just set RSI alerts at overbought/oversold levels. When RSI crashes but price barely moves, you’re watching fear being injected into the market—without actual sellers stepping in.
Divergence Detectors (Free Scripts)
Use public scripts to auto-detect bullish divergences. These often pop up right during panic drops and are gold mines of opportunity—if you’re calm enough to see them.
These tools are not just technical—they’re psychological weapons . Master them and you’ll read the market like a mind reader.
🔍 The Candle Lies Begin
One big red candle does not equal doom. It usually equals setup. Panic is a requirement before reversals.
💣 Collective Fear: The Whales' Favorite Weapon
When everyone on social media screams “sell,” guess who’s quietly buying? The whales. Fear is their liquidity provider.
🧩 Liquidity Zones: The Real Target
If you can’t see liquidity clusters on your chart, you're blind to half the game. Sudden crashes often aim at stop-loss and liquidation zones.
🔄 Quick Recovery = Fake Breakdown
If a strong red move is followed by a sharp V-shaped bounce within 24 hours—it was likely a trap. Quick recovery often means fake fear.
⚔️ Why Most Retail Traders Sell the Bottom
The brain reacts late. By the time retail decides it’s time to sell, the big players are already buying.
🧭 Real Decision Tools Over Emotion
Combine RSI, divergences, and volume metrics to make your decisions. Your gut is not a strategy—your tools are.
📉 Fake Candles: How to Spot Them
A candle with huge body but weak volume? Red flag. Especially on low timeframes. Always confirm with volume.
🔍 Timeframes Trick the Mind
M15 always looks scarier than H4. Zoom out. What feels like a meltdown might just be a hiccup on the daily chart.
🎯 Final Answer: Crash or Trap?
When you overlay psychology on top of price, traps become obvious. Don't trade the fear—trade the setup behind it.
🧨 Final Note: Summary & Suggestion
Most crashes are emotional plays, not structural failures. Use TradingView’s tools to decode the fear and flip it to your advantage. Add emotional analysis to your charting, and the market will start making sense.
always conduct your own research before making investment decisions. That being said, please take note of the disclaimer section at the bottom of each post for further details 📜✅.
Give me some energy !!
✨We invest countless hours researching opportunities and crafting valuable ideas. Your support means the world to us! If you have any questions, feel free to drop them in the comment box.
Cheers, Mad Whale. 🐋
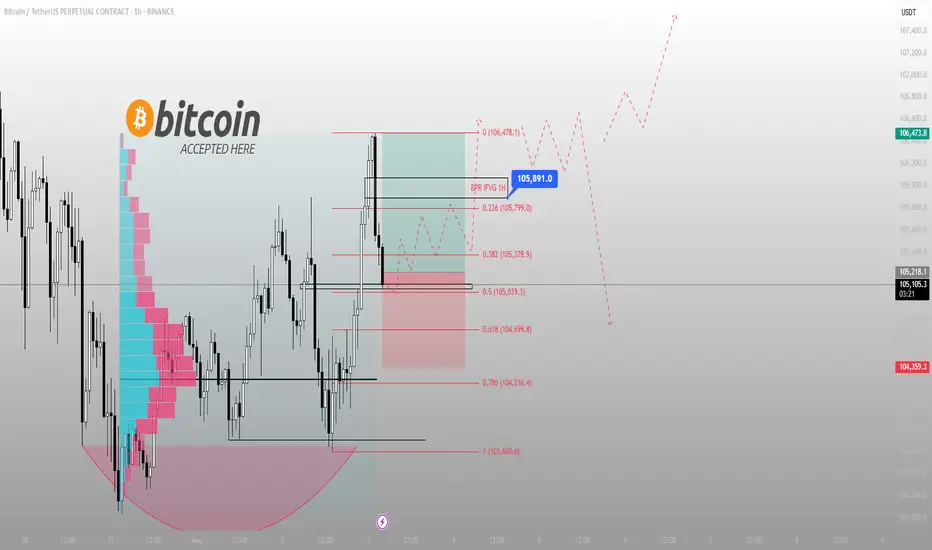
Liquidity was the excuse. Expansion was the goal.This BINANCE:BTCUSDT.P move was written before it happened — clean sweep, BPR fill, and now the setup is primed. You either knew where price was going, or you reacted late.
Price expanded aggressively into a clear 1H IFVG. That wasn’t just a push — it was a calculated run into a premium imbalance.
Now? We're retracing. Right into the EQ of the breaker block and the 0.5 fib (105,039). Exactly where the market wants you uncertain. I’m not.
Here’s the logic:
1H IFVG is filled. That’s done.
Price retraced directly into the 0.382 and 0.5 fib zone.
We have a defined BPR, and price is now hovering around its midpoint — ideal zone for reaccumulation.
As long as 104,999–105,039 holds, I expect a continuation back into 105,891 → 106,478.
If that range breaks clean, the low-hanging liquidity below 104,359 becomes a magnet.
But the narrative right now? HTF is still aligned bullish. We're in the phase where most traders get shaken out before the real move starts.
Trade idea: If I’m in, my invalidation is clean — under 104,699. Target is north of 106,000. I’ll scale partials at 105,799 and let the rest ride.
You want more trades like this? Check the account description. I don’t just post setups — I build conviction.
Let the influencers scream. I prefer precision.
BTC/USDT CHART UPDATE !!Chart Pattern: Inverted Head and Shoulders (iH&S)
The chart shows a classic reversal pattern of the head and shoulders formation.
Left Shoulder: Late January 2025
Head: April 2025
Right Shoulder: Potentially forming near current levels (~$100K–$102K)
This bullish reversal pattern often leads to a strong bounce if the neckline is respected.
Support Zones:
$98,000 – $100,000: 50 EMA (red) and retest of the area near the neckline
$94,500 – $95,000: 200 EMA (green), last resort support
Resistance Levels:
$108,000 (horizontal neckline resistance)
$112,000 and $125,000 (bullish breakout targets)
Scenario Outlook
Bullish Case: If BTC maintains the $100K area and breaks above $108K with volume → rally towards $115K–$125 K.
Bearish Case: Breakdown below $94K invalidates the iH&S structure.
Thanks for your support!
DYOR. NFA
Bitcoin: $333,333 New ATH? The Bears Are Gone!Let's start with a question: How can Bitcoin be bearish while trading above $100,000? Please answer. How is that even possible?
How can Bitcoin be bearish when the price is $105,000+ at any point in time. How? It makes absolutely no sense. Think about it.
What is it that defines Bitcoin as either bearish or bullish? It's price.
What is Bitcoin's current price?
If you were ready to sell Bitcoin at $105,000 does that mean that the bull market is over for Bitcoin? Or does it mean that you expect for Bitcoin to recover after a correction or retrace?
If it is going to recover, then how long would such an imagined correction last?
How far down would that correction go?
You know the problem with answering all those questions don't you?
The problem is that they are all in your head, based on imagination, because Bitcoin is not going down instead it has been going up now for almost two months. Straight up.
The fact that Bitcoin remains trading above 100K, safely, opens the doors for 200K. 200K means 100% growth left in the coming months and this is guaranteed based on the state of the altcoins market. We are all one.
Before you give up on Bitcoin remember the easiest of all cycles, the halving. Bull market year happens the year after the halving. Bitcoin's block reward is cut in half. Less Bitcoins, increasing demand = higher price.
It is going up. There is still so much room left for growth that you would be surprised to know, this is only the start.
Bitcoin might be preparing for the bull market of its life, 10 years growing straight up non-stop.
There is no bear-market. There is no correction. There is no retrace, there is no pause.
The data is already in, the bears are gone.
Namaste.
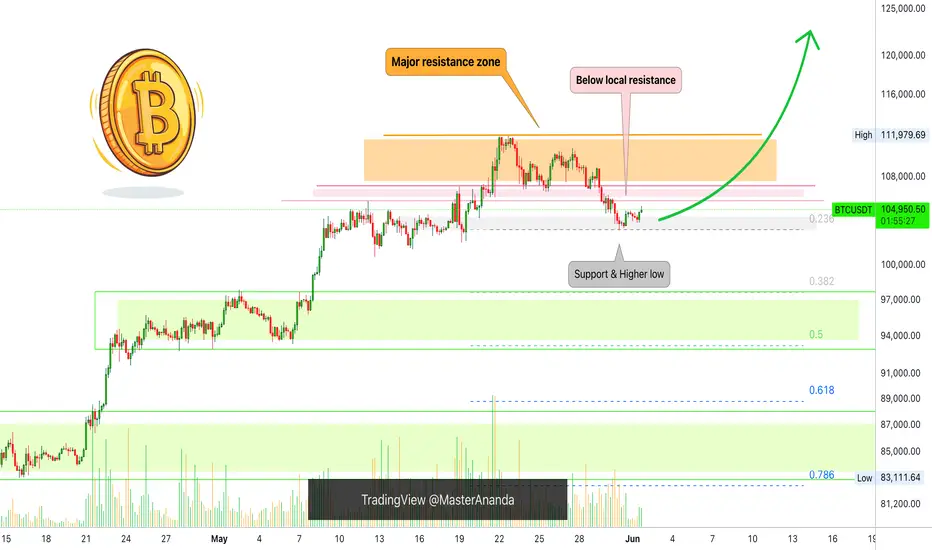
Bitcoin Turns Bullish, What To Expect—$200,000 New All-Time HighWe have good news here. Bitcoin continues trading above $100,000-$102,000, in fact, this range hasn't been tested as support so far and this is a bullish development. Not moving below 100K can lead to a new all-time high in the coming months.
What to expect short-term.
The action is bullish now and we see some rising volume. Very little volume but still rising with two green candles. We have multiple levels to consider.
1) The $106,000-$107,000 price range. This is the zone labeled "local resistance" on the chart. If Bitcoin manages to move and close above this level on a daily basis, we can say the bulls are back in. While Bitcoin trades below this level, market conditions remain bearish and you can expect lower prices. Right now it is still bearish.
2) Once this local resistance is broken the next resistance to consider sits around $110,000. As soon as Bitcoin breaks this level it is hyper-bullish and we can aim for 200K.
Let's visit the all-time high potential in late 2025.
» If Bitcoin crashes below 100K and reaches the low 90Ks or lower, then the 200K target for a new ath later this year becomes less likely.
» If Bitcoin never moves below 100K then 200K becomes a high probability target, makes sense?
Right now conditions are still bearish because Bitcoin trades below "local resistance." The small green candles are not enough and it is still too early to say. Market conditions remain the same.
A good scenario would be consolidation, sideways, before additional growth. This would produce the best possible conditions for the altcoins market to thrive and grow.
Namaste.