Explanation of indicators indicating high points
Hello, traders.
If you "Follow", you can always get new information quickly.
Have a nice day today.
-------------------------------------
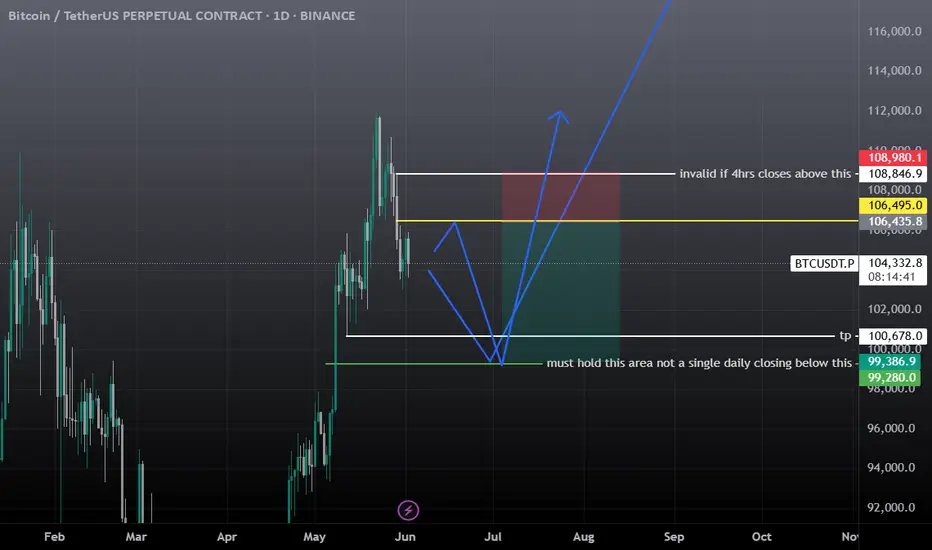
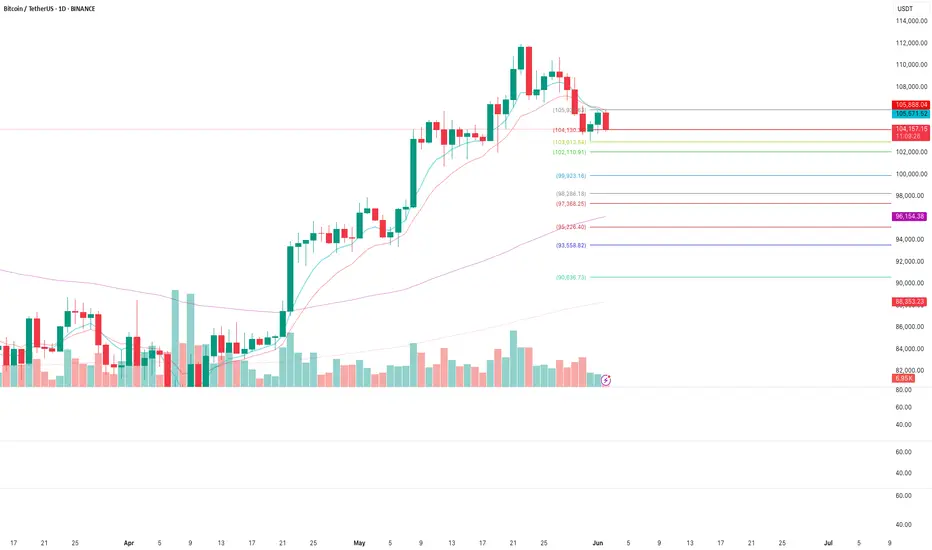
(BTCUSDT 1D chart)
If it falls below the finger point indicated by the OBV indicator, it can be interpreted that the channel consisting of the High Line ~ Low Line is likely to turn into a downward channel.
And, if it falls to the point indicated by the arrow, it is expected that the channel consisting of the High Line ~ Low Line will turn into a downward channel.
Therefore, if it is maintained above the point indicated by the finger, I think it is likely to show a movement to rise above the High Line.
In this situation, the price is located near the M-Signal indicator on the 1D chart, so its importance increases.
To say that it has turned into a short-term uptrend, the price must be maintained above the M-Signal indicator on the 1D chart.
In that sense, the 106133.74 point is an important support and resistance point.
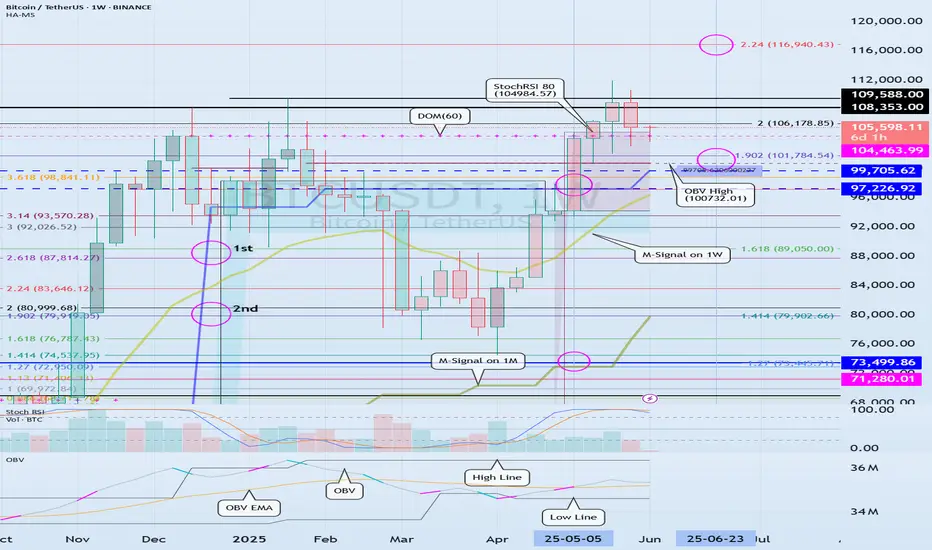
(1W chart)
The HA-High indicator is showing signs of being created at the 99705.62 point.
The fact that the HA-High indicator has been created means that it has fallen from the high point range.
However, since the HA-High indicator receives the value of the Heikin-Ashi chart, it indicates the middle point.
In other words, the value of Heikin-Ashi's Close = (Open + High + Low + Close) / 4 is received.
Since the HA-High indicator has not been created yet, we will be able to know for sure whether it has been created next week.
In any case, it seems to be about to be created, and if it maintains the downward candle, the HA-High indicator will eventually be created anew.
Therefore, I think it is important to be able to maintain the price by rising above the right Fibonacci ratio 2 (106178.85).
Indicators that indicate high points include DOM (60), StochRSI 80, OBV High, and HA-High indicators.
Indicators that indicate these high points are likely to eventually play the role of resistance points.
Therefore,
1st high point range: 104463.99-104984.57
2nd high point range: 99705.62-100732.01
You should consider a response plan depending on whether there is support near the 1st and 2nd above.
The basic trading strategy is to buy at the HA-Low indicator and sell at the HA-High indicator.
However, if it is supported and rises in the HA-High indicator, it is likely to show a stepwise rise, and if it is resisted and falls in the HA-Low indicator, it is likely to show a stepwise decline.
Therefore, the basic trading method should utilize the split trading method.
Other indicators besides the HA-Low and HA-High indicators are auxiliary indicators.
Therefore, the trading strategy in the big picture should be created around the HA-Low and HA-High indicators, and the detailed response strategy can be carried out by referring to other indicators according to the price movement.
In that sense, if we interpret the current chart, it should be interpreted that it is likely to show a stepwise rise since it has risen above the HA-High indicator.
However, you can choose whether to respond depending on whether there is support from other indicators that indicate the high point.
On the other hand, indicators that indicate the low point include the DOM (-60), StochRSI 20, OBV Low, and HA-Low indicators.
These indicators pointing to lows are likely to eventually serve as support points.
I will explain this again when the point pointing to the lows has fallen.
-
Thank you for reading to the end.
I hope you have a successful trade.
--------------------------------------------------
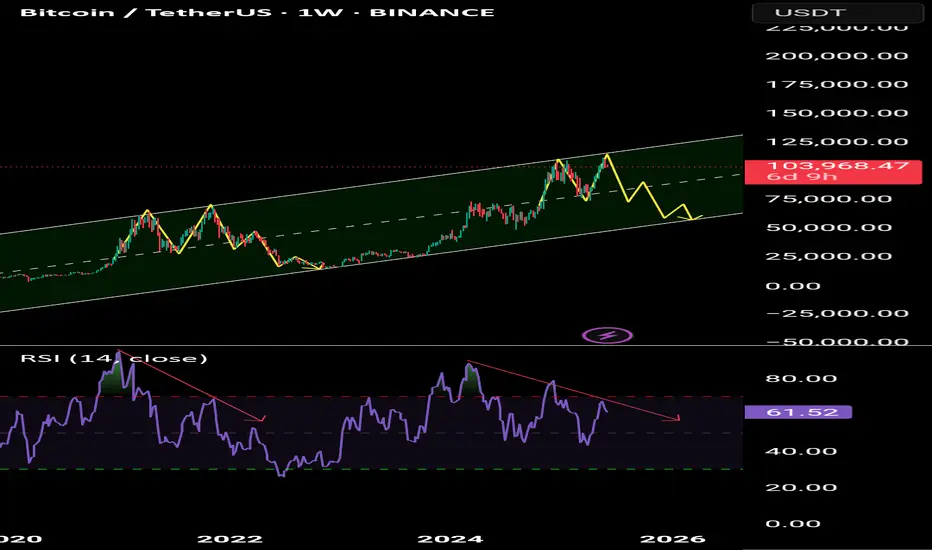
- Here is an explanation of the big picture.
(3-year bull market, 1-year bear market pattern)
I will explain the details again when the bear market starts.
------------------------------------------------------
BTCUSDT.P trade ideas
BTC Scalping / Intraday Signal – Entry, Stop & Target Ready!🕒 Timeframe: 15min / 5min
⚠️ Note: Manage your risk — intraday volatility is high.
This is a short-term opportunity, not a long hold.
Disclaimer: This is our personal analysis and not financial advice. Always do your own research before making any investment decisions.
💬 What’s your take on this? Drop your thoughts in the comments and feel free to share this with your friends! ❤️

HOW TO: The right way to use the MACDMany people mistakenly use the MACD histogram to enter trades without taking price action into context. In this video I'm going to show you how to interoperate the MACD Histogram, what it means and when its warning you.

BTCUSDT(2025-06-03)New developments of increasing tensions between Russia and Ukraine could indicate a decline in this part of the chart. I am watching.
earish trand analysis Read The ChaptianSMC trading point update
Technical analysis of (BTC/USDT) based on the 4-hour timeframe. Here’s a detailed breakdown of the analysis and the idea behind it:
---
Key Components of the Analysis:
1. Resistance Zone (FVG - Fair Value Gap):
The yellow zone marked as “fvg resistance level” indicates an area where price previously dropped quickly, suggesting inefficiency or imbalance in the market.
Price is approaching this zone again, which acts as a strong resistance.
2. Trendline & Lower Highs:
A descending trendline (with red arrows) shows consistent lower highs, indicating ongoing bearish pressure.
Each rejection from the trendline reinforces sellers’ dominance.
3. CHOCH (Change of Character):
The label “choch” signifies a market structure break, where bullish structure turned bearish.
This marks the transition to a downtrend.
4. EMA 200 (Exponential Moving Average):
The EMA (currently around 102,753) acts as dynamic support.
Price is currently trading above it, but a rejection from the resistance may push it below.
5. Target Zone:
A yellow box near 100,817.99 is labeled “target point”, indicating a possible short-term bearish target if price gets rejected at resistance.
6. RSI (Relative Strength Index):
RSI is around 47.11, slightly below neutral (50), suggesting bearish momentum could be building.
No clear oversold or overbought conditions yet.
---
Trade Idea Summary:
Bias: Bearish
Scenario:
If price reaches the resistance zone (~106,800–107,500) and fails to break above, a sell-off is expected.
First target: 100,800–101,000 zone
Price may also dip below EMA 200 confirming bearish strength.
Confirmation:
Rejection candle or bearish engulfing pattern near resistance.
RSI staying below 50 and starting to dip.
Invalidation:
Clean breakout and close above the resistance zone and trendline (~108,000+).
Mr SMC Trading point
---
Conclusion:
This chart sets up a high-probability short trade around the resistance area, leveraging both structural and momentum indicators. It suggests waiting for confirmation of rejection before entering, targeting the previous support and imbalance zone below.
Pales support boost 🚀 analysis follow)

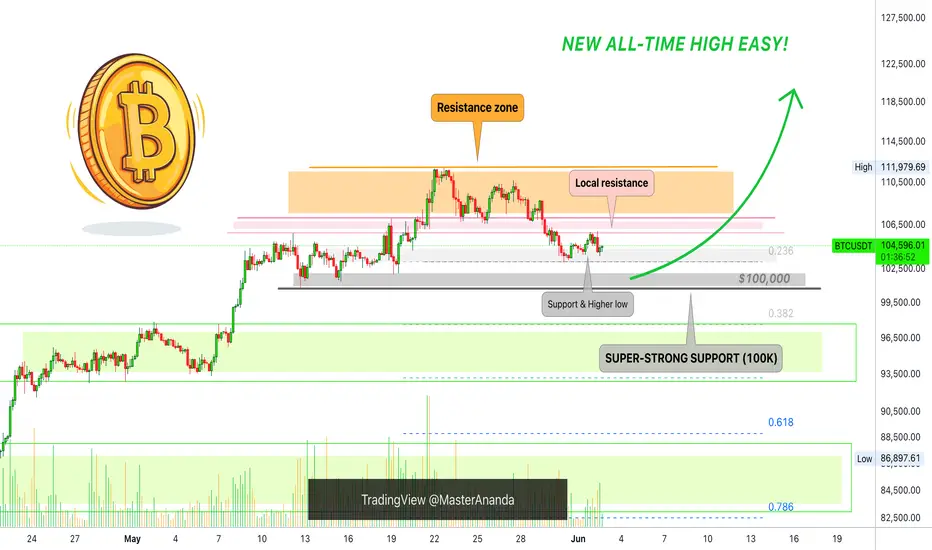
Bitcoin Bullish Bias Becomes Stronger —New All-Time High EasyWith every day that passes and Bitcoin doesn't move below 100K the bullish bias becomes stronger. It is a death sentence for the bears. Bitcoin can't never move lower as long as the $100-$102,000 mega support barrier continues intact. And it hasn't been tested yet.
Good afternoon my fellow Cryptocurrency genius, how are you feeling today?
The market gives, the market also takes.
When looking at Bitcoin with a short-term mindset, everything is possible, it is hard to predict what will happen next but, when we focus on the actual price action, no doubt remains. Let me explain.
It doesn't matter if a candle is big or small...
It doesn't matter if Michael Saylor and the ETFs are buying or selling Bitcoin, what matters most is resistance and support.
Bitcoin's strong long-term mega-support remains intact and that is $102,000. Bitcoin is hyper-bullish above $100,000 and this is obvious. We are near the all-time high and the closer the action happens to resistance, the stronger the market. As Bitcoin moves sideways, consolidation, the altcoins will grow.
The altcoins cannot grow if Bitcoin is going to crash and yet the altcoins are starting to recover and some are looking great. I will continue to share more and the more I share the more convinced you will become that the next major move is up. We are set to experience growth long-term.
Aim higher, we are now-already in the 2025 bull market.
Never short Bitcoin within a bull market.
Namaste.
Bitcoin AnalysisShort technical analysis on bitcoin as people have asked for my views. I do not actively trade any cryptos anymore however i am still holding onto my BTC and ETH investments.

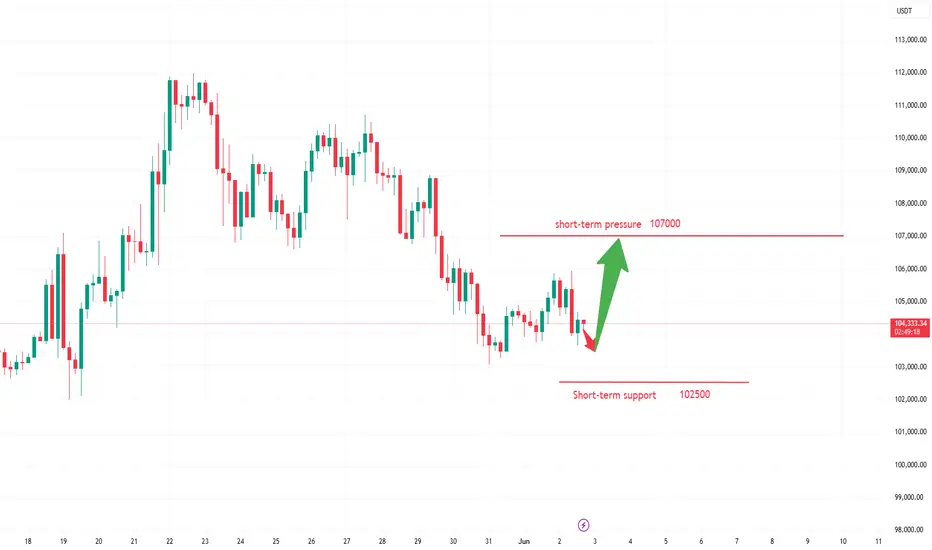
The inflow of funds provides momentum for the rise of Bitcoin.If market bullish sentiment surges and is fueled by new positive catalysts (such as increased institutional capital inflows or positive regulatory policy signals), the price of Bitcoin could break above the resistance level of $106,000. A successful breakout would open up new upside potential, with upward targets potentially reaching $107,500 or even higher.
Humans need to breathe, and perfect trading is like breathing—maintaining flexibility without needing to trade every market swing. The secret to profitable trading lies in implementing simple rules: repeating simple tasks consistently and enforcing them strictly over the long term.
Live trade update In today’s video, we break down the global and local view of Bitcoin and highlight a juicy trade from earlier today. Plus, we’ve refined the setup for Monday and included free scalp setups.
Follow for more trading insights!

Market next target 🟢 1. Strong Support Zone Nearby
The region around $103,500–$104,000 has acted as a strong demand zone historically (look left).
BTC might bounce from this level instead of continuing the downtrend.
---
🔄 2. Consolidation, Not Breakdown
The price action appears more sideways/choppy than strongly bearish.
Without a clean breakdown candle below key support, this might be accumulation, not distribution.
---
📉 3. Bearish Momentum Weakness
Volume on the recent red candles is not significantly increasing.
This implies lack of strong conviction from sellers.
BTCThe range marked by the formation of a confirmation candle is suitable for entering a short trade.

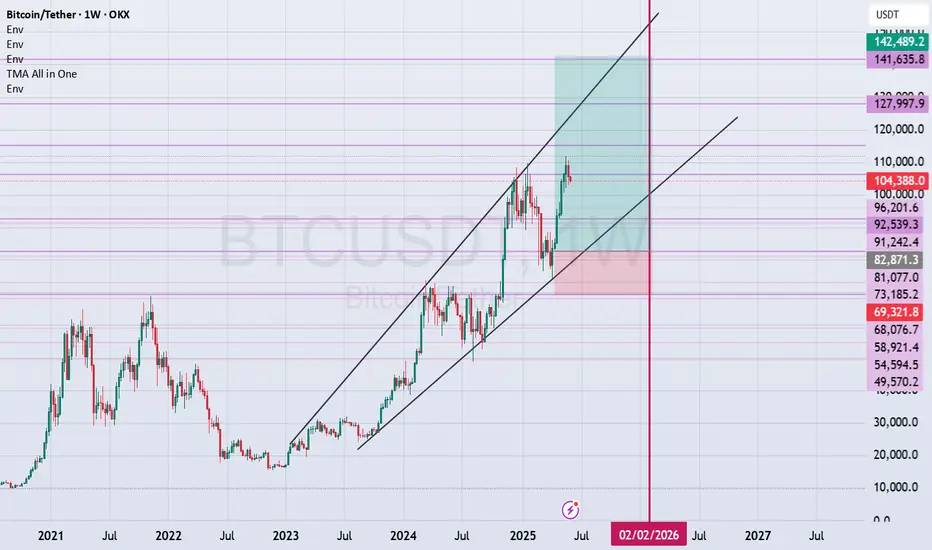
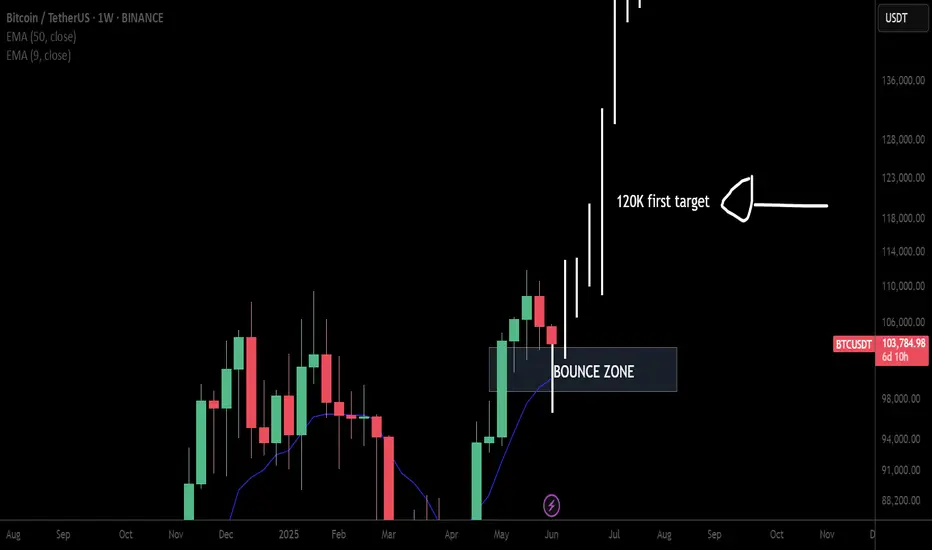
LONG BTCUSDT WEEKLY This is an overview of Bitcoin's movement for the beginning of next year on the weekly timeframe..."
BTC 4H Setup – OB Rejection or Launchpad? Bitcoin is currently ranging below a 4H Order Block (OB) and forming a potential higher low. With price holding above the key 0.618 fib zone (104.1k), this could act as a springboard for continuation — or a trap.
Key Levels:
Support: 104.1k–103.6k (fib cluster & mid-volume node)
Immediate Resistance: 105.1k (OB 4H)
Breakout Target: 107.1k
Fail-safe: 103.0k
Scenarios:
🟩 Bullish Path:
Hold 104k zone
Reclaim 105.1k OB = confirmation
Push toward 107.1k & higher liquidity sweep
🟥 Bearish Path:
Rejection from OB + break below 104k
Eyes on 103.0k as next bounce zone
Plan:
Long scalp above 104.2k if volume sustains
TP1: 105.1k (retest OB)
TP2: 107.1k
SL: Below 103.6k (tight invalidation)
📌 “OB rejection or flip? Market’s next impulse hinges on this 104k–105k squeeze.”

BTC Analysisfor here no trade zone, short from mentioned zone and keep the sl tight, I would prefer long from the 100k zone, if we get daily closing below the mentioned zone then will long from 92-90k area, target still remains the same 112k-120k
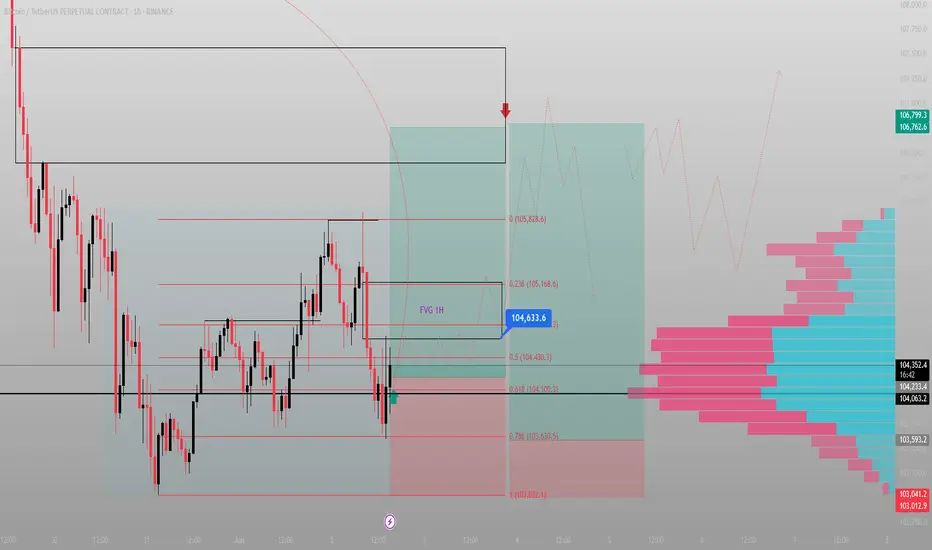
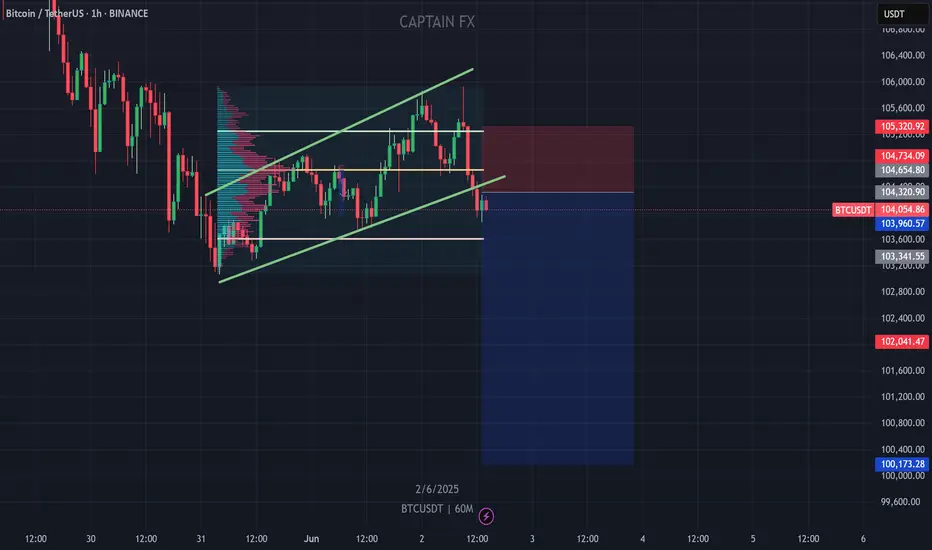
FVG re-entry or fail – this level decides the tone.Bitcoin tapped the 0.618 fib at ~$104,100 and front-ran the 1H demand zone. Now it's hovering at a decision point just beneath the 1H Fair Value Gap.
What to watch:
→ Price is pressing into FVG (104.4k–104.7k), aiming for acceptance.
→ Value area high sits at 104,275 – acting as pivot.
→ Break + hold above 104.7k? Clean path to 105.8k.
Plan:
Entry: 104.1k–104.3k
SL: below 103.6k
TP1: 104.9k
TP2: 105.8k (liquidity sweep)
Invalidation: Rejection from 104.7k = probable retest of 103k
Narrative flip potential:
Buyers are defending the mid-range + FVG. Breakout would shift market structure bullish on the lower timeframes.
"Acceptance above the gap = momentum reclaim."
$BTC not finished yetHey!
I'm still me, just a quick rebranding honoring my father.
CRYPTOCAP:BTC cycle is far from over. Not saying we bottomed yet. I think prices bewteen 96 - 102k could be reached on the upcoming days.
Althought this bearish momentum, we should encounter a goooood support level which would lead us to a great short absortion. If price holds those levels this week (maybe next too) there is a high chance we will see a new leg above the ATH level.
Im long here. Stay tuned
BTCUSDT 50k Here in the market, only take a sell trade. The weekly market has negative divergence so you can keep your 50,000 short position.
TradeCityPro | Bitcoin Daily Analysis #105👋 Welcome to TradeCity Pro!
Let’s dive into Bitcoin and key crypto indices. As usual, in this analysis, I’ll walk you through the triggers for the New York futures session.
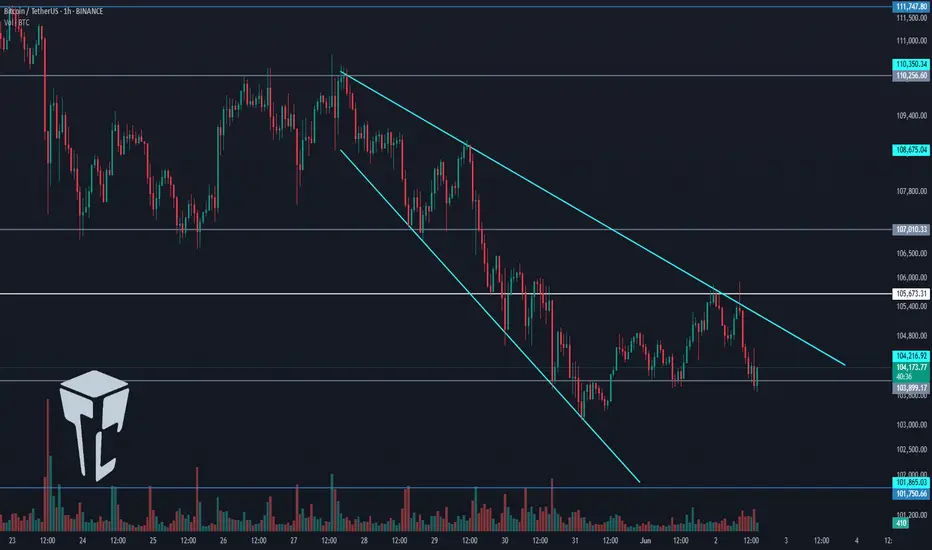
⏳ 1-Hour Timeframe
On the 1-hour chart, as you can see, Bitcoin’s correction phase began after the breakdown of the 107010 level. Currently, after pulling back to the 105673 area, it seems ready to begin its next corrective leg.
✔️ One of the reasons Bitcoin has moved downward over the past few days is the escalation of war between Ukraine and Russia. As the conflict intensified, risk assets like Bitcoin dropped while safe-haven assets like gold surged.
🔍 Currently, price action is forming an expanding triangle and is trending downward. It was recently rejected from the triangle’s top and is now sitting on a key support at 103899.
💥 If 103899 breaks, a short position targeting 101750 could be triggered. Selling volume has increased significantly, confirming bearish momentum, so opening a short upon a break of 103899 appears logical. However, keep in mind that the primary market trend remains bullish, and there is a high probability that any short may hit stop-loss.
📈 For a long position, the first trigger would be a breakout above the triangle. In this case, breaking 105673 could justify entry. Key overhead resistances are located at 107010 and 110256.
👑 BTC.D Analysis
Looking at Bitcoin dominance, the metric continued its upward move to reach 64.67 and has since been rejected from that level.
⚡️ If the bullish move continues, the breakout above 64.67 would act as a bullish trigger. On the other hand, a breakdown below 64.29 would confirm a bearish shift.
📅 Total2 Analysis
Total2 is currently ranging between 1.13 and 1.16. A breakout from either side could serve as a trigger for a directional position.
📊 If 1.13 breaks, a short position could be considered. Conversely, breaking above 1.16 would signal a potential long.
📅 USDT.D Analysis
After breaking above 4.70, USDT dominance has been ranging between 4.70 and 4.79. It’s now heading back toward the 4.79 resistance.
🧩 If 4.79 is broken, the next bullish leg in dominance may begin. A drop back below 4.70 would bring the dominance back into its previous range and could lead to further downside toward 4.49.
❌ Disclaimer ❌
Trading futures is highly risky and dangerous. If you're not an expert, these triggers may not be suitable for you. You should first learn risk and capital management. You can also use the educational content from this channel.
Finally, these triggers reflect my personal opinions on price action, and the market may move completely against this analysis. So, do your own research before opening any position.
BTCUSD SELL NOW TO 100K!!!!!!BTCUSD took out the POC level and also a strong SSL and also formed a bearish flag am looking forward to see price revisit 100k level for liquidity sweep or grab
WHATS YOUR VIEW ON THIS.............?
btc 4h chart Resistance Levels:
~104,570.96: This red line is currently acting as immediate resistance. The price has interacted with this level multiple times.
~107,000 - 107,800: The middle green shaded area (labeled "Fvg" which might stand for Fair Value Gap, often acting as S/R).
~109,500 - 110,500: The upper green shaded area.
~112,004.43: The yellow horizontal line, marking a previous significant high.
Support Levels:
~103,000 - 103,800: The lower green shaded area.
If the price breaks below the current level, the next potential support could be around the lows seen near 102,000 (though not explicitly marked with a line/box, it's a visible swing low area).

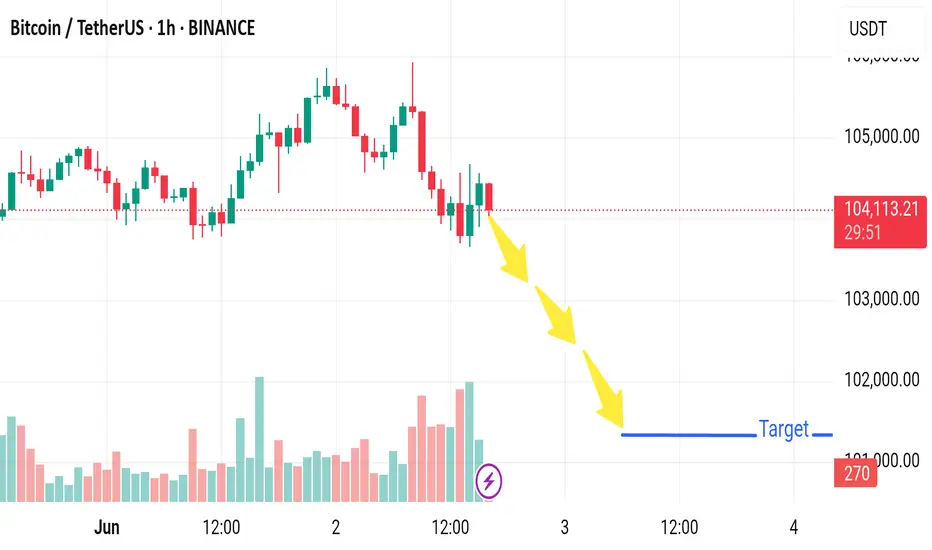
Short time, target 102.110Following daily chart.
I got a short signal from my power indicator.
TP1 102.110
TP2 99.923
SL close above 105.900 daily candle close.
Thoughts?
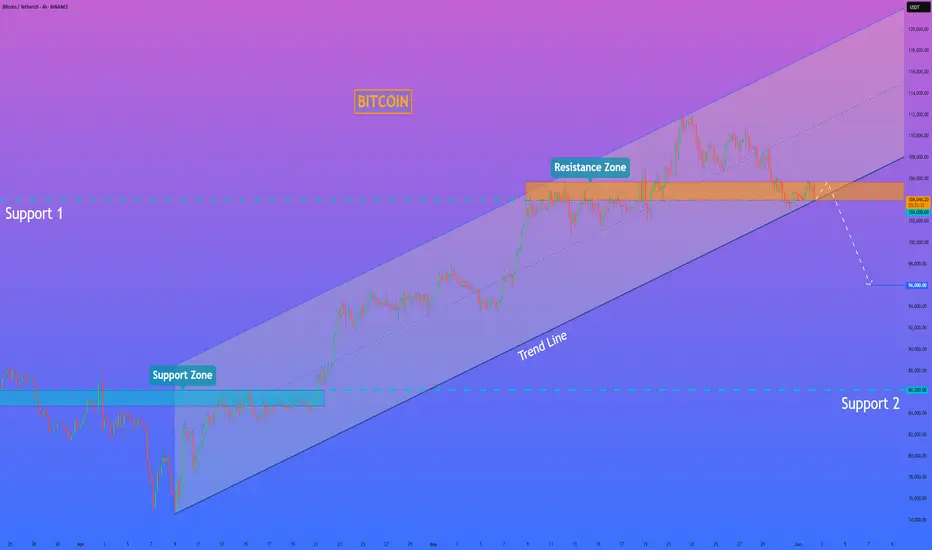
HelenP. I Bitcoin can exit break trend line and continue to fallHi folks today I'm prepared for you Bitcoin analytics. After looking at the chart, we can see how the price declined and broke support 2, which coincided with the support zone. Then the price rose to the support zone but turned around and dropped to the trend line. After this movement, BTC started to grow inside an upward channel, where it soon rose to support 2, which soon broke it and continued to move up. In the channel, price rose to support 1 and some time traded near this level. Later, BTC broke it and rose to the resistance line of the channel and turned around, and dropped to support 1. And at the moment, it traded inside the resistance zone, which coincided with the support level. So, I expect that BTCUSDT will break the support level, which coincides with the trend line, and continue to decline, thereby exiting from upward channel. That's why I set my goal at 96000 points. If you like my analytics you may support me with your like/comment ❤️