BTC: Both Scenarios Explained - Still BearishBTC: Both Scenarios Explained - Still Bearish
From our previous analysis, BTC fell by almost 2.7%.
Today the price stood again at 106K showing a slight upward momentum, but as we can see, everything disappeared.
The price created and corrected ABC with the current data and if this correction has already passed, it should fall further today. Otherwise, it may continue to rise and test 106K again.
You may watch the analysis for Further Details!
Thank you!
Previous analysis:
BTCUSDT.P trade ideas

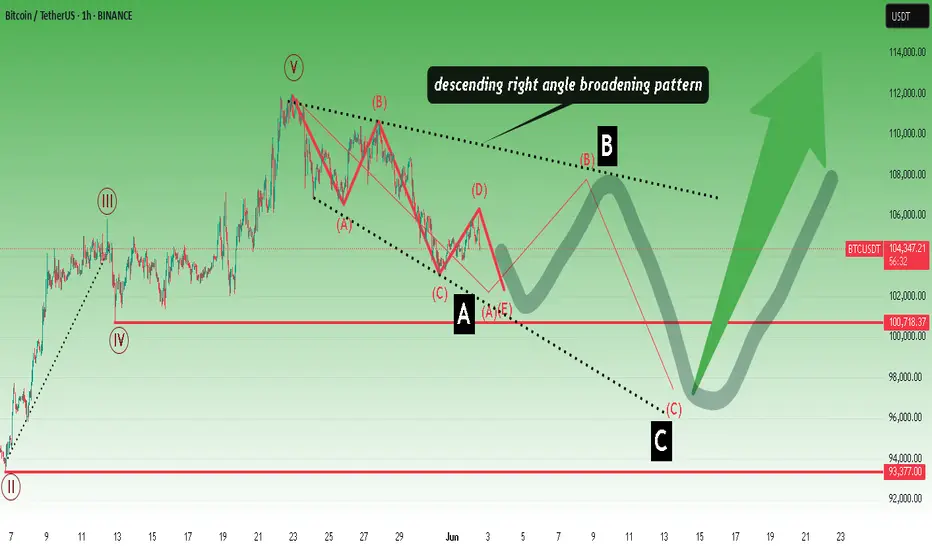
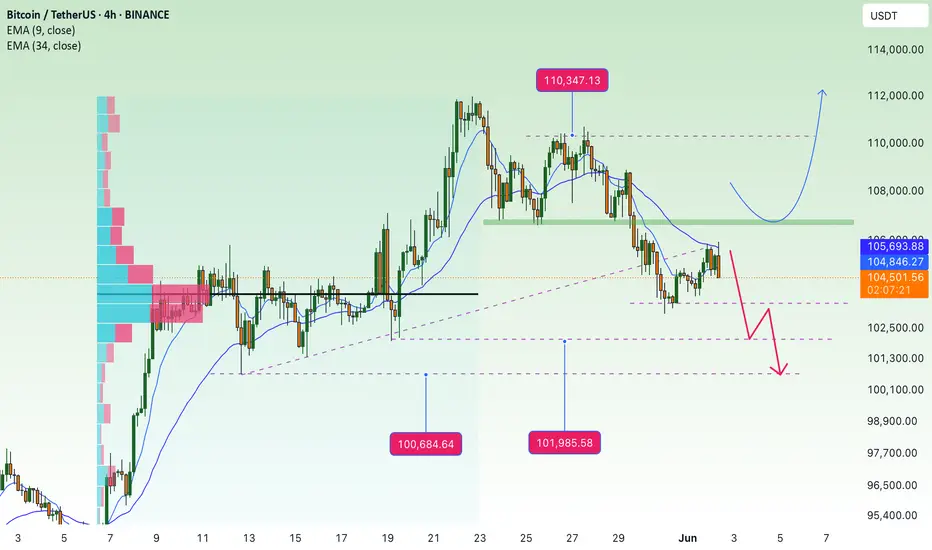
BTC: Overall trend is up, but short term in (4hr tf) BTC: Overall trend is up, but short term in (4hr tf) looks like a relief bounce within a bigger downtrend correction.
key zone to observe :
106k -107k - looking to short
target zone: 100k - 97k

Descending right angle broadening pattern.Descending right angle broadening pattern and ABC correction waves after 5.wave.
* The purpose of my graphic drawings is purely educational.
* What i write here is not an investment advice. Please do your own research before investing in any asset.
* Never take my personal opinions as investment advice, you may lose your money.
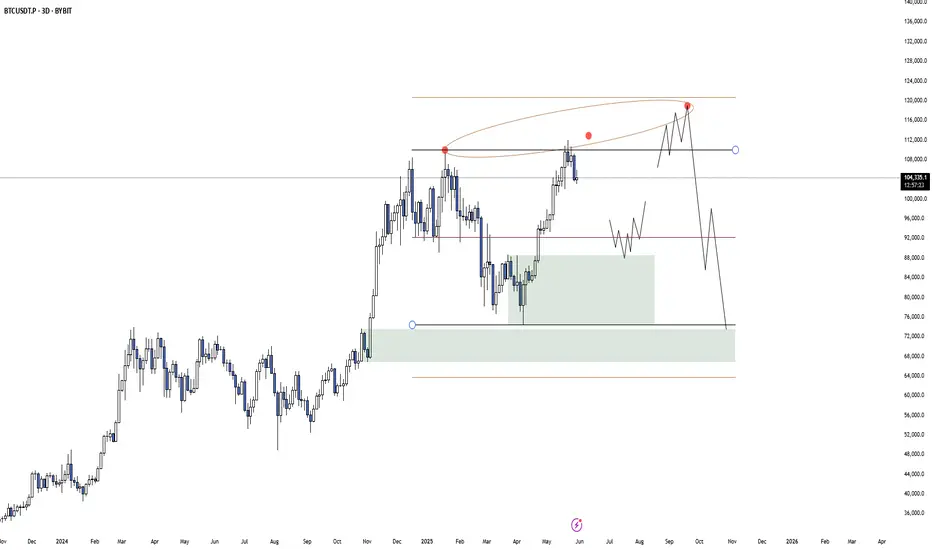
HTF BTC Distribution ScenarioIt's not my preferred scenario, but until BTC closes weekly candles above 121k this is on the table. This would take months to play out so i just wait and react accordingly.
BTC/USDT – Retest in Play After Breakdown!Bitcoin broke below its 4H ascending trendline and is now showing signs of a retest at the broken trendline zone.
It tried to break the immediate resistance of $105,100 but couldn't sustain it.
📉 Breakdown confirmed
Key Levels:
Resistance: $105,968 | $108,941
Support: $101,539 | $97,205
Bearish Target remains near $97K if rejection holds
Watch how the price reacts here — rejection could lead to further downside. A break back above $105K may invalidate the move.
#Bitcoin #BTCUSDT #CryptoTrading #TechnicalAnalysis #TrendlineBreak #Retest #BearishSetup #PriceAction

BTC/USDT 4-Hour Technical Analysis – June 2, 2025The current BTC/USDT setup on the 4-hour timeframe continues to reflect a bearish structure, characterized by consistent lower highs and lower lows, indicating sustained downward momentum.
The chart identifies a Sell Stop entry at $102,886.86, strategically placed just below a recent support level. This allows the short position to activate only if price confirms further bearish continuation.
The trade plan is defined as follows:
Sell Stop: $102,886.86
Stop Loss (SL): $106,060.00 – placed above the recent swing high for risk protection
Take Profit 1 (TP1): $100,146.42 – the first support zone where a bounce could occur
Take Profit 2 (TP2): $98,451.67 – targeting a deeper extension in the prevailing downtrend
The RSI Divergence Indicator shows a reading of 42.53, still above oversold territory but trending downward. Additionally, a prior bearish divergence is marked on the RSI, reinforcing downside expectations.
The overall analysis points to a continuation of the downtrend, with the market expected to break below key support if selling pressure persists. This trade setup offers a favorable risk-reward ratio, provided price action confirms the entry trigger.
Let me know if you'd like this idea

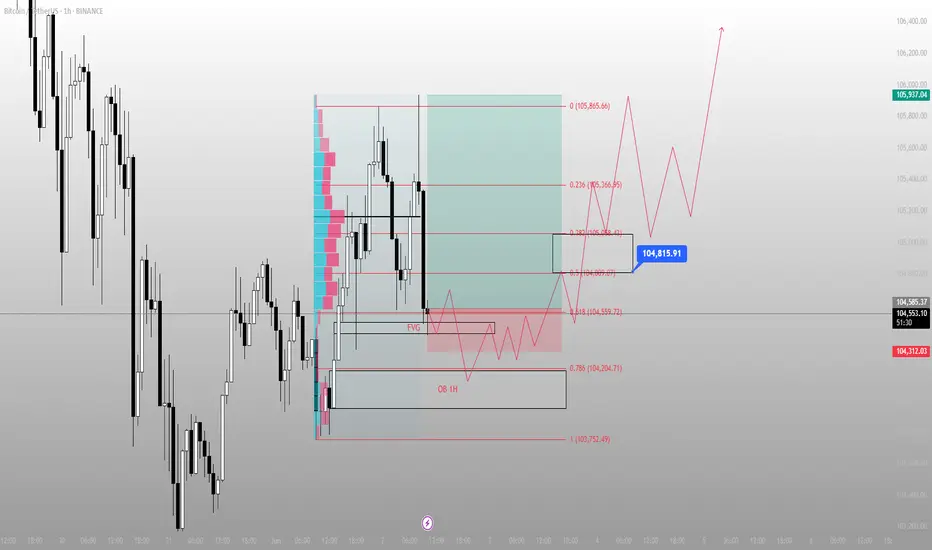
BTC didn’t dump — it tapped.BTC reached into the 1H FVG and wicked just above the OB at 104,204 — delivering premium liquidity and then reversing.
Most are staring at red candles, but the real story is the reaction zone:
Price tagged the 0.618 level (104,559) with precision and reversed with displacement.
Now what?
We're mid-delivery. If BTC can reclaim 104,800–105,000 (mid OB/FVG confluence), a strong move into 105,865 is likely — potentially sweeping for external liquidity near 106k.
Execution Plan:
Entry: 104,600–104,700 range
SL: 104,200 or beneath 103,752 swing
TP1: 105,365
TP2: 106,000+
Key invalidation: clean break below 104,200 with volume
Bias: Bullish while above 104,200
Why: Fair Value Gap fill + OB + 0.618 convergence + responsive wick
This wasn’t a sell-off.
This was a setup.
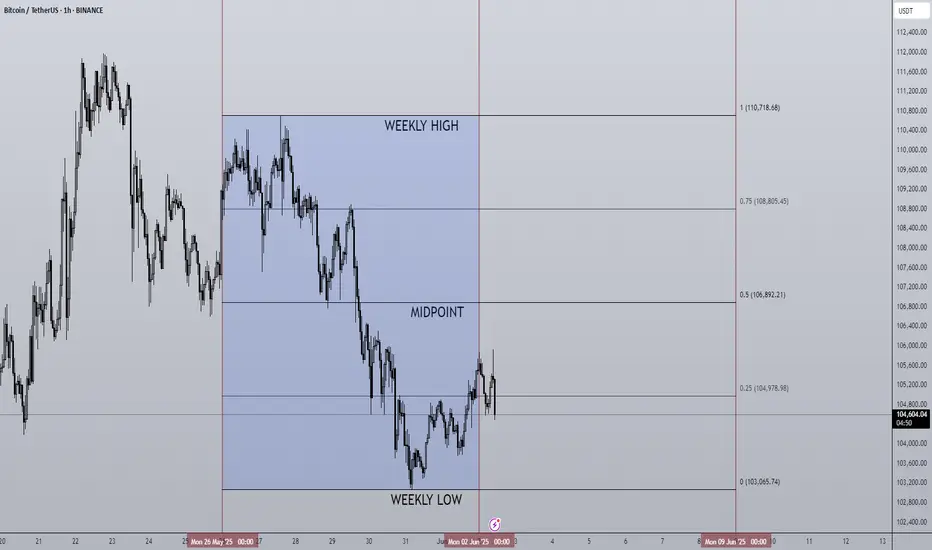
02/06/25 Weekly OutlookLast weeks high: $110,718.68
Last weeks low: $103,065.74
Midpoint: $106,892.21
As we approach the middle of the year, Bitcoin is back above $100,000 despite pulling back from a new ATH of $112,000. In the month of MAY BlackRocks ETF had record inflows of over $6B propelling prices 11% higher.
Last week we saw as the month closed and with that it's natural to have a window dressing period that usually leads to de-risking slightly. BTC stayed within the previous weeks range and maintains the pattern of:
Chop/consolidation --> expansion to the upside --> chop/consolidation...
However in this case the consolidation week had a much larger range than in the past which is a sign to me that the rally is exhausted for now. It's because of this I feel we may see a weekly low break for the first time in a month and get a more meaningful pullback than we've seen since early April. My target would be around the $97,000 area.
The case for the bulls is still a convincing one despite some red flags. Record ETF inflows continue to pour, M2 money supply continues to grow and a general shift to risk-on assets is clear. However these are longer term factors and just for this weeks outlook the momentum is with the bears briefly.
BTC short term correction: zone 100k💎 BTC PLAN UPDATE (June 2)
NOTABLE NEWS ABOUT BTC:
Meta shareholders have decisively voted down a proposal to explore adding Bitcoin to the company’s balance sheet, signaling limited appetite for crypto exposure at the tech giant.
According to a regulatory filing dated May 28, the “Bitcoin treasury assessment” proposal garnered just 3.92 million votes in favor — representing a mere 0.08% of total shares — while nearly 5 billion votes against it.
Given that CEO Mark Zuckerberg holds 61% of Meta's voting power, as disclosed in an April filing, it is likely he played a pivotal role in rejecting the measure.
TECHNICAL ANALYSIS PERSPECTIVE
Bitcoin closed below the daily support level of $106,406 on Thursday and fell another 1.50% the following day. However, prices saw a slight recovery over the weekend. As of Monday's writing, BTC is trading below $105,500.
Assuming BTC faces resistance around the $106,406 daily level and continues correcting, it could extend the decline to retest the psychologically important $100,000 mark.
The Relative Strength Index (RSI) on the daily chart is at 53, trending down toward the neutral level of 50, indicating weakening bullish momentum. The Moving Average Convergence Divergence (MACD) also showed a bearish crossover last week. The increasing red histogram bars below the baseline further signal a potential correction ahead.
At this point, whether you are new or experienced, it’s advised to spend more time practicing and enhancing your knowledge of technical analysis. Consider exploring educational posts on the channel (…) to strengthen your foundation and avoid losses during this period.
==> This is a trend-based analysis for reference only. Wishing all investors successful trades!
BTCUSDT: Strong Risk-On Signal, Optimal Swing Above 103k__________________________________________________________________________________
Strategic Summary
__________________________________________________________________________________
Global bias : Dominant bullish structure, confirmed sector momentum, “risk-on” technical setting.
Opportunities : Favored swing entries above supports (103703.7–107019.9), breakout plays at 104865/106537.
Risk zones : Technical invalidation below 103703.7 or rapid ISPD DIV deterioration (red/orange zone + extreme selling volumes).
Macro catalysts : Rate, inflation/PCE, job numbers publication (48–72h) – to monitor closely for volatility pivots.
Action plan : Tight stops below supports, partial profit-taking on resistances, reduce exposure before key macro events, re-enter post-announcement on confirmed direction.
__________________________________________________________________________________
Fundamental & Macro Analysis
__________________________________________________________________________________
Favorable macro momentum (BTC, ETH, equity indices, institutional trust). Bull-cycle confirmation via technical triggers (bullish cross, MACD divergence).
Risks : Major token unlocks coming (3.3B+), on-chain euphoria (extreme profit/loss, exchange dominance >33%). Dynamic risk management crucial – swing stop-loss < 103703.7 is imperative.
Events to watch : US rates, inflation/PCE, payroll data – periods of heightened volatility expected, necessitating exposure adjustment.
Swing trade plan : Defensive entries on key supports, reduction pre-announcement, gradual profit-taking below 106537, then 109952.8/111949.
Risk/reward : Optimal for swing trades near supports, tactical management required for breakout chasing.
__________________________________________________________________________________
Multi-Timeframe Analysis
__________________________________________________________________________________
1D (Daily) : Bullish structure intact, key supports (107019.9, 81075.6). Risk On / Risk Off Indicator remains “Strong Buy”. No excess in volumes or behavior – buyers’ climate.
12H – 6H : Solid momentum above 103703.7–106537. Risk On / Risk Off Indicator still “Strong Buy”, ISPD DIV neutral, standard volumes.
4H – 2H – 1H : Pivot range (103703.7/104865/106537), buyer momentum, swing/scalp strategies favored. Supports to watch: 103703.7 (main stop trigger).
30min – 15min : Tight range (103703.7/104865), Risk On / Risk Off Indicator “Buy” (slightly weaker on 15min). Tactical scalping on bounce or pivot breakouts – risk zone if range breaks sharply.
Summary : Sectoral outperformance on all timeframes via the Risk On / Risk Off Indicator, ISPD DIV neutral, normal volumes. Key pivots: 103703.7 (support) and 104865/106537 (resistances) frame all action. Swing trading optimality as long as these levels hold.
__________________________________________________________________________________
Conclusion
__________________________________________________________________________________
BTCUSDT market remains bullish on all timeframes, supported by strong sector momentum (Risk On / Risk Off Indicator), steady volume and behavioral stability (neutral ISPD DIV). Preference remains for long strategies on support, with increased vigilance around macro windows (events, unlocks). Strict stop discipline and active profit-taking are key on extension moves.
__________________________________________________________________________________
BTC Long Trade Setup IdeaTrade Setup Idea:
- Entry: 103,243.4 - 103,689.2
- Stop Loss (SL): 102,886.8
- Target Levels: 111.9K 116K, 121K, 127K, 131K, 140K

BTC — Choppy Range Until BreakoutPrice is caught between key levels:
• Support: $101.8k (4H demand)
• Resistance: $106.6k–107.1k (4H supply zone)
Current structure suggests range-bound price action with low conviction for directional trades until one of these levels is broken.
Plan:
🔁 Range: $101.8k–$106.6k
• Expect multiple drives and fakeouts
• Ideal zone for scalping only, take profits fast
• Avoid breakout anticipation — let the level break first
🚀 Breakout Scenario:
• Flip of $106.6k opens the path to new ATHs
• Break and hold above → long trigger to $110k+
📉 Breakdown Scenario:
• Loss of $101.8k leads to $100k–$98k zone
• Break below $100k = deeper market flush possible
📌 No big move expected until range resolves. Patience and precision are key.

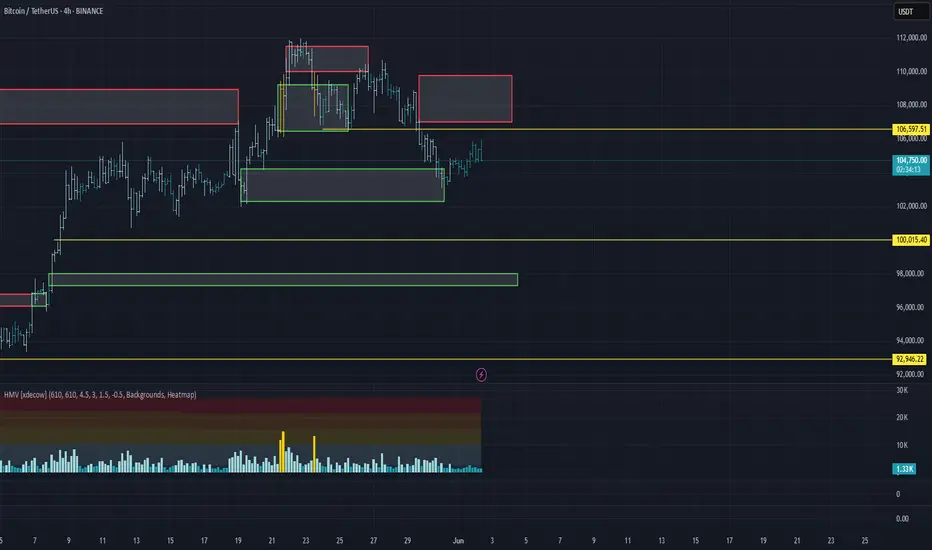
Market Overview
WHAT HAPPENED?
Despite the prevailing bullish trend, bitcoin failed to gain a foothold at the lower end of the sideways range. Instead, there was a breakdown downwards, which led to a shift of the accumulated volume in the short direction.
After that, the support zone of $104,200 – $102,300 (accumulated volumes) was tested, which was followed by the first positive reaction from buyers.
WHAT WILL HAPPEN: OR NOT?
It’s too early to talk about a full-fledged reversal and a resumption of the bullish trend. The resumption looks weak, both in terms of volume and momentum.
In the near future, we should expect a repeat test of the formed minimum. In the absence of a buyer's reaction, a rollback to the next area of interest is possible. An alternative scenario is the formation of a new sidewall between key levels:
– $104,200 – $102,300 (current accumulation zone),
– $107,000 – $109,800 (potential upper limit).
Sell zone:
$107,000–$109,800 (accumulated volume)
Buy zones:
$104,200–$102,300 (accumulated volume)
~$100,000 (initiating volume)
$98,000–$97,200 (local support)
Level at $93,000
$91,500–$90,000 (strong buying imbalance)
IMPORTANT DATES
The following macroeconomic events are expected this week:
• Monday, June 2, 13:45 (UTC) — the publication of the index of business activity in the US manufacturing sector for May;
• Monday, June 2, 14:00 (UTC) — publication of the ISM index of business activity in the US manufacturing sector for May;
• Monday, June 2, 17:00 (UTC) — speech by Fed Chairman Jerome Powell;
• Tuesday, June 3, 09:00 (UTC) — publication of the consumer price index for May and in comparison with May 2024 in the Eurozone;
• Tuesday, June 3, 14:00 (UTC) — publication of the number of open vacancies in the labor market (JOLTS) USA for April;
• Wednesday, June 4, 12:15 (UTC) — publication of changes in the number of people employed in the US non—agricultural sector for May from ADP;
• Wednesday, June 4, 13:45 (UTC) - publication of the index of business activity in the service sector (PMI) USA for May, as well as Canada's interest rate decisions;
• Wednesday, June 4, 14:00 (UTC) — publication of the US non—manufacturing purchasing managers' index for May from ISM;
• Thursday, June 5, 12:15 (UTC) - publication of the deposit rate, as well as interest rate decisions in the Eurozone;
• Thursday, June 5, 12:30 (UTC) — publication of the number of initial applications for unemployment benefits in the United States;
• Thursday, June 5, 12:45 (UTC) — press conference of the European Central Bank;
• Friday, June 6, 12:30 (UTC) — publication of the average hourly wage, changes in the number of people employed in the non-agricultural sector and the unemployment rate in the United States in May.
*This post is not a financial recommendation. Make decisions based on your own experience.
#analytics
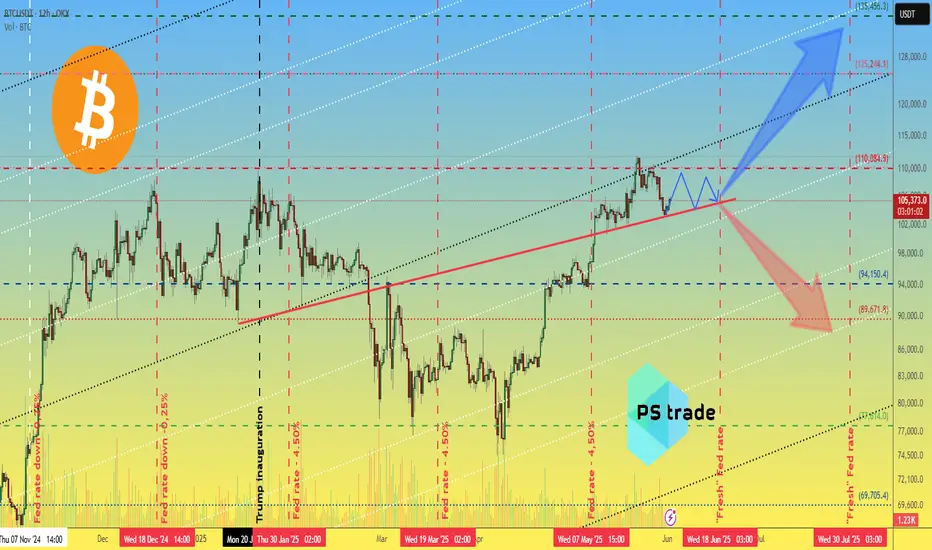
Bitcoin BTC price analysis🍿 At the OKX:BTCUSDT chart, we show one of the scenarios that could play out in the first half of June.
Much will be decided today with the opening of the US market. It is very likely that there will be a downward movement at the opening in response to the new tariffs announced by Trump on Friday after the markets closed.
🕯 Well, then we'll have to “keep our fingers crossed” that market players show their strength and hold on and buy back the drop — like say: we're tired of shaking with every crazy statement from Trump.
💰 If the price of CRYPTOCAP:BTC stays above $103k, there is a chance that it will be “stuck” in the $103-110k consolidation. The market needs to digest and redistribute the results of two months of #BTCUSD price growth from $75k to $112k.
And considering the position of the BTC.D and USDT.D indices, there is a chance that the “little bit” of capital will pass to the altcoins, and they will shoot up a little.
⁉️ Probably, the safest thing to do would be to watch the altcoins and buy only those that have started a significant upward movement with volume.
What do you think?
BTC/USDT 4-hour chartBTC/USDT 4-Hour Technical Analysis – June 2, 2025
The current BTC/USDT chart shows a clear downtrend pattern on the 4-hour timeframe. Price action has been forming lower highs and lower lows, indicating sustained bearish momentum. This is further supported by the RSI Divergence Indicator, which is showing bearish signals, confirming potential further downside.
A sell stop entry is marked at $105,795, suggesting a short position to be triggered only if the market continues downward and breaks support.
The trade setup includes:
Stop Loss (SL): $108,807 – just above recent highs to protect against unexpected reversals.
Take Profit 1 (TP1): $102,813 – aligning with a previous minor support zone.
Take Profit 2 (TP2): $99,985 – targeting a deeper move in the current bearish wave.
The RSI is hovering around 48.39, which still leaves room for more downside before reaching oversold territory, supporting the bearish outlook.
In summary, this setup reflects a continuation of the downward trend, with tight risk management and profit levels that align with historical price zones. Traders are advised to watch for confirmation of the sell trigger before entering.

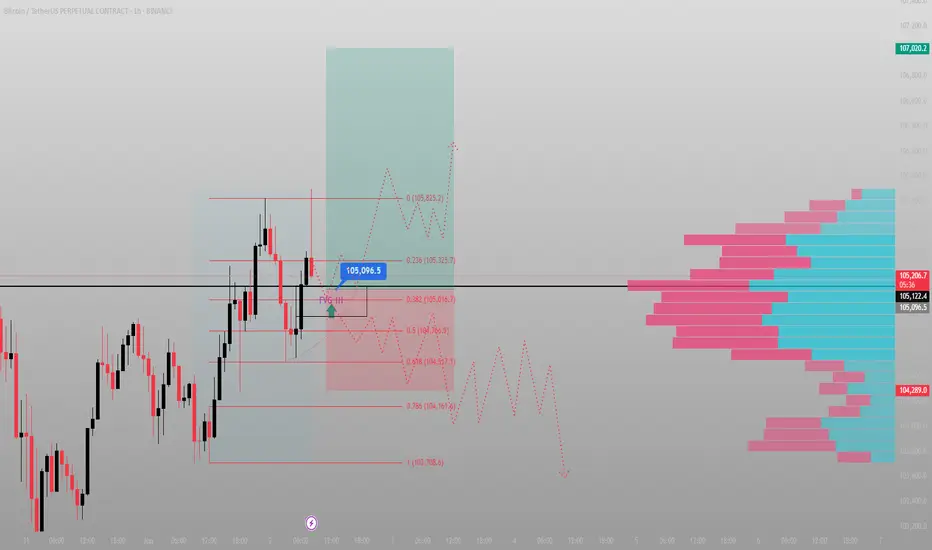
Most called rejection. I called reaccumulation — mid-trade.This wasn’t luck. It was structure.
BTC tapped directly into the 1H Fair Value Gap at 105,016 — precisely the overlap with 0.382 fib and the volume imbalance from the prior impulse. Price didn’t just react. It delivered confirmation. Fast.
Entry was clean, risk tight — and the invalidation was defined. Below 104,517, I’m out. No emotion. Just system.
I’m now watching the 105,325–105,825 pocket. That’s where the thin volume zone transitions back into resistance — and where trapped shorts begin to feel the heat.
If price breaks and holds above 105,900, expect a swift drive into 106.7–107.0 before further consolidation.
Execution clarity:
✅ Entry: FVG 1H — 105,016
🎯 TP1: 105,825
🔒 Stop: 104,517
🔓 R:R = 2.38, no drawdown, full intent
Most wait for confirmation.
I act at the point of imbalance — not after it’s obvious.
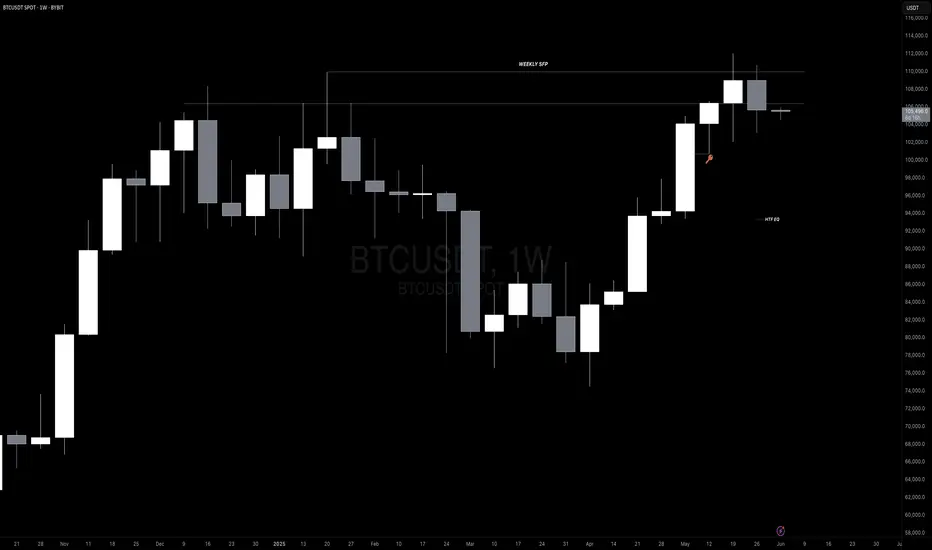
BTC (Post Weekly Close Update)CRYPTOCAP:BTC (Post Weekly Close Update)
We’ve confirmed a weekly SFP and observed a bearish engulfing weekly close, signaling caution at the very least. Whether the price corrects to our target, BOs here, or reaches a new ATH remains uncertain, so we’ll play it level by level. Imo, subtle signs of bullish exhaustion are worth noting.
That said, I don’t expect a collapse to 70K, though anything is possible. I anticipate a drop below the key 100K level, targeting the 18H HOB and weekly FVG around 98K. We could even see a wick into the CME gap, YO, and VRVP support observed at 94K. This move may spark fear, traders anticipating lower, with some calling for a bear market. However, I expect the price to reverse, reclaim key levels, and resume the uptrend.
On LTF/MTF - charts, we’re trading level by level. A range may form, allowing the market to gather liquidity to sustain the trend, especially since we missed liquidity at 72K. As long as the price remains below 107K, scalping makes more sense than swing trading in the short term. A break above 107K could target 110K or a new ATH. However, if the price reaches 107K - around 107800 - I’d consider shorting. A daily close above 107K might trap retail traders into opening longs, only for the price to retrace and head lower (keep this scenario in mind).
VELO data:
Market dynamics are stable. Spot is flat or selling, while perps are driving pric. OI has dropped from dangerous levels, and funding rates remain slightly positive. Overall, nothing significant is occurring, which aligns with the current range-bound market.
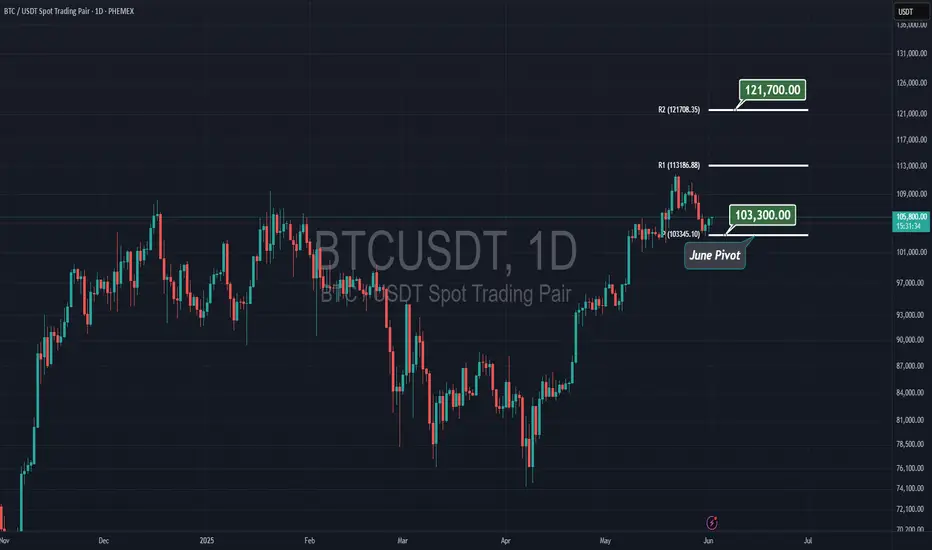
Bitcoin on JUNE's Pivot, $103kI believe $103,300 ( June's Pivot ) will hold bitcoin, and in few days we see a rally to the upside, and by the end of June, Bitcoin will reach to $121,700 which is the 2nd resistance for the pivot.
Long time no trade! Weekly Trade Outlook – BTC Focus
Monday Recap | 3PM GMT
Bitcoin remains in a global uptrend, but we’re currently sitting at the weekly range extreme — so caution is key. Internally, we've seen some bearish action, but price recently tapped into a clean 4H demand zone, showing a strong reaction.
Key question this week:
→ Can we reclaim 2H structure to make another push toward the top of the range?
Before that happens, keep in mind there's a 4H supply zone acting as resistance, so we’ll need to see how price reacts there.
While BTC navigates this structure, there are notable scalp opportunities setting up this week. All have been outlined in the setup — just remember:
Wait for confirmation before entering.
De-risk quickly when in profit.
Stay adaptive, especially around the midrange levels.
🎥 Video recap dropping later today — stay tuned.
Weekly Class Schedule
🕒 Monday – 3PM GMT
🕒 Tuesday – TBC
🕒 Friday – TBC

Lingrid | BTCUSDT All-Time High Level Retest Long SetupBINANCE:BTCUSDT is holding above the $103,500 support area after a textbook pullback from the higher high at the resistance ceiling. The price is respecting the upward channel and bouncing near the lower boundary, suggesting renewed bullish intent. A reclaim of the $106,000 zone could trigger continuation toward $111,800 within the broader target area. Bulls remain in control while price sustains above the upward trendline.
📈 Key Levels
Buy zone: 103,000–104,000
Buy trigger: 106,000 reclaim with volume
Target: 111,800
Sell trigger: clean break below 103,000
💡 Risks
Weak bullish follow-through above 106k may signal exhaustion
A breakdown below the channel support flips bias to bearish
Macroeconomic volatility could disrupt the technical setup
Traders, if you liked this idea or if you have your own opinion about it, write in the comments. I will be glad 👩💻

BTC - Hedge SetupWe’re currently in a bearish structure, but we've just formed a smaller bullish structure, and the B–C correction within it offered a solid opportunity for short-term long positions.
Once we reach the bullish target zone and the bearish trend reversal area, anyone with overexposed long positions can consider opening a short-term hedge — and move it to break-even once it’s in profit.
New week, new gains!
LFG

BTC Trendline Breakdown? Bearish Setup Brewing!📉 #Bitcoin has recently broken its key trendline after making a new All-Time High (ATH). This could be the first major sign of a trend reversal. Here’s what we’re seeing:
🔹 Trendline Broken: The uptrend has been broken — a significant technical signal.
🔹 Retesting the Break: Price is currently retesting the broken trendline, a classic move before continuation.
🔹 Triple Touch Confirmation: The trendline was respected with 3 clear touches during the uptrend — increasing the validity of this break.
🔹 Support Still Holding: We’re watching a major support level below — a break here would confirm bearish momentum.
🚨 Strategy Plan:
If the support level breaks and #BTC retests it as resistance, we’re planning a short position with strict risk management. Patience is key — wait for confirmation before entering!
🛡️ Risk Management First. Always.
Don't rush into a trade — wait for a clean breakdown and retest for a high-probability entry.
📊 What do you think? Is #BTC ready to reverse, or will the bulls defend the trend?
👇 Drop your thoughts in the comments.
❤️ Like this idea if it helped you.
✅ Follow for more #BTC setups and real-time updates!
#BTCUSD #Bitcoin #CryptoTrading #TrendlineBreak #ShortSetup #TechnicalAnalysis #BearishReversal #PriceAction #TradingStrategy

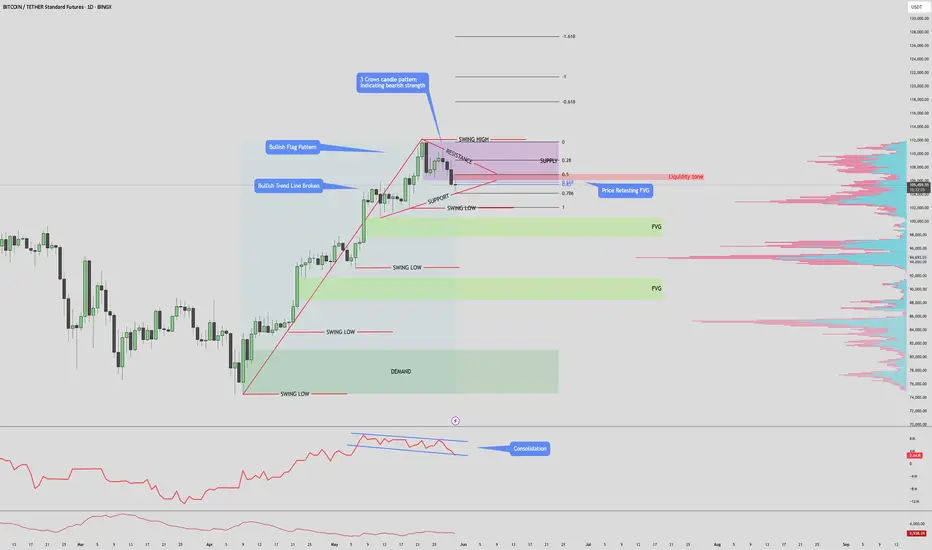
$BTC/TETHER Daily Time Frame new ATH incoming?Bitcoin Market Outlook
Bitcoin has stalled after printing new all-time highs, now consolidating within a **supply zone** while forming a **bullish flag pattern**. Price is currently testing the **Fibonacci golden pocket** region (0.618–0.65), a critical level for potential reversal or continuation.
A **\$71M liquidation cluster** is stacked around **\$107,000**, just above current price—making it a key magnet for upward movement.
Bullish Scenario
* If price breaks above the supply zone and clears the \$107K liquidation area, we can expect a push toward **flag resistance**.
* A confirmed breakout from the flag could trigger **continuation to new highs**, supported by low resistance overhead and momentum from short liquidation.
Bearish Scenario
* If price fails to hold the golden pocket and breaks below **\$102,000**, a drop toward **\$99,000** is likely.
* This level is reinforced by **two unfilled Fair Value Gaps (FVGs)**, which may act as magnets for price rebalancing before potential recovery.
Let me know if you notice anything wrong with this, or have some charts of your own!
Thank you for reading.