BTC - Some local POIsBTC on Binance or Bybit is not that Fib-friendly. CME is much better.
CME is closed over weekend, but here a quick local TA and 3 POIs.
Any question ? write it in comments ;)
Follow for more ideas/Signals.💲
Check out my previous TA/Signals which played out nicely. :)
Just donate some of your profit to Animal rights or other charity :)✌️
BTCUSDT.P trade ideas

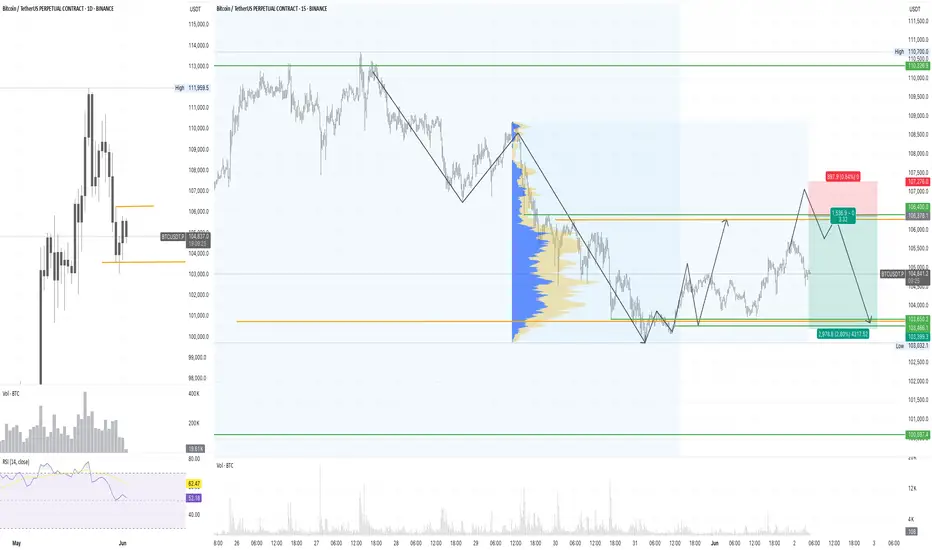
Short BTC1. Daily Bias (D1): SELL
D1 in downtrend
RSI weak (under 60)
Price under resistance (111.9)
✅ Bias: SELL confirmed
2. Market Structure (M15)
Price formed LH-LL
Current move = pullback to previous supply
✅ Structure supports short plan
3. Trap / SFP Zone
Expected trap near 107.2
Waiting for confirmation before selling
✅ Trap setup planned
4. Entry & Risk Plan (From Chart)
Entry: ~106,378
Stop Loss (SL): 107,276
Take Profit (TP): 103,399
Reward/Risk (R:R): ≈ 3:1
✅ Logical levels
✅ Good R:R
✅ Entry based on confirmation
Navigating a Projected 2025-28 Bear Cycle & Accumulation RoadmapFellow Traders,
This post outlines a conceptual Bitcoin bear market projection (2025-2028) and a phased accumulation strategy, based on synthesized market cycle data. (Inspired by external analyses).
I. Projected Bear Market Timeline:
Q4 2025: Euphoria Top (Potential 100k-120k)
Q1 2026: Bear Trigger (SPX correction, BTC < 60k)
Q4 2026: Capitulation (Crash towards $30k, miner selling)
Q2 2027: Extreme Fear & Bottom (Recession, BTC plunge to 18k-25k)
Q4 2027: Accumulation Begins (e.g., MVRV < 0.5)
Q1 2028 onwards: Slow Recovery (Halving anticipation)
II. Phased Accumulation Strategy:
A systematic buying approach across distinct price zones, triggered by on-chain/macro signals:
Early Accumulation (22k - 25k): 20% Allocation.
Triggers like MVRV < 0.85, high VIX.
Core Accumulation (18.5k - 20k): 50% Allocation.
Triggers like Hash Ribbons "Recovery," low funding rates.
Aggressive Accumulation (16.5k - 17.5k): 20% Allocation.
Triggers like Fed cuts, NUPL < -0.75.
Black Swan Buy (14k - 15k): 10% Allocation.
For extreme, unexpected negative events.
(Timelines for these phases roughly span Q4 2026 - Q3 2027)
III. Key Supporting Concepts:
Price Floor Models: Models like MVRV Z-Score (16.8k), Thermo Cap (17.2k), and Realized Price (21k) align with accumulation zones.
Bottom Confirmation: Watch for signals like MVRV < 0.75, aSOPR < 0.85 (est. Q2-Q3 2027).
Diversified Capital: Strategy suggests a broader allocation including BTC Spot (70%), Gold (15%), Cash (10%), and BTC Call Options (5%) for risk management.
Conclusion:
This conceptual framework suggests a long-term, disciplined approach to navigating a potential BTC downturn and subsequent accumulation. Patience, phased entry based on data (not emotion), and risk awareness are paramount.
This is a conceptual model, not financial advice. DYOR.

Bitcoin Market OutlookBitcoin Market Outlook
Bitcoin has stalled after printing new all-time highs, now consolidating within a **supply zone** while forming a **bullish flag pattern**. Price is currently testing the **Fibonacci golden pocket** region (0.618–0.65), a critical level for potential reversal or continuation.
A **\$71M liquidation cluster** is stacked around **\$107,000**, just above current price—making it a key magnet for upward movement.
Bullish Scenario
* If price breaks above the supply zone and clears the \$107K liquidation area, we can expect a push toward **flag resistance**.
* A confirmed breakout from the flag could trigger **continuation to new highs**, supported by low resistance overhead and momentum from short liquidation.
Bearish Scenario
* If price fails to hold the golden pocket and breaks below **\$102,000**, a drop toward **\$99,000** is likely.
* This level is reinforced by **two unfilled Fair Value Gaps (FVGs)**, which may act as magnets for price rebalancing before potential recovery.

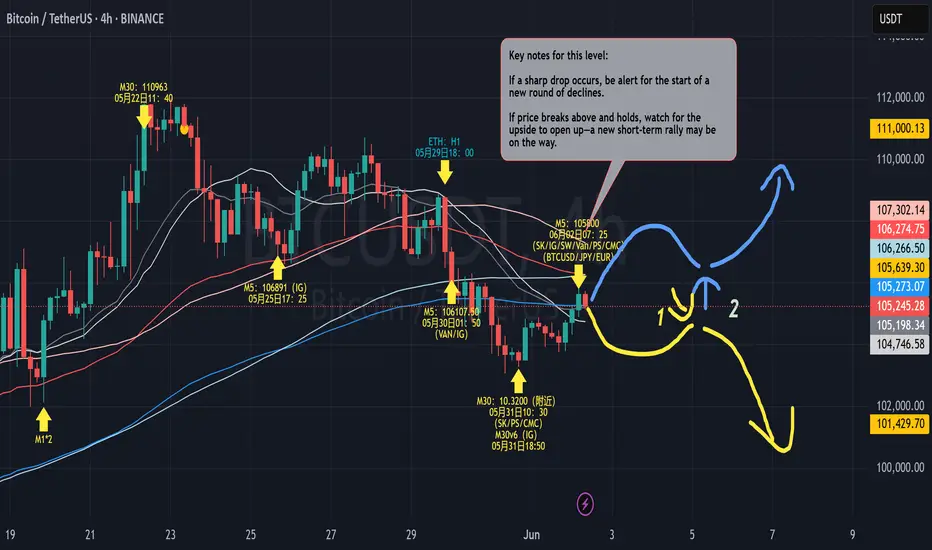
Key Market Turning PointThe market is now at a clear crossroads, with two distinct possible directions:
Yellow Path
If the current rebound loses steam and stalls around resistance, I will focus on the Point 1 area. As soon as a bearish signal emerges (e.g., price rejection, clear downtrend formation), I will start shorting in batches, aiming to catch the downward move. This is a “wait for confirmation, then act” approach—never betting blindly. Personally, I prefer this scenario, as there’s still significant overhead pressure and no obvious new bullish momentum.
Blue Path
If price breaks out strongly and holds above the key level, I’ll shift my focus to Point 2. I’ll wait for a clear bullish setup after a pullback, then go long with the new trend. But this is only my backup plan—not my main scenario for now.
My strategy in short:
Stay patient—don’t guess, don’t jump in early, only trade when there’s a clear signal.
Leaning bearish for now, but will quickly adapt if the market turns strong.
Position sizing and stops are always clear—never stubbornly hold a losing trade.
Often, the best trades come from simply waiting for confirmation, not from predicting the future. Good signals aren’t always present—patience and discipline are what make trading consistent over time.
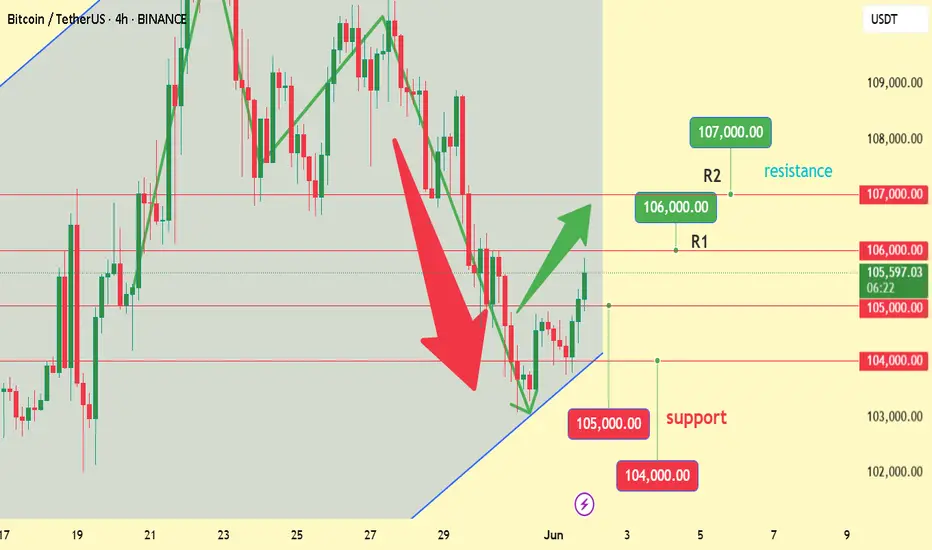
Today's BTC trading strategy, I hope it will be helpful to youSustained Capital Inflows
Increasing amounts of capital are flowing into the Bitcoin market. Large institutional investors with keen insights have been continuously buying Bitcoin, providing strong support for its price increase. To draw an analogy, the Bitcoin market is like a large reservoir—when new water continuously flows in, the water level naturally rises easily.
Technological Development Driving Growth
The blockchain technology behind Bitcoin continues to advance. Take the Lightning Network as an example: it has made Bitcoin transactions faster and reduced transaction fees, significantly enhancing the practical usability of Bitcoin. Technological advancements have increased Bitcoin's attractiveness, prompting more people to hold it, which in turn provides momentum for price increases.
Impact of Global Economic Conditions
The current global economy is unstable, with many countries implementing accommodative monetary policies. This has led to a continuous increase in the money supply in the market, causing the real purchasing power of currency to decline. Bitcoin has a fixed total supply (only 21 million coins), and its scarcity has become particularly valuable in this context. In such an environment, Bitcoin has become a choice for many people to preserve and increase the value of their assets. The increase in demand naturally tends to drive prices higher.
Today's BTC trading strategy, I hope it will be helpful to you
BTCUSDT BUY@104000~105000
SL:102000
TP:106000~107000
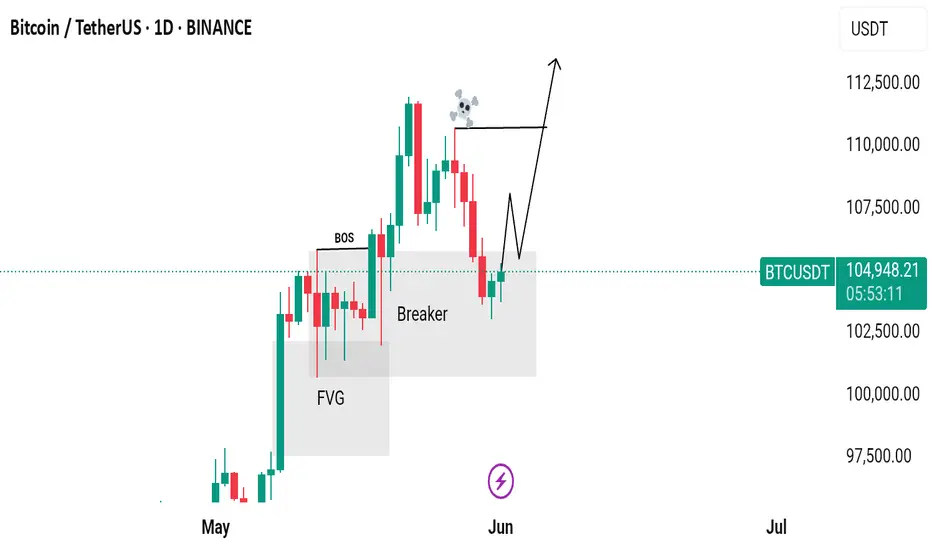
#Bitcoin Update 01.06.2025Despite last week's negative movement, my analysis shows that Bitcoin remains bullish. Let’s break this down step by step 🔍:
🚀 1. Deep Retracement Completed
Bitcoin has just completed a strong retracement and bounced back exactly from a key level – check Arrow #5. This is a major signal because the last time we saw such a deep retracement on the daily timeframe was back in April 2025… and that led to a significant rally. We may be witnessing the start of another strong leg upward 📊.
✅ 2. Reversal Confirmation Needed
However, theory always needs confirmation. The bullish confirmation will come when we see a clean breakout above Arrow #4. A break of this level will give us the green light 🚦 for a bullish continuation.
🔥 3. Break Arrow #2, and Sky Is the Limit
If the price manages to push above Arrow #4, it could easily break past Arrow #2, and from there, the next major resistance sits around \$114K – yes, you read that right! 🎯
⚠️ Bearish Scenario
On the flip side, the bearish confirmation will only come if Bitcoin breaks below the Arrow #6 black line (refer to my previous analysis for that key level). Until then, the bulls are still in control 💪.
💬 Stay focused, stay patient – the charts are telling a powerful story. We’re on the edge of a potential big move. Trade smart, and don’t get shaken out by noise.
🚨 More updates and levels coming soon – keep your eyes open!
#Crypto #BTC #Trading #BitcoinAnalysis #BullishOrBearish

Clearly we are forming a pattern here.We will soon swim above the water surface and see mass adoption by institutional, sovereign wealth funds, nations, as they become participants in the network.

BTCUSDT PERPETUALSwing position. Bought @103250.0 TP @110573.0
Looking at the dealers range from the image, it shows price is following a continuation long. price has pulled back back to extreme discount to take it higher.

BTC/USD next wave started. So this is my planBitcoin started the rally, and I'm expecting a bullish rally till 106700 range. Expecting a pull back. And re-entering again at the tip. Holding it till 107500

BTC - Ranges overview (update) Let's have a look at BTC as the new week is slowly settling and starting up.
We've traded back towards our opening week gap (blue box).
We are currently reacting nicely and holding it.
IF we break and get a clean close below it expect us to trade back towards 98K
IF we hold expect us to trade back towards new 100K and new all time highs.
As always...WAIT FOR THE MARKET TO SHOW YOU ITS HAND AND TRADE WITH IT.
Stay safe and never risk more than 1-5% of your capital per trade. The following analysis is merely a price action based analysis and does not constitute financial advice in any form.

BTC Crypto Analysis – June 1, 2025📉 BTC Crypto Analysis – June 1, 2025
🧠 Model Summaries
Grok/xAI
Price vs MAs: Below 20-day SMA (106,330), above 50-day (98,530) and 200-day (94,804) → short-term bearish in long-term uptrend.
Momentum/Volume: RSI neutral (52.9); MACD bearish divergence; declining weekly volume.
Bollinger Bands: Price hugging lower band (~101,478) → slight bearish pressure.
📌 Trade: Short 104,500 | SL 106,000 | TP 102,500 | Risk: 0.5% | RR 1:3 | Confidence: 78%
Claude/Anthropic
MAs/EMAs: Price below short-term MAs → corrective phase.
Momentum: RSI neutral, weakening MACD, price in lower BB range.
S/R Levels: Resistance ~106,041–106,330; Support ~101,478–98,530.
📌 Trade: Short 104,800 | SL 106,200 | TP 102,000 | Size: 0.5 BTC | Leverage: 50× | Confidence: 68%
Gemini/Google
📌 Trade (JSON only):
json
Copy
Edit
{ "entry": 104950, "sl": 106650, "tp": 102000, "size": 1.0, "confidence": 0.75 }
Llama/Meta
Technical: Price under short MAs, near lower BB, RSI neutral → moderately bearish.
📌 Trade: Short 104,500 | SL 107,000 | TP 101,000 | Risk: 0.01 BTC | Confidence: 80%
DeepSeek
Trend/Volatility: Below EMAs/MAs; widening BB → rising volatility.
📌 Trade: Short 104,950 | SL 107,000 | TP 99,800 | Size: 0.75 BTC | Risk: 1.5% | RR ~1:2.5 | Confidence: 78%
✅ Consensus Summary
Bias: ⚠️ Moderately Bearish
All models favor shorting BTC in the short term, despite longer-term uptrend.
Price below 20-day SMA and EMAs, momentum indicators weakening.
Support zone: 101,000–102,500; Resistance: 106,000–107,000 range.
Main Risks:
Counter-Trend Trap: Break above 20-day SMA could cause sharp rebound.
Volatility: Macro/crypto news may cause sudden spikes.
Execution: Limit orders suggested at open to avoid slippage.
Leverage: Moderate leverage preferred to avoid liquidation risks.
🧾 Recommended Trade Setup
🔻 Direction: Short
📈 Entry: 104,900
🛑 Stop Loss: 106,200 (above EMA/SMA cluster)
🎯 Take Profit: 102,000 (psychological + BB support zone)
📦 Size: 0.5 BTC
📊 Confidence: 75%
⏰ Entry Timing: Market Open
json
Copy
Edit
{
"instrument": "BTC",
"direction": "short",
"entry_price": 104900.0,
"stop_loss": 106200.0,
"take_profit": 102000.0,
"size": 0.5,
"confidence": 0.75,
"entry_timing": "market_open"
}

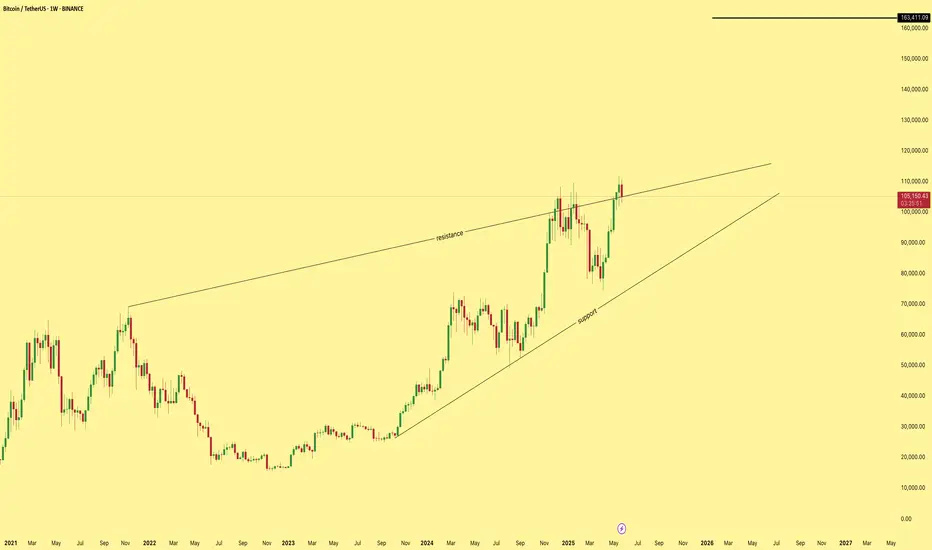
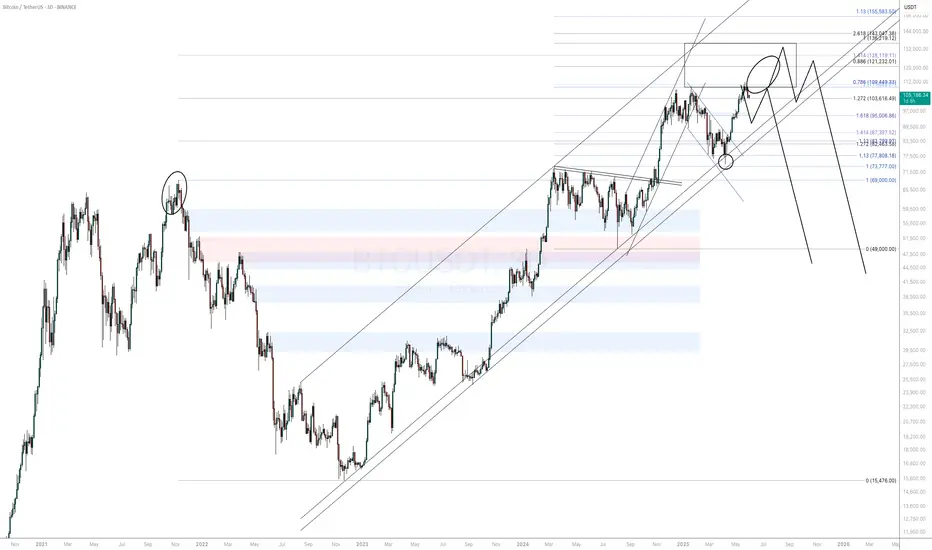
BTC/USDTI’ve been outlining this rising wedge pattern for a while now, but here’s the key difference this time: what was previously resistance has now flipped into support. That shift is a critical technical milestone a major test for Bitcoin’s price action.
Now, let’s talk scenarios:
• If this bearish wedge gets invalidated, we’re looking at a target of $163K—a massive breakout that aligns with broader market momentum.
• However, if it fails to hold, we risk breaking down into an M-formation, potentially dropping towards the $80K level.
This week is a decisive inflection point. Watch the previous resistance-now-support line closely. It’s also worth noting that the 4H 200MA aligns almost perfectly with this support level, adding confluence to this critical zone.
Bottom line:
We’re at a pivotal historical moment for Bitcoin, a true make-or-break situation. Stay sharp, stay nimble, and respect your risk management.
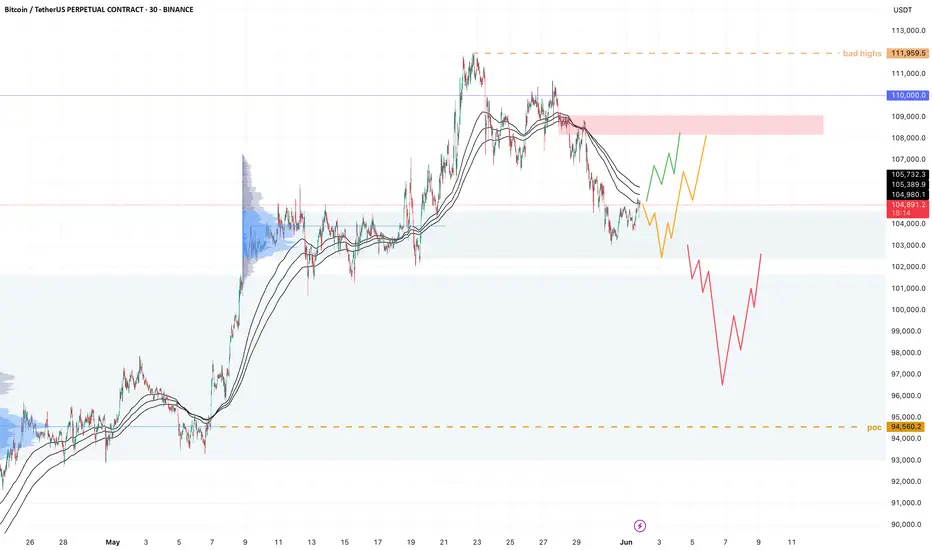
BTC - 3 plansWe lost H4 and daily trend, question is, is this a fake-out or are we in for a longer correction?
Only looking at 3 things here:
Immediately reclaim H4 trend, bounce into 108k.
Take out the Friday/weekend lows; that would set up a nice divergence and we can long into the same target.
If we lose current smol range value, I think we can get a deeper flush into 96-97k, maybe even take out the poc a bit lower. I think that would be a good buying opportunity if we get it, then long from there into either the same 108k target, hold some for potential sweep of the highs (or the moon of course)
BTCUSDT Price Analysis – Potential Drop Incoming! 🔲 Chart Zones
🟥 Resistance Zone (~111,000–112,000):
Price has touched this zone multiple times and failed to break higher – this is a strong resistance area. 🚫📈
🟪 Support Zone (~101,000–102,000):
A historically strong demand area where price previously bounced up. 💪📉
🔍 Current Price Behavior
📊 Price Level: Around 108,666.66
🔄 The chart shows lower highs forming, indicating weakening bullish momentum.
📉 Bearish projection drawn (blue zigzag line) suggests a potential double top forming below resistance.
📉 What’s Expected?
🔵 Big Drop Alert! ⬇️
If the price fails to break above and gets rejected again, the chart predicts a sharp move down toward the support zone.
🎯 Target Area: ~101,000–102,000 (Support zone)
📌 Summary
🧱 Resistance holding strong
💤 Momentum slowing down
⚠️ Bearish move likely
🏹 Targeting support zone for potential bounce
⚠️ Trading Tip 🧠
Watch for confirmation before entering trades! A break below the recent lows could trigger a short opportunity, while a bounce near support could offer a buy setup. 🛑📈

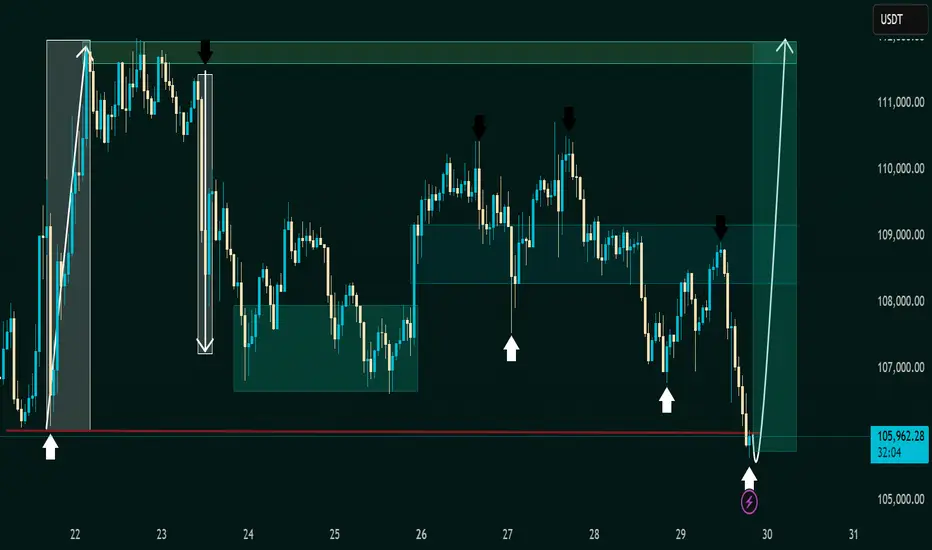
BTC/USDT – Bitcoin 1 hour timeframe 📊 Technical Overview
🟢 Support Zone:
📌 Around $105,700
🛡 Marked by multiple bounces (white arrows), this zone shows strong buyer interest.
🔁 Historically acts as a springboard for upside moves 📈.
🔴 Resistance Zone:
📌 Range: $109,000 – $111,500
🚫 Every approach has triggered a sharp sell-off (black arrows), confirming this zone as significant supply.
🔄 Price Action & Pattern Insights
📉 Bearish Swings from Resistance:
Several high-wick candles followed by strong rejections ⛔
Downward arrows suggest a distribution phase near the top range
📈 Bullish Reversal Signals:
Price sharply rebounds from support 💥
V-shaped recovery setup in motion with a clean reaction from the demand zone ✅
Arrow projection hints at a potential full range recovery 🌈
📦 Box Range Formation:
Market has been consolidating in horizontal zones
Each zone acts as a base for accumulation or distribution 🧭
🎯 Trade Idea & Forecast
📍 Current Price: $105,793.35
📈 Projected Move: Upside rally toward $111,000+
🧠 Rationale:
Bounce from a major support zone
Prior similar price actions led to parabolic rises 🚀
No lower lows made – signs of a bottom forming 🪙
📌 Action Plan
✅ Long Setup:
Entry: Above $106,000
Target: $109,000 – $111,500
Stop Loss: Below $105,000
📉 Risk/Reward: Favorable (~1:3)
🚫 Bearish Alternative:
Breakdown below $105,000 with volume ❗
Target: $103,000 (next liquidity zone)
📎 Conclusion: Ready for a Bullish Comeback?
Bitcoin (BTC/USDT) is showing signs of a textbook bullish reversal 📘 after defending a key demand level 💪. If the current momentum holds, we could see a swift move back to the top of the range. Ideal for short-term buyers looking to ride the intraday wave 🌊.
Can Potentially move upwards from here?Bitcoin just created an inducement and it has been hunted. Now the structure is also broken and the inducement is also taken out. The market is in a discount zone, and there's an overlap of a Breaker Block and FVG (Fair Value Gap), which indicates that the market can potentially move upwards from here.
Wait for bullish confirmations here, such as MSS (Market Structure Shift), CISD (Change in Character/Continuation of Internal Structure Dynamics), and failed selling PD Arrays!
Do Your Own Research (DYOR)! This is not financial advice.
Will it break the all-time high again?
Over the past week, the Bitcoin market has seen volatile trends, attracting widespread attention. In terms of price performance, Bitcoin carried forward the upward momentum from the previous week, opening at $103,500 and continuing its upward trend. On May 22nd, Bitcoin reached a high point, breaking through the $110,000 mark and hitting a record high of $112,000. Its market capitalization also surged to over $2.15 trillion, ranking among the top five global asset market capitalizations.
In terms of market capital flows, Bitcoin ETF products saw a total net outflow of up to $616 million on May 30th, with IBIT alone experiencing an outflow of $431 million, ending a consecutive 10-day net inflow trend. However, BlackRock's iShares Bitcoin ETF recorded a total net inflow of over $6.35 billion in May, with assets under management exceeding $71 billion, indicating that institutional investors maintain a long-term optimistic view of Bitcoin, and the short-term outflows are mostly profit-taking.
Humans need to breathe, and perfect trading is like breathing—maintaining flexibility without needing to trade every market swing. The secret to profitable trading lies in implementing simple rules: repeating simple tasks consistently and enforcing them strictly over the long term.
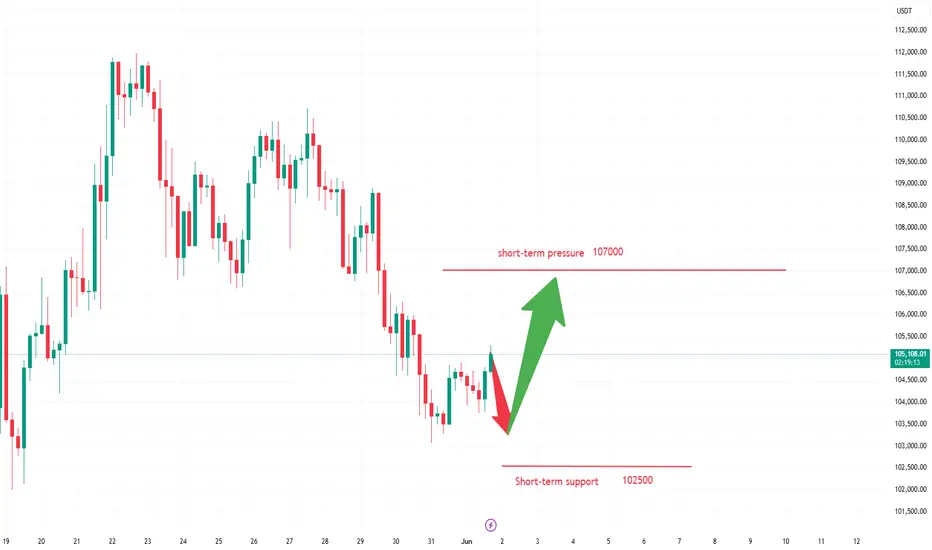
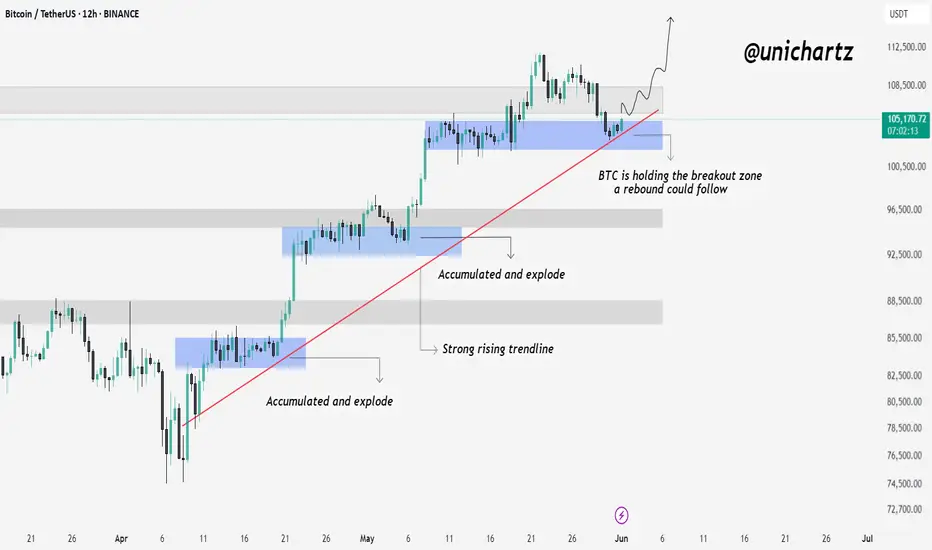
Bitcoin Retests Breakout Zone – Will It Bounce Again?Hello traders, here is the Quick CRYPTOCAP:BTC update
Bitcoin is currently holding right at the previous breakout zone, which also aligns with the rising trendline and previous accumulation area.
This zone has acted as a strong launchpad in the past — where BTC accumulated and exploded higher. If buyers defend this level again, we could see another rebound play out from here.
As long as BTC holds this structure, the bullish trend remains intact.
BTC/USDT – Tactical Bullish Consolidation__________________________________________________________________________________
Technical Overview – Summary Points
__________________________________________________________________________________
Momentum : STRONG BUY signal confirmed across all timeframes via the Risk On / Risk Off Indicator (stable green line, dominant bullish momentum).
Support & Resistance : Major multi-timeframe support at 104,000 USDT , with key resistance between 108,000–111,000 USDT .
Volume : No extreme spikes, below EMA – no panic-buy or selling climax detected.
Behavioral Indicators (ISPD) : Neutral sentiment across the board – no signs of overheating or capitulation.
__________________________________________________________________________________
Strategic Summary
__________________________________________________________________________________
Overall Bias : Bullish. Technical momentum is aligned with supportive macro drivers and resilient on-chain dynamics.
Trade Opportunities : Tactical buys on confirmed re-tests of 104k support; upside targets at 107k, 108k, with potential extension to 111k.
Risk / Invalidation : Strong rejection below 104k combined with fading Risk On / Risk Off Indicator → could trigger a flush toward 100k or even 94k–97k.
Macro Catalysts : US/China tensions (volatility), altcoin breakouts (risk appetite), on-chain data in euphoric phase.
Action Plan : Active monitoring, scalp bullish impulses, partial TPs under resistance, hedge on volume spikes to the downside.
__________________________________________________________________________________
Multi-Timeframe Analysis – BTC/USDT
__________________________________________________________________________________
1D : Consolidating below major resistance (108k–111k), with key support at 104k. Bullish momentum, neutral volume. Risk On / Risk Off Indicator : STRONG BUY .
12H : Technical rejection at 104k–108k clusters, firm support at 100k–104k. Momentum holds, no behavioral excess.
6H : Same price levels as higher TFs. Strong momentum and neutral sentiment, no anomalies detected.
4H : Bullish rebound off 104k, facing resistance at 108k+. STRONG BUY signal intact, normal volume.
2H : Support holding firm, bulls in control. No weakness observed.
1H : Price compressing within 104k–107k. Underlying bullish momentum remains solid.
30min : Consolidation under 105.5–107k resistance. Indicator remains bullish. No sign of capitulation.
15min : Repeated tests of 104k support, slight softening in signal but bullish bias remains.
__________________________________________________________________________________
Conclusion – Execution & Position Management
__________________________________________________________________________________
Directional Bias : Bullish. Constructive consolidation with strong sector momentum.
Key Levels : 104k (support) and 108k–111k (resistance).
Strategy : Buy dips on validated re-tests, scalp breakouts, swing above 108k.
Risk Triggers : Breakdown below 104k with volume spike, or bearish reversal in Risk On / Risk Off Indicator .
Watchlist : Unusual volume spikes, ISPD turning red, abrupt macro changes.
__________________________________________________________________________________
$BTCUSD Top SoonI believe CRYPTOCAP:BTC will reach maximum $124–128K—either earlier or, at the latest, by September–October 2025—before shifting into a bear market.
It has already enjoyed a 2.5-year bull run, during which the lower tier of coins, including ETH, failed to meet expectations; this time was different.
When the downturn begins, everything else will plunge to much deeper lower lows.
$BTC #Bitcoin is monthly and there is such a situation monthly.There is such a situation in CRYPTOCAP:BTC #Bitcoin weekly and monthly. I hope it doesn't work. If it works, there will be destruction in altcoins. There is no prediction right now. Everyone is expecting targets like 140k 250k. But I was here in the last double top but unfortunately it fell 15k. I hope they make a rally in altcoins before it works and then drop them. YTD. PLEASE TRADE AT YOUR OWN RISK.

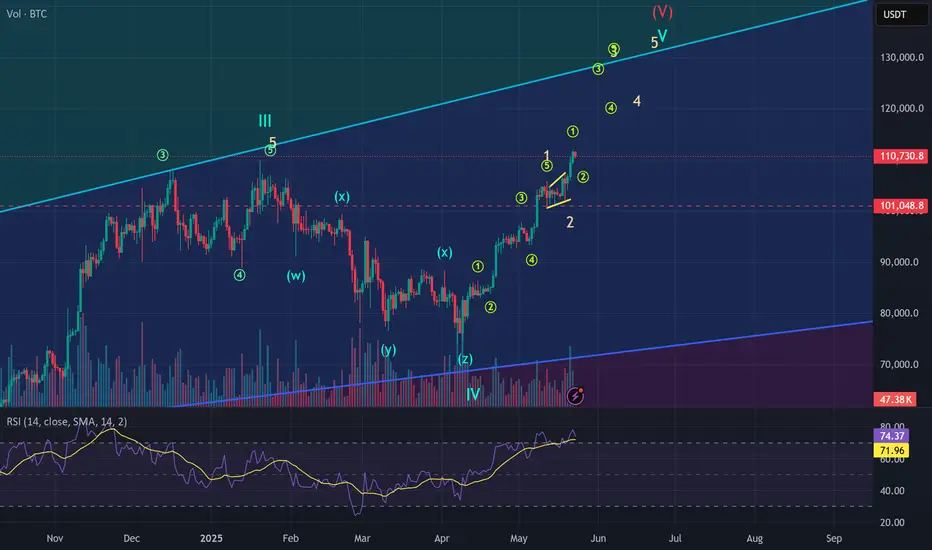
BTC Elliott wave analysis 5/23/2025For me , I think that the BTC price is on the way to their target price around 128,000-133,000 that we derive from Gann fann resistance.The wave structure suggest us that the impulse that create new high is just the beginning. The invalidate point is the point below wave 2 (around 101,000).