OG CYCLES - NOV 2025 - 2026 FEBOG CYCLE 1 - 132 300 - 155 200 / 2025 NOV - 2026 FEB
OG CYCLE 2 - 250 000 - 302 300 / 2027 Last cycle / Focus BTC only
BTCUSDT.P trade ideas

Bitcoin Monthly Outlook – Long-Term PerspectiveBitcoin Monthly Outlook – Long-Term Perspective
Regardless of the daily fundamental noise—ranging from institutional interest to global policy shifts—technical analysis also supports the possibility of further growth in Bitcoin over the long term.
Currently, Bitcoin remains in its primary bullish trend and is still moving within a rising channel structure.
Even if a pullback occurs toward the $39,000 level, the overall trend structure would remain intact, and the risk-to-reward ratio could still be considered favorable (approximately 4:1 in this context).
Of course, the market is driven by probabilities, and deeper corrections are always possible. However, both positive news and technical structure continue to signal a potential continuation of the upward movement.
📌 Based on this structure, key long-term support levels to watch are:
$70.000
$50,000
$40,000
📌 This analysis is for educational and informational purposes only and does not constitute financial advice.
📝 Follow for updates and long-term crypto insights.

BTC/USDT: Correction to H1 Demand Zone? Multi-Timeframe Strategy🔹 H1 Context (Bullish):
- Demand zone (green) below Fib 0.5: Key support.
- Breakout (BOS) suggests bullish continuation *after possible correction*.
🔹 M5/M15 Situation (Short-Term):
- Price rejecting red zones (immediate resistance).
- Scenario 1 (Bearish):
→ If price respects red zones: Correction toward H1 demand ($103K).
→ Action: Short trades in M5/M15 targeting green zone.
- Scenario 2 (Bullish):
→ If red zones break: Confirmation of strength (new highs target).
🔹 Risk Management:
- Short entries: Rejection at M5/M15 red zones + M1 confirmation.
- TP: M15 lows ($103.5K) or H1 demand zone ($103K).
- SL: Close above red zones.
🔹 Technical Key:
- H2 Order Block as dynamic support: If respected, prevents drop to H1.
- Confluence: H1 demand + Fib 0.5 = High-probability area.
#BTC #Bitcoin #Trading #Crypto #H1 #M15 #TechnicalAnalysis #Fibonacci


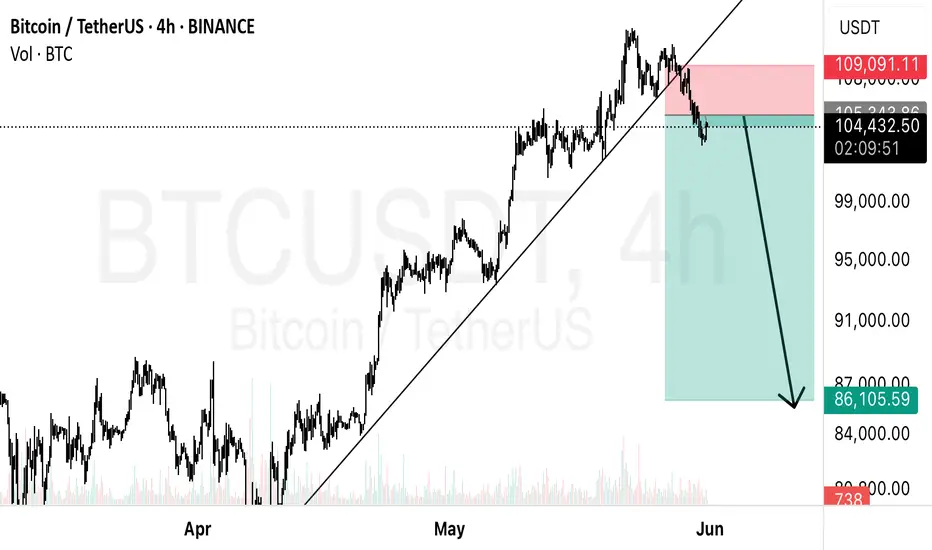
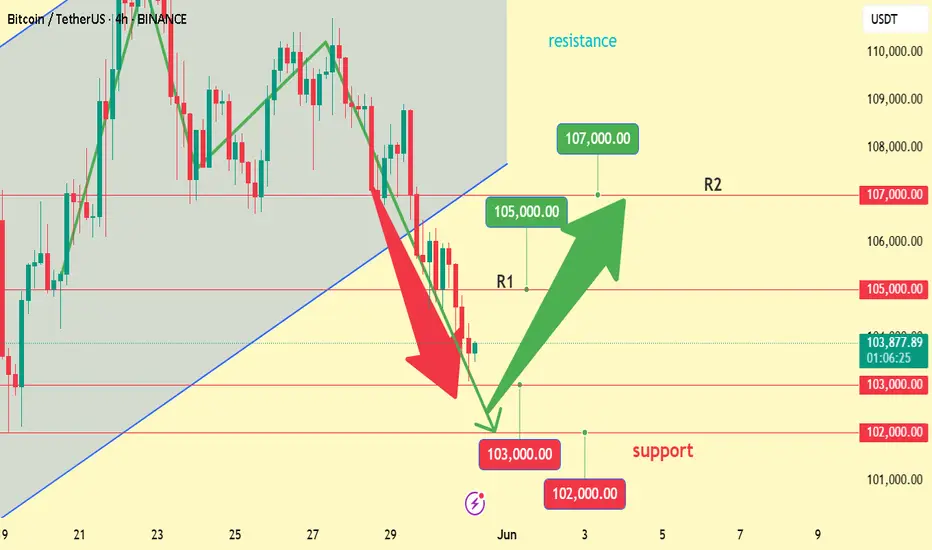
Bitcoin is nearing a critical breakout zone at $86,000Bitcoin is nearing a critical breakout zone at $86,000.
If this level breaks with strong momentum, we could see a rapid bullish continuation toward the major resistance area around $105,000. The ascending channel remains intact, and aggressive buying near support points to a strong upside setup.
From a fundamental view, Bitcoin is gaining strength as global uncertainty rises. The latest escalation of trade tariffs has disrupted traditional markets, pushing more investors toward alternative assets like Bitcoin. Historically, Bitcoin has performed strongly during times of economic instability.
Tightening monetary policies worldwide are fueling recession fears, making Bitcoin even more attractive as a hedge — the new "digital gold." With institutional interest growing, Bitcoin is well-positioned for a significant capital inflow.
Stay ready — the next big move is close! 🚀

Bitcoin - Ready to go but from lowerAfter breaking out of the marked range, Bitcoin retested the level but is now showing weakness in bullish momentum.
Although the price has broken above the high that created the last lower low, it did so without strong momentum, and is now pulling back.
🔍 We are watching the highlighted zones for potential bullish reactions.
In these areas, we will look for a confirmed long entry trigger.
⚠️ The lower the price drops—especially if it reaches the 4H Fair Value Gap (FVG)—the higher the reward-to-risk ratio for long setups.
Be patient and wait for confirmation before entering. ✅
🔍 Insight by ProfitaminFX
If this outlook aligns with your bias, or if you see it differently, feel free to share your perspective in the comments. Let’s grow together 📈

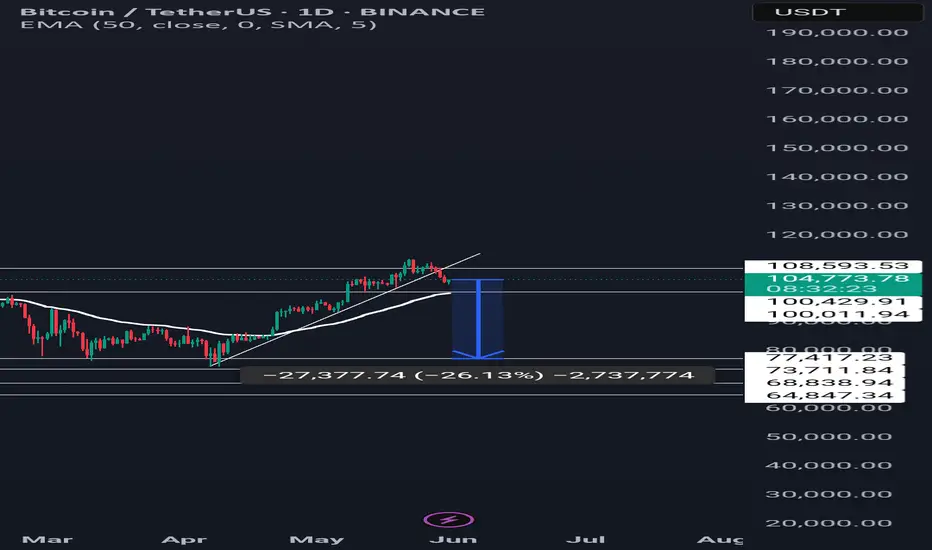
Bitcoin Tp1:50k Tp2:15kBe prepared for a heavy drop to 50k and you will all be liquidated. The market will repeat itself.
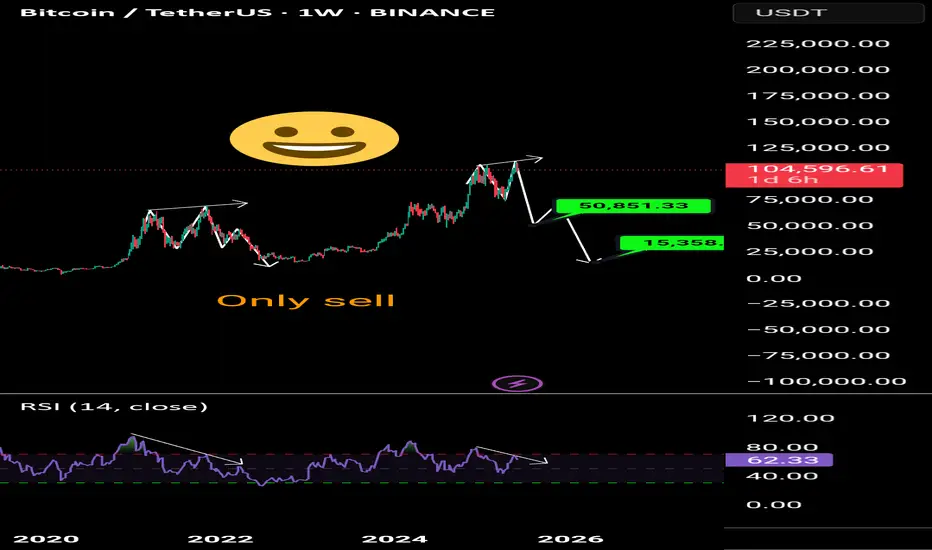
A trendlines break Simple trendlines break indicates we are now going down or sideways, and the last few days have showed we are dropping. Expect more of this until otherwise known
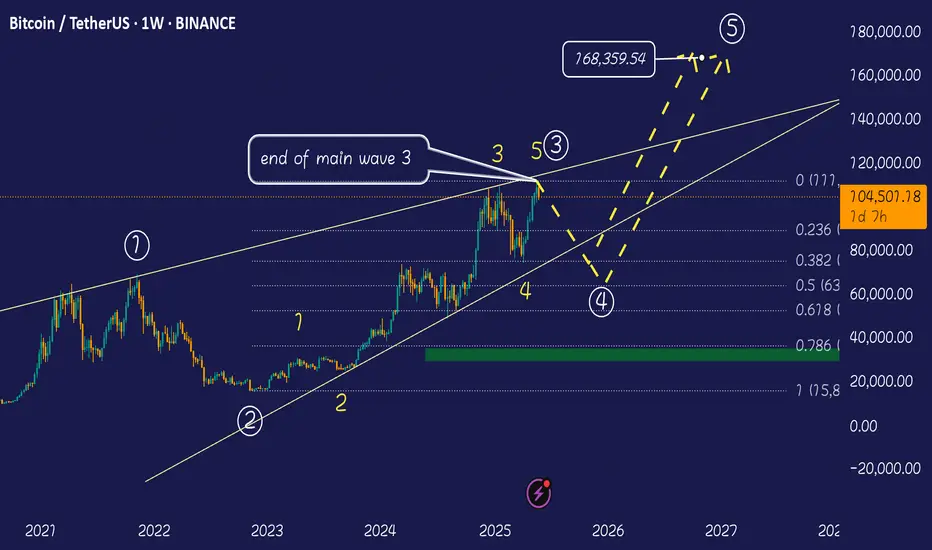
crash incoming, 70k or 80k It seems main wave 3 is completed with 112k . I think main wave 4 is stareted and price will fall to 80k at least.
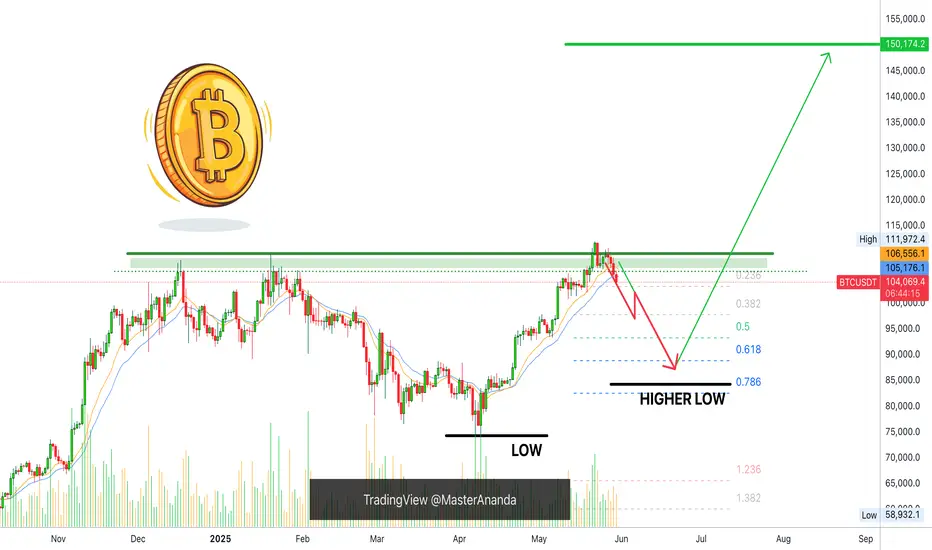
Bitcoin Bullish, Will Not Hit $200,000 This Cycle, $137,000 NextBitcoin is still bullish. A higher low is a bullish development. If Bitcoin stops bleeding at around a price of $88,888.88 this would be a strong, perfect, higher low compared to 7-April and it would match perfectly a classic correction because this price sits at the Fibonacci golden ratio.
Good afternoon my fellow Cryptocurrency trader, timing is important and we got perfect timing on this retrace. How far down will it go?
It is still too early to say but we know that below $74,500 isn't possible because that's the last low. $78,000 is possible but not necessary so we are betting that the lowest ever will be above $80,000. Remember, Bitcoin will never ever trade below $80,000 in its history. Sorry, but these prices are gone, nobody can buy this low again.
There is good news though. You can still buy when the next low is established.
It is impossible to predict the exact price when Bitcoin will stop dropping, but it is possible to see a support level being developed. So when the next support is in, we can cover (close the SHORT) and go LONG again.
Pretty simple. Buy when prices are low, sell when prices are high.
A new all-time high is pretty high and thus we sell (sold).
When the next support level is established, we buy again.
Thanks a lot for your continued support.
Each Altcoin needs to be considered individually because some will grow while others move down. We are more advanced now in this bull market cycle. You can visit my profile for more.
Namaste.
BTCUSDT.P | Multi Timeframe AnalyseHello to my dear friends.
Everything is told in the video.
Enjoy the trading fam.

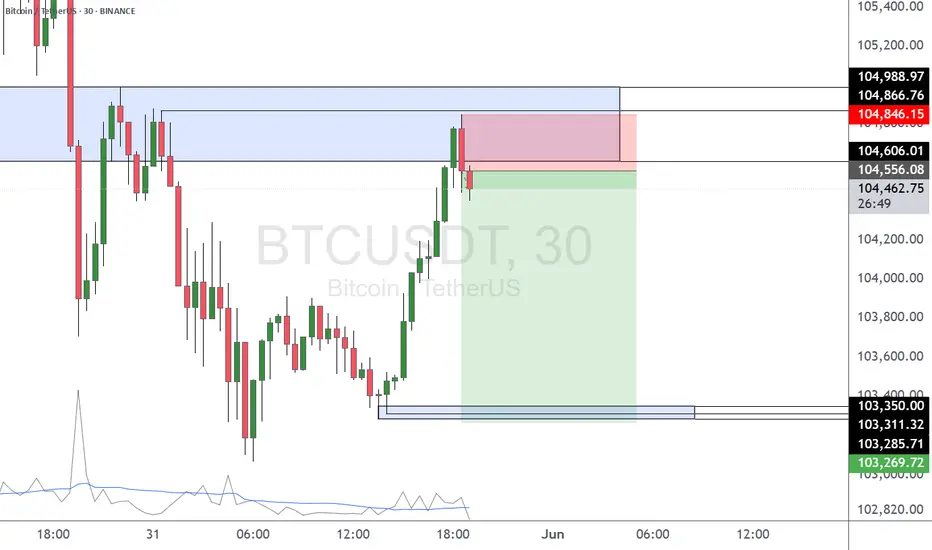
BTCUSDT – Clean short from supply zoneAfter a strong move up, BTC tapped straight into a clear 30m supply zone that previously led to a big drop. Price rejected pretty much instantly with a wick and no follow-through from buyers — that was my trigger to enter short.
I’m looking to play the move back into the demand zone around $103.3k – $103.2k, where we last saw strong buying.
Entry: $104,606
Stop: $104,846 (above the last high)
Target: $103,269
RRR: Around 3:1
Volume was drying up during the push into the zone — no real momentum behind the move. That’s usually a sign the second leg is weak, and it lined up well with the visual rejection.
If price breaks above and holds above the zone, I’ll be out. Until then, I’m leaning short while we stay below it.
Reasoning:
Clean structure
Weak bullish retrace into supply
Solid RRR
Compression → expansion setup
Let’s see how it plays out. Will update if anything changes.
Bitcoin short on LtfShort from 104600$ region.
Target 103500$.
Stop at around 105200$.
Lets see what happens during this weekend.

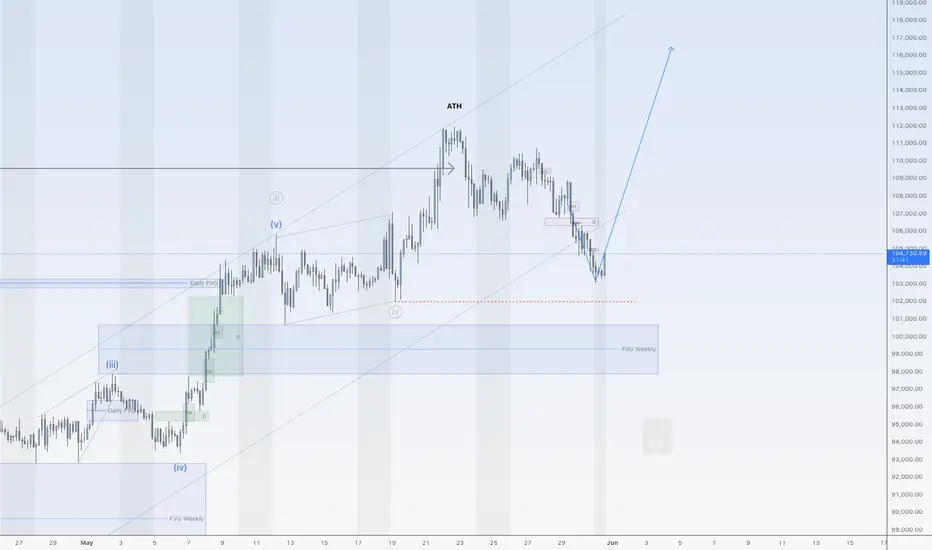
Bitcoin should go up nowHi traders,
Last week Bitcoin made a (bigger) correction down just as I've said in my outlook.
Now it should go up again from here (rejected from the bullish 4H FVG) for the wavecount to stay valid.
If price drops below the red dotted line, we could see a much bigger correction for Bitcoin.
Let's see what the market does and react.
Trade idea: Wait for a change in orderflow to bullish to trade longs again.
If you want to learn more about trading FVG's with wave analysis, please make sure to follow me.
This shared post is only my point of view on what could be the next move in this pair based on my analysis.
Don't be emotional, just trade your plan!
Eduwave
btc will go down its matter of time *Bitcoin Plummets: What's Behind the Sudden Decline?*
The cryptocurrency market is known for its volatility, and Bitcoin (BTC) is no exception. Recently, the price of Bitcoin has taken a significant hit, leaving investors wondering what's behind the sudden decline.
*What's happening?*
Over the past week, Bitcoin's price has dropped by over 10%, with the cryptocurrency's value falling from around $43,000 to $38,000. This decline has been accompanied by a decrease in trading volume and a surge in sell orders.
*Why is Bitcoin going down?*
Several factors are contributing to Bitcoin's decline:
1. *Regulatory uncertainty*: Increased scrutiny from governments and regulatory bodies has led to uncertainty among investors. Potential restrictions on cryptocurrency use and trading have spooked the market.
2. *Market correction*: After a significant price surge, Bitcoin's value was due for a correction. Investors are taking profits, leading to a decline in price.
3. *Global economic trends*: Rising inflation and interest rates have led to a shift in investor sentiment. Riskier assets like cryptocurrencies are being sold off in favor of more stable investments.
4. *Technical factors*: Some analysts point to technical indicators, such as the Relative Strength Index (RSI), which suggest the market is oversold.
*What's next?*
While it's difficult to predict the future price of Bitcoin, investors are watching key support levels. A break below $35,000 could lead to further declines, while a rebound above $40,000 could signal a recovery.
*Investor takeaways*
1. *Diversify*: Spread investments across asset classes to minimize risk.
2. *Stay informed*: Keep up-to-date with market news and trends.
3. *Set stop-losses*: Limit potential losses by setting stop-loss orders.
The cryptocurrency market is known for its unpredictability. As Bitcoin navigates this downturn, investors must stay vigilant and adapt to changing market conditions.
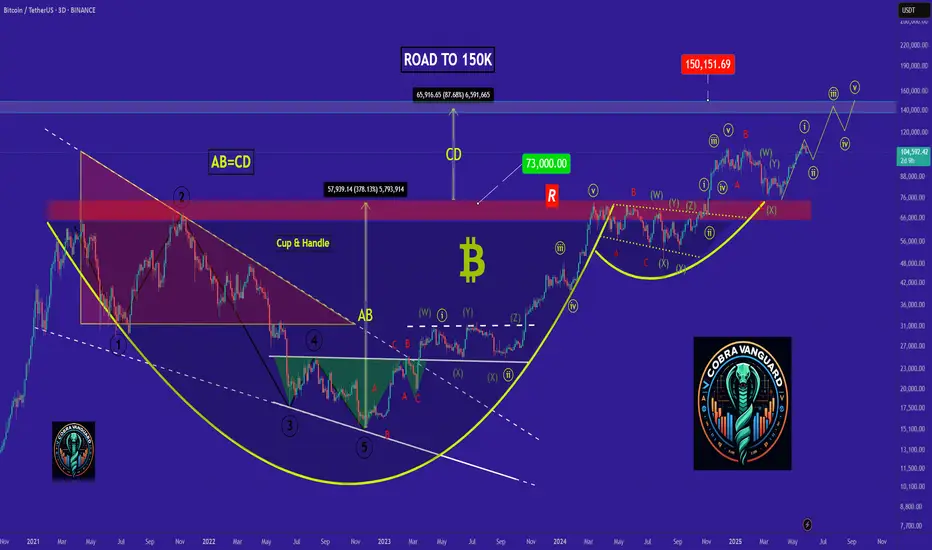
Maybe your biggest risk is your biggest chance !!!The price is currently forming the second corrective wave, and a slight price drop to reach higher levels is normal.
Give me some energy !!
✨We spend hours finding potential opportunities and writing useful ideas, we would be happy if you support us.
Best regards CobraVanguard.💚
_ _ _ _ __ _ _ _ _ _ _ _ _ _ _ _ _ _ _ _ _ _ _ _ _ _ _ _ _ _ _ _
✅Thank you, and for more ideas, hit ❤️Like❤️ and 🌟Follow🌟!
⚠️Things can change...
The markets are always changing and even with all these signals, the market changes tend to be strong and fast!!
BTC Correction - 50%After completing the impulse and falling out of the channel, Bitcoin most likely went into a correction
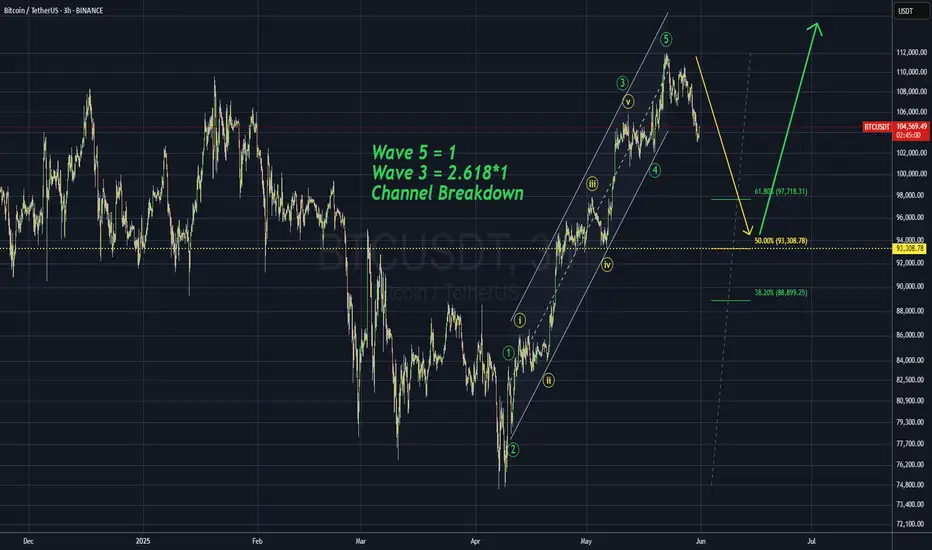
Abc PATTERNYesterday I was thinking in a Long at the short-term, today we have the confirmation of that movement. But still is not Long yet, we are still in a recession to take liquidity. I think the dip could be found between 101 and 97k. Be careful this days, the market maker is looking to take your money and he doesn't care if you are going long or short(High Volatility expected for next week)

Based on the image provided and general technical analysis princBased on the image provided and general technical analysis principles, here's an analysis of Bitcoin (BTC/USDT):
General Observation:
The chart shows Bitcoin on a daily timeframe, indicating a significant upward trend that has recently experienced a pullback. Fibonacci retracement levels are drawn, suggesting a potential area of support.
Key Price Levels from the Chart:
Recent High: Approximately $111,739.10 (where the Fibonacci retracement started from).
Current Price (as of image timestamp): Around $104,184.57 (with a bid/ask of 104,438.56 / 104,238.57 in the top left).
Fibonacci Retracement Levels (from the image):
0.382: ~$104,453.27
0.500: ~$102,464.45
0.618: ~$100,275.61
0.786: ~$97,159.35
Identified Support/Resistance (from the image and Fibonacci):
There appears to be a strong support zone around the 0.5 and 0.618 Fibonacci levels, roughly between $100,000 and $102,500.
The previous resistance around $106,860.87 (marked by a dashed blue line) could now act as potential resistance if the price bounces.
The target of the curved line is $111,859.55 by 2025-06-14, implying a potential retest of the recent highs.
Market Sentiment Indicators (from the image):
The "Total Buy Count" and "Total Sell Count" in the top left suggest order book depth or accumulated buy/sell orders, with more sell orders (104.438.56) than buy orders (104.238.57) at that exact moment, possibly indicating slight bearish pressure in the very short term.
Technical Analysis (Based on the image and general principles):
Uptrend and Pullback: Bitcoin has experienced a substantial rally, and the current price action indicates a healthy pullback within that uptrend. Pullbacks are normal and can provide opportunities for new entries.
Fibonacci Retracement: The price has pulled back to the 0.382 Fibonacci retracement level and is currently hovering around it.
0.382 ($104,453.27): This level is often a first strong support. The price is currently battling around this area.
0.500 ($102,464.45): If the 0.382 level doesn't hold, the 0.5 (50%) retracement is a crucial psychological and technical support level.
0.618 ($100,275.61): The "golden ratio" of Fibonacci, this level is considered a very strong support. A bounce from here would strongly confirm the bullish trend's continuation.
$100,000 Psychological Level: The $100,000 mark is a significant psychological support level that aligns closely with the 0.618 Fibonacci level, making that area a critical zone to watch.
Candlestick Patterns:
The recent daily candles show some bearish pressure, with red candles indicating selling. However, the wicks suggest buying interest at lower prices, which is a positive sign.
The candle ending on May 31, 2025 (the current candle) has a relatively long lower wick, indicating buyers stepped in when the price dipped.
Trendline/Channel: While not explicitly drawn as a channel, the overall movement since early May suggests an upward trend. The current pullback is testing the integrity of this trend.
Potential Scenarios:
Bullish Continuation: If Bitcoin finds strong support at or above the 0.5 or 0.618 Fibonacci levels and reverses with strong bullish candles and volume, it could confirm the continuation of the uptrend towards new highs, potentially retesting the $111,000-$112,000 area, as indicated by the projected curve.
Deeper Retracement: A break below the 0.618 Fibonacci level (and the $100,000 psychological mark) would be a bearish sign, potentially leading to a test of the 0.786 Fibonacci level around $97,159.35 or even lower.
Conclusion based on the image:
Bitcoin is currently undergoing a retracement after a strong rally. The price is at a critical juncture around the 0.382 Fibonacci retracement level. The key will be whether the price can find support at the current levels or if it will test deeper Fibonacci levels (0.5 or 0.618) before potentially resuming its upward trend towards the projected target of around $111,859.55 by mid-June 2025. Traders should watch for bullish reversal patterns and increasing buying volume at these support levels.

Today's BTC trading strategy, I hope it will be helpful to youBitcoin prices often find support from moving averages during pullbacks. When the price retreats to a key moving average (such as the 100-day moving average) and the average effectively supports the price, along with signs of stabilization like K-lines with long lower shadows or trading volume shrinking before expanding again, it presents a good opportunity to add long positions. This indicates that bullish momentum remains strong during the correction, as market participants are unwilling to let the price break below the key support level, making it likely that the upward trend will continue.
From a technical indicator perspective, both the MACD and KDJ indicators have issued potential bullish signals. When the DIF line in the MACD indicator crosses above the DEA line to form a "golden cross," and the histogram turns from green to red while gradually increasing, it strongly signals that bullish momentum is strengthening and prices have upward momentum. Additionally, when the KDJ indicator forms a golden cross at low levels (values below 20), it similarly suggests that prices may soon rebound. These technical indicators mutually confirm each other, providing a technical basis for opening long positions and helping investors better identify turning points in price trends.
Today's BTC trading strategy, I hope it will be helpful to you
BTCUSDT BUY@102000~103000
SL:101000
TP:105000~107000
Today's BTC trading strategy, I hope it will be helpful to youAgainst the backdrop of potential downward pressure on the global economy, central banks in many countries are highly likely to implement monetary easing policies. This trend will reduce the real yield of traditional currencies, prompting investors to seek better ways to preserve and increase asset value by turning their attention to Bitcoin. With a fixed total supply of 21 million, Bitcoin's scarcity makes its "digital gold" attribute increasingly prominent amid the wave of monetary easing. For example, after the 2008 global financial crisis, central banks around the world adopted quantitative easing policies, and Bitcoin experienced explosive growth in the following years, rising from near-zero to tens of thousands of dollars. If a new monetary easing cycle begins now, Bitcoin is expected to replicate its previous upward trend.
Large financial institutions are gradually shifting from a wait-and-see attitude to active participation in Bitcoin. Global renowned financial institutions such as BlackRock and Fidelity have already launched Bitcoin-related investment products, which not only provide ordinary investors with more channels to invest in Bitcoin but, more importantly, enhance market confidence in Bitcoin through professional endorsements and substantial capital inflows. Financial institutions typically conduct in-depth research and risk assessments before entering the market, and their participation signifies the growing recognition of Bitcoin in the financial sector. In the long run, this will continuously drive the price of Bitcoin higher.
Today's BTC trading strategy, I hope it will be helpful to you
BTCUSDT BUY@103000~104000
SL:101000
TP:105000~107000

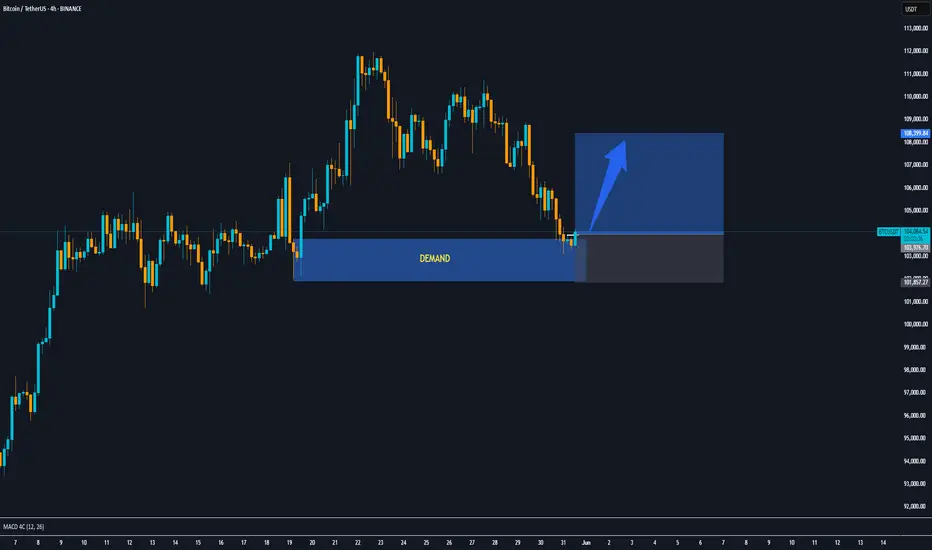
BTC H4 LONG SCENARIOBitcoin is in a 4-hour demand zone. You can enter long positions by getting confirmation from the 15-minute timeframe.
2025.05.25 Bitcoin Wave Count Extension (Refer to previous idea)We are the SeoVereign Trading Team.
With sharp insight and precise analysis, we regularly share trading ideas on Bitcoin and other major assets—always guided by structure, sentiment, and momentum.
🔔 Follow us to never miss a market update.
Please refer to the current Bitcoin wave count to better understand this analysis.
(Click the image to go to the idea.)
Typically, before breaking a major high, the market tends to absorb liquidity in the lower range by triggering stop-loss orders. The current movement appears to follow this classic corrective pattern.
In this zone, the Alt Bat harmonic pattern has been confirmed, and various technical indicators such as RSI and wave count are all supporting an upward move.
As I have consistently emphasized, I expect a strong bullish trend.
The short-term targets are as follows:
1st target: 107,761
2nd target: 108,082
3rd target: 108,398
