Bitcoin Chart Analysis – May 28, 2025We are the SeoVereign Trading Team.
With sharp insight and precise analysis, we regularly share trading ideas on Bitcoin and other major assets—always guided by structure, sentiment, and momentum.
🔔 Follow us to never miss a market update.'
--------------------------------------------------------------------------------------------------------
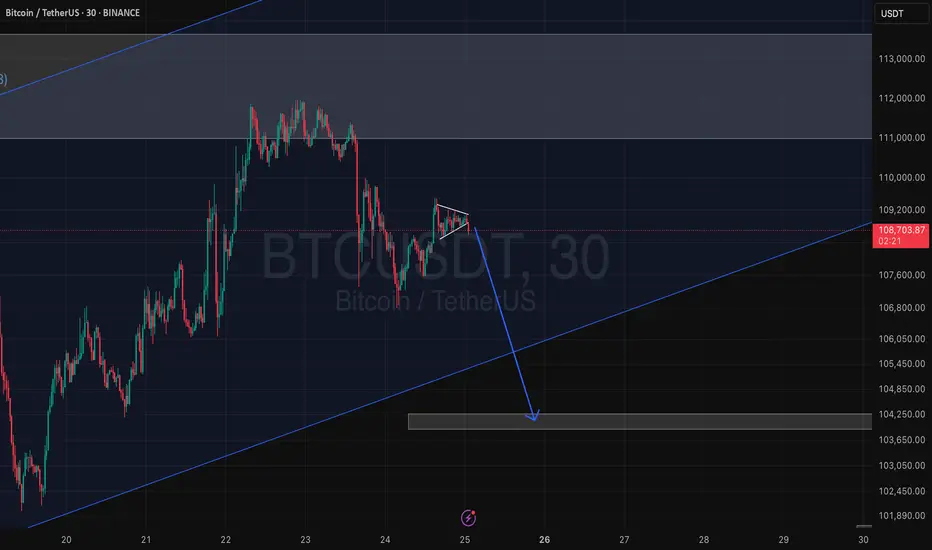
Currently, on the chart, it is clear that a harmonic pattern, specifically the Bat Pattern, has been formed. The Bat Pattern is interpreted as a strong reversal signal based on the ratio structure between highs and lows, and especially, a rebound in the PRZ (Potential Reversal Zone) area acts as a highly reliable entry signal.
In this case as well, a strong rebound has been observed after the price reached the PRZ zone, which can be seen as technical evidence supporting the validity of the pattern.
Also, according to the Elliott Wave Theory, the 5-wave structure has now been confirmed. This indicates that the final impulse wave of the 1-3-5 wave structure has been completed, and typically, after this phase, a corrective wave (ABC pattern) or the start of a larger fractal wave follows. However, since both the harmonic pattern and wave analysis simultaneously support an upward movement, it is judged that an additional upward trend is likely to unfold in the short term.
Therefore, the future price movement can be projected with the following three target levels:
1st Target: 108,247 – A short-term resistance level that needs to be monitored for price reaction.
2nd Target: 108,707 – This level overlaps with a previous high, and its breakout will serve as a criterion for determining trend continuation.
3rd Target: 109,167 – Set as a mid-term bullish target, and if the upward wave extends, this is a major resistance level with high potential to be reached.
In conclusion, entering at a zone where multiple technical indicators align tends to be a strategy with favorable risk-reward characteristics, and at this point, it is judged that the short-term outlook remains bullish. However, it is also emphasized that setting a stop-loss level and managing risk must be done concurrently.
BTCUSDT.P trade ideas

BTC BOUNCEBTC bounce on 1 hours chart.
After accumulation and manipulation, there is a good opportunity to catch the distribution stage.

BTC/USDT – Bullish Bias with Short-Term Accumulation Signals __________________________________________________________________________________
Technical Overview – Summary Points
__________________________________________________________________________________
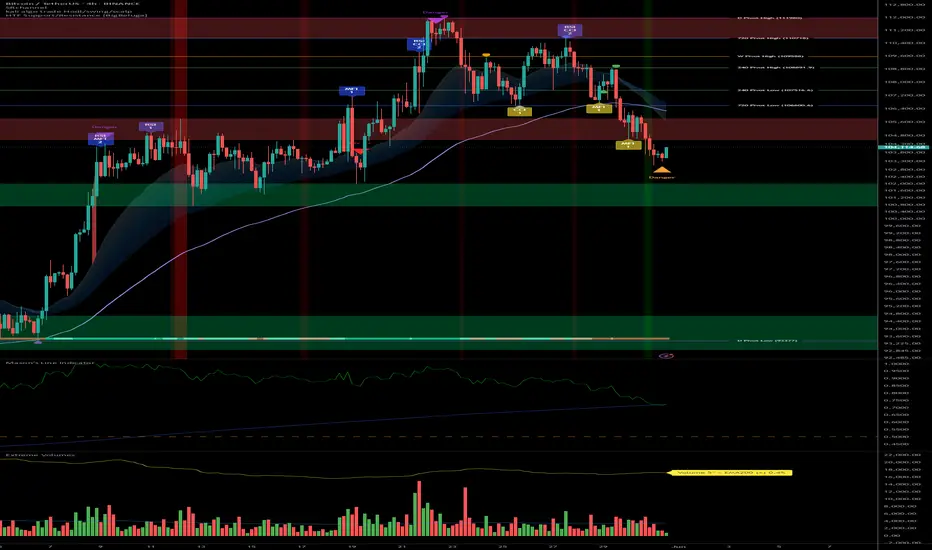
Momentum (Risk On / Risk Off Indicator): Persistent strong buy signal across all timeframes (1D to 15min), reflecting a sustained bullish bias and tech sector outperformance.
Support/Resistance Zones: Major support at 99.5–103k repeatedly tested across intraday charts; resistance cluster between 108–112k continues to act as a strong technical ceiling.
Behavioral Indicator (ISPD): Neutral on HTF (1D/12H), but shows buy signal on 1H–30min with strong accumulation patterns. Flat readings on other frames indicate no panic or euphoria.
Volume Profile: Normal volume across all timeframes, absence of climactic spikes or signs of local capitulation/euphoria.
Behavior Summary: Bullish structure remains intact, but market is at an inflection point. Short-term accumulation visible, especially below 104k.
__________________________________________________________________________________
Strategic Summary
__________________________________________________________________________________
Bias: Clearly bullish, supported by strong momentum and institutional flows into Bitcoin and the tech sector.
Opportunities: Tactical buy zone on retracements toward 99.5–103k. Intraday scalping possible with tight stops below 99.5k, targeting resistance zone at 108–112k.
Risk Zones: Break below 99.5k could trigger high-volatility liquidation down to 91k. Multiple resistance failures under 108–112k may prompt a sharp pullback.
Macro Catalysts: ETF inflows and equity risk-on backdrop boost technical signals. Lack of macro news shifts dominance to technicals and crypto narratives.
Execution Plan: Accumulate near 103k on dips. Manage trades actively under resistance. Avoid chasing breakouts without confirmation. Monitor ISPD for behavioral shifts.
__________________________________________________________________________________
Multi-Timeframe Analysis
__________________________________________________________________________________
1D – Macro Context
- Resistance: Strong cluster between 108–112k from daily/weekly pivots.
- Support: Long-term structural base down at 74–92k.
- Risk On / Risk Off Indicator: Strong Buy
- ISPD: Neutral – no extremes.
- Volume: Normal.
- Summary: Market is stretched above its macro base but retains strength; no acceleration or behavioral stress.
12H – Inflection Zone
- Resistance: 104–112k cluster.
- Support: Secondary pivots (240–720min).
- Risk On / Risk Off Indicator: Strong Buy
- ISPD: Neutral.
- Volume: Normal.
- Summary: At a decision zone; momentum intact, awaiting directional confirmation.
6H – Lateral Strength
- Resistance: 104–112k convergence.
- Support: 99.5k key.
- Risk On / Risk Off Indicator: Strong Buy
- ISPD: Neutral.
- Volume: Normal.
- Summary: Short-term consolidation inside a rising structure.
4H – Under Pressure
- Resistance: 108–112k confluence.
- Support: 99.5k.
- Risk On / Risk Off Indicator: Strong Buy
- ISPD: Neutral.
- Volume: Normal.
- Summary: Risk of false breakout. Tactical caution needed.
2H – Trading Range
- Resistance: 104–108k.
- Support: 99.5k.
- Risk On / Risk Off Indicator: Strong Buy
- ISPD: Neutral.
- Volume: Normal.
- Summary: Consider tactical entries near range base; no seller climax detected.
1H – Emerging Reversal
- Resistance: 108–112k.
- Support: 103k, 99.5k.
- Risk On / Risk Off Indicator: Strong Buy
- ISPD: Buy – signal of behavioral accumulation.
- Volume: Normal.
- Summary: Signs of reversal from bearish accumulation; watch for confirmation above 104k.
30min – Low-Risk Entry Setup
- Resistance: 105k–108k.
- Support: 103k.
- Risk On / Risk Off Indicator: Strong Buy
- ISPD: Buy – strong behavioral signal.
- Volume: Normal.
- Summary: Contrarian long setups favored; tight stop strategy under 103k.
15min – Caution on Fade
- Range: 103–105k.
- Risk On / Risk Off Indicator: Buy.
- ISPD: Neutral.
- Volume: Calm.
- Summary: Market in cleansing phase; scalps possible, but avoid overconfidence due to short-term softness.
BTCUSDTThe price drop will repeat.
Divergences have formed like last time.
Be careful. I will inform you again after confirming this scenario.
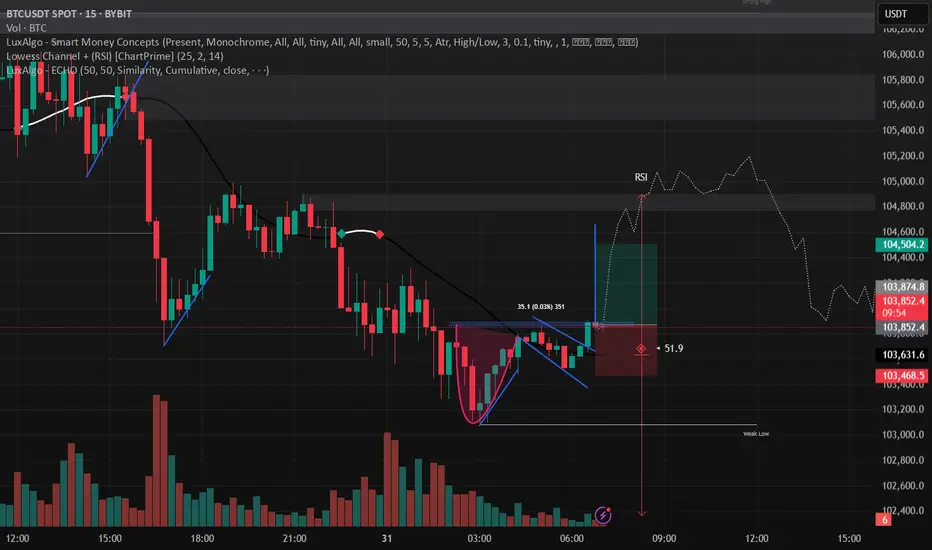
BTCUSDT Hello traders, wishing everyone a great weekend!
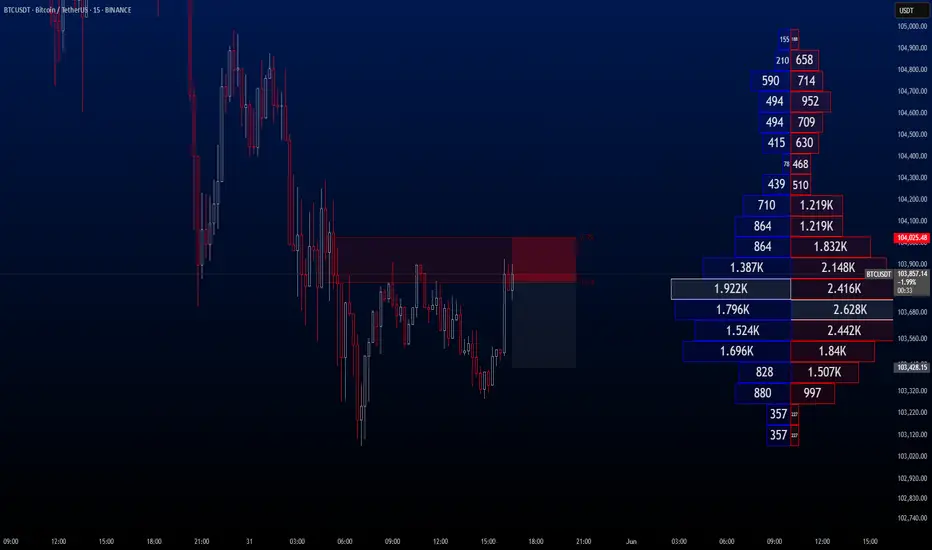
I’ve identified a sell opportunity on BTCUSDT and decided to share it with you as well.
🔍 Trade Details:
✔️ Timeframe: 15-Minute
✔️ Risk-to-Reward Ratio: 1:2 / 1:4
✔️ Trade Direction: Sell
✔️ Entry Price: 103,826.28
✔️ Take Profit: 103,428.15
✔️ Stop Loss: 104,025.48
🔔 Disclaimer: This is not financial advice. I’m simply sharing a trade I’ve taken based on my personal trading system, strictly for educational and illustrative purposes.
📌 Interested in a systematic, data-driven trading approach?
💡 Follow the page and turn on notifications to stay informed about upcoming trade ideas and advanced market insights.
No breakout. Just engineered liquidity. Watch how I step in.This setup didn’t need noise. Just clarity.
We took sell-side liquidity below the FVG FF with precision, tapping into a 4H OB nested at a deeper 78.6% retracement. That’s where the mispricing ends. That’s where I step in.
Price didn’t reverse because of “oversold.” It reversed because Smart Money engineered the imbalance, swept stops, and delivered into a value zone. Nothing more. Nothing less.
The rejection from that 102,067 level formed the base. From there, I expect delivery up into the 104,953 handle — where the 0.618 confluence and the upper OB sit. That’s the decision point.
Above that, we’ve got unfinished business at 107,614. If price pierces through 106,955 — where the 0.5 lines up with a previous supply — expect the full expansion into the 109,500s.
But I’m not rushing it. Liquidity above that OB at 108,122 has weight — and may serve as distribution before another push lower.
What I’m watching:
✅ Buy-side liquidity resting above 104,953
✅ OB rejection zone at 108,122
❌ 102,067 invalidation if price closes with displacement through the low
🔻 If that fails — price wants the inefficiency down near 102,051
I’m not here to catch every move.
I’m here to catch the right one.
I don’t need confirmation. I am the confirmation.

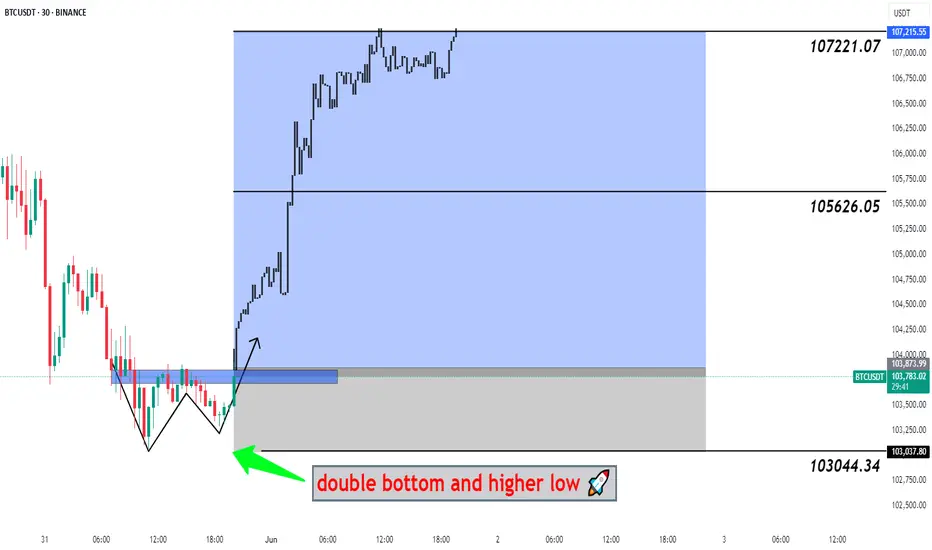
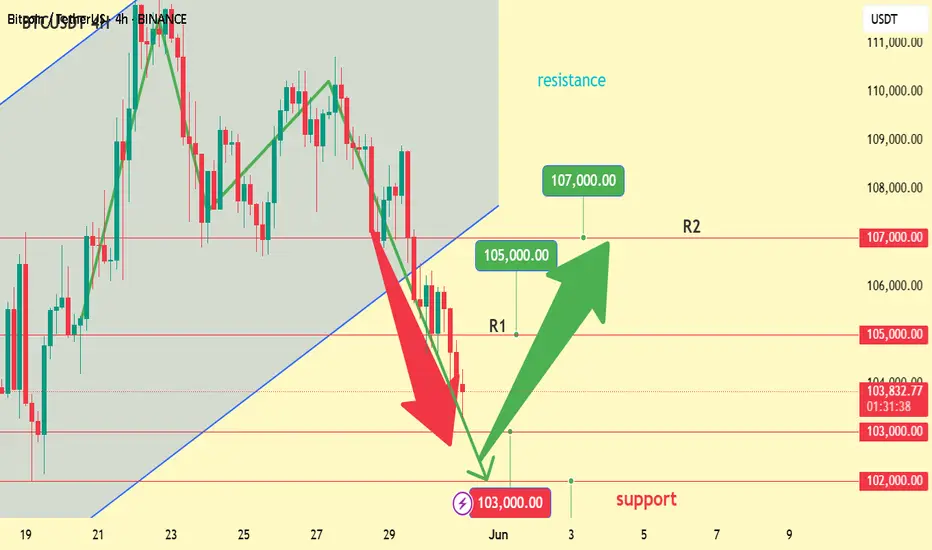
#BTCUSDT Big Pump Next Hour - Bitcoin, BTCUSD, BTCUSDT 📉 Double Bottom Pattern Forming – Potential Reversal Setup
The current price structure is showing signs of a Double Bottom – a classic bullish reversal pattern. After an extended downtrend, this pattern suggests that the market may be preparing for a trend reversal from this key demand zone.
🔹 Trade Setup
Entry, Targets, and Stop Loss (SL) are marked on the chart.
Entry: Upon breakout confirmation above the neckline.
Stop Loss: Just below the recent swing low to manage downside risk.
Targets: Calculated using the measured move method from the bottom to the neckline .
🔹 Risk & Money Management (Professional Approach)
To maintain consistent profitability and protect capital, strict risk management is essential. For this setup:
🔸 Position Sizing: Based on a fixed % of total capital (typically 1–2% of account equity per trade).
🔸 Risk-to-Reward Ratio: Minimum of 1:2, ideally higher.
🔸 Stop Loss Discipline: No arbitrary changes after entry. SL only adjusted for breakeven or trailing stops once price moves favorably.
🔸 Trade Management: Secure partial profits at key levels, trail stops as structure forms.
🔸 Capital Allocation: Avoid overexposure. Trade fits within overall portfolio strategy.
💬 Let the setup come to you. React, don’t predict.
🔁 Like, comment, or share your thoughts below!
BINANCE:BTCUSDT BITSTAMP:BTCUSD COINBASE:BTCUSD BINANCE:BTCUSDT.P INDEX:BTCUSD CRYPTOCAP:BTC.D CRYPTO:BTCUSD BYBIT:BTCUSDT.P BINANCE:BTCUSD
Today's BTC trading strategy, I hope it will be helpful to youDespite the current pessimistic market sentiment, this often serves as a precursor to a market reversal. During the price decline, trading volume has significantly shrunk, indicating that panic selling is gradually decreasing and bearish momentum is being continuously exhausted. When trading volume begins to moderately expand, it signifies that new capital is entering the market, and market sentiment is gradually recovering. At the same time, according to fund flow data, although funds are flowing out in the short term, institutional investors' attention to Bitcoin has not diminished in the long term. Once market sentiment improves, institutional capital is likely to flow back on a large scale, driving Bitcoin prices higher.
In terms of macro policies, attitudes toward Bitcoin around the world are gradually diversifying. Some countries have begun to explore Bitcoin's applications in the financial sector, and even have policies to support the development of Bitcoin-related industries. Once countries introduce policies that explicitly support Bitcoin's development—such as recognizing its legal status or simplifying transaction processes—it will greatly boost market confidence and attract more funds into the Bitcoin market. From an industry development perspective, as a typical application of blockchain technology, Bitcoin's technology continues to iterate and upgrade, and its application scenarios are also expanding, fundamentally enhancing Bitcoin's intrinsic value and providing long-term support for price increases.
Today's BTC trading strategy, I hope it will be helpful to you
BTCUSDT BUY@102000~103000
SL:101000
TP:105000~107000
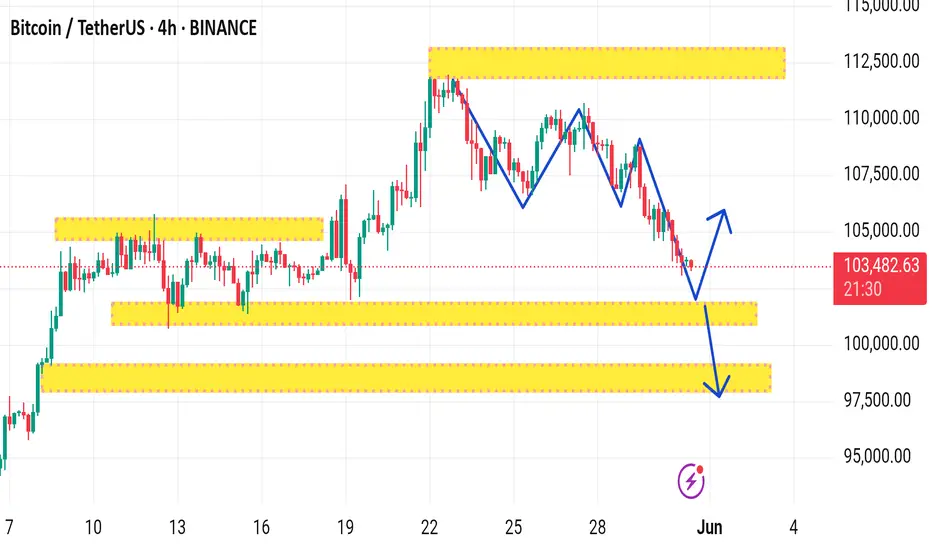
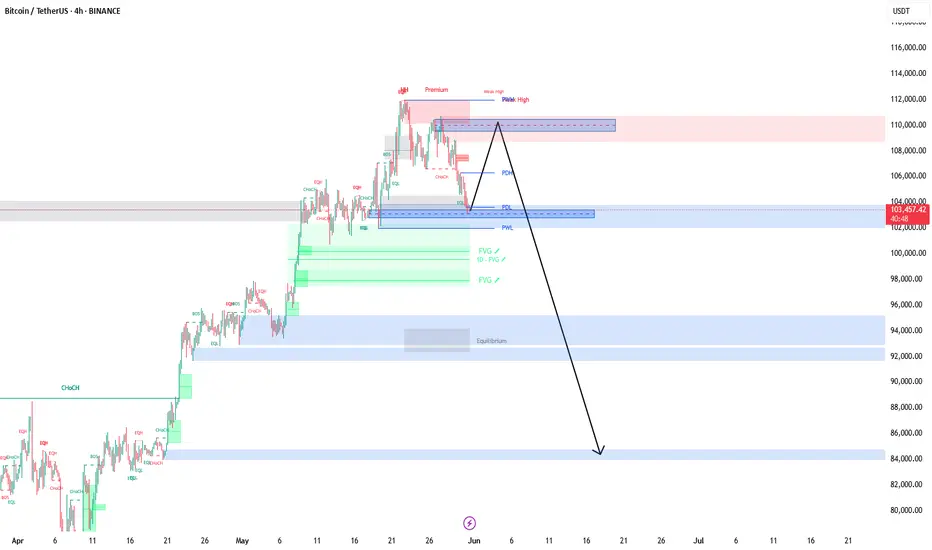
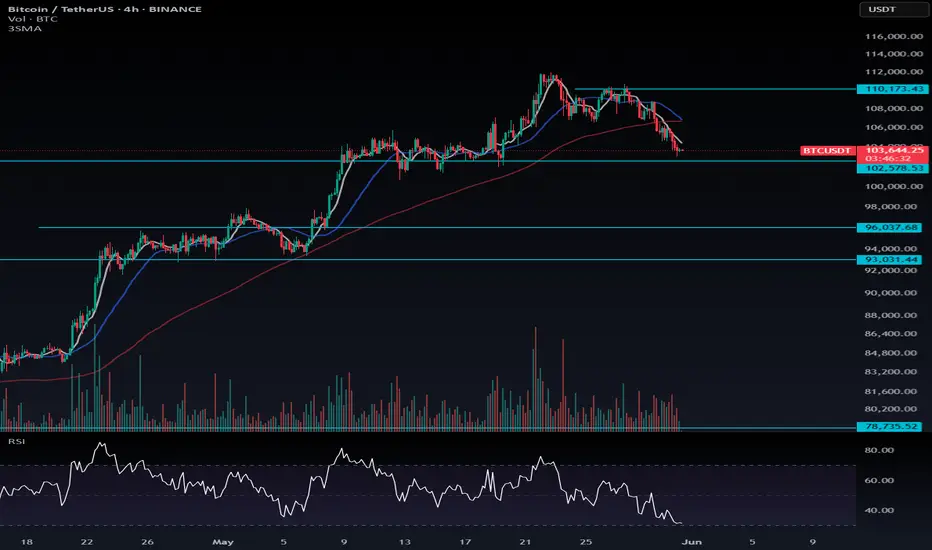
BTCUSD UPDATE 31- 5 - 25This chart shows a technical analysis of the BTC/USDT (Bitcoin/US Dollar Tether) pair on the 4-hour timeframe using Binance data. Here's a detailed breakdown of the key elements:
Current Price:
BTC is trading at $103,439.50, down 0.53% on the 4-hour chart.
Highlighted Zones (Yellow Boxes):
These are likely support and resistance zones:
1. Resistance zone near $112,000 – This is the recent high and potential sell zone.
2. Support zone around $101,000–102,000 – This could act as the first level of buying interest.
3. Stronger support zone between $97,000–99,000 – Key demand area if the price drops further.
4. Mid-range zone around $104,000–105,000 – Previous consolidation area which could act as a minor resistance/support flip.
Blue Zigzag Line:
This illustrates a potential head and shoulders pattern, followed by a projected price movement:
A possible bounce from the $101,000 area back toward $105,000.
If that fails, a bearish continuation toward the lower support zone near $97,000.
Implications:
Short-term Bearish Bias: The overall pattern suggests potential further downside unless BTC holds the current support area.
Reversal Potential: A successful bounce at current levels could lead to a relief rally.
Key Levels to Watch:
Break below ~$101,000 could open the way to ~$97,000.
Break above ~$105,000–106,000 may indicate a shift back to bullish momentum.
Would you like a deeper technical analysis or recommendations based on this setup (e.g., risk/reward, entry/exit ideas)?
BTCUSDT 4H – Key Support Test | Bounce or Breakdown?
Bitcoin has been in a clean uptrend for the past few weeks, making consistent higher highs and higher lows. Recently, we’ve seen a pullback that’s now testing a major confluence zone, which makes me lean bullish in the short term.
Here’s what I’m looking at:
1. 200 EMA (4H)
Price is currently testing the 200 EMA, which has acted as dynamic support throughout this uptrend. This is often a key level where bulls step back in after a healthy correction.
2. High Volume Node (102.5K–103.5K)
This area lines up with a visible HVN on the volume profile, suggesting strong previous acceptance and institutional interest. Holding this area implies a potential base for the next leg higher.
3. Retest of Ascending Trendline (Broken)
We’ve broken the minor ascending trendline, but price is now testing horizontal demand + EMA, which could act as the real support. This isn’t invalidating the uptrend structure yet — just a deeper pullback.
4. Demand Zone + Volume Spike (Recent)
The previous demand zone is still valid, and we saw a decent spike in sell volume into support — which could indicate a liquidity sweep or stop hunt, setting up for a reversal.
Trade Setup
📈 Long Setup: Bounce from Confluence Zone
Entry Zone: $102,300 – $103,300
Stop Loss: $101,400 (below HVN + 200 EMA)
Target 1: $106,000
Risk/Reward: ~1:2.5
This setup banks on BTC holding the 200 EMA and key HVN, continuing its overall bullish structure. A clean 4H bullish engulfing or a strong close above $104K would add even more confirmation.
Invalidation Criteria
If BTC closes a full 4H candle below $101,500 with no immediate buyback, I’ll consider the setup invalid and step aside — the next major HVN is around $96K, and I’ll look to long there instead.
BTC is pulling into a beautiful confluence of structure, volume, and dynamic support.
Short-term bearish pressure looks more like a corrective move within a bullish trend.
I’m looking to scale into longs if this zone holds. Tight invalidation and clean structure — great R/R.
Bullish Argument
First real test of 200 EMA since early April — trending markets often bounce here
Consolidation on top of prior demand — this could be a liquidity sweep / fakeout
High-volume support just below price = buyers likely interested here
We still haven't broken any key swing lows, so higher timeframe structure is intact
Bearish Risks to Watch
Trendline break and sustained lower highs = momentum shift
Lack of immediate bounce = could mean support is weakening
Break and close below $101.5K likely opens the door to $96K–$97K next HVN

btc btc crash is coming next week tight your seat belt as it indicates it was broket the ATH meand all the time high so that also it creates double top tough we are waiting the supply zone retest and them all the way down we will see the result next week subscribe me
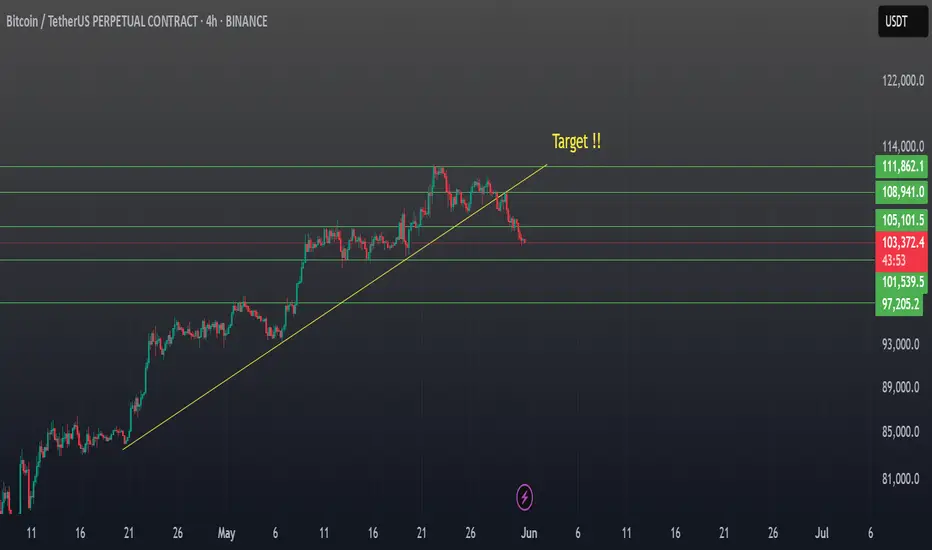
BTC/USDT – Trendline Breakdown Alert!Bitcoin has broken below its ascending trendline on the 4H chart, signaling a potential shift in momentum. 📉
Current Price: $103,322
Immediate Support Levels: $101,539 | $97,205
Target Zone: ~$97K if bearish momentum continues
Resistance: $105,101 | $108,941
If the momentum is sustained above $105,101, we can see a rally to the immediate resistance of $ 112,000.
Stay tuned for detailed updates !!
Watch for confirmation below $101.5K — a sustained drop could open the gates to further downside. Trade safe! 🚨
#Bitcoin #BTCUSDT #CryptoTrading #TechnicalAnalysis #TradingView #ScramblerG
BTCUSDT Preparing for one more time jumpThe reversal area has been marked on the chart..
When the price comes to the level we need to see some bullish momentum before we enter into the rocket trade..
THANKS.
DYor

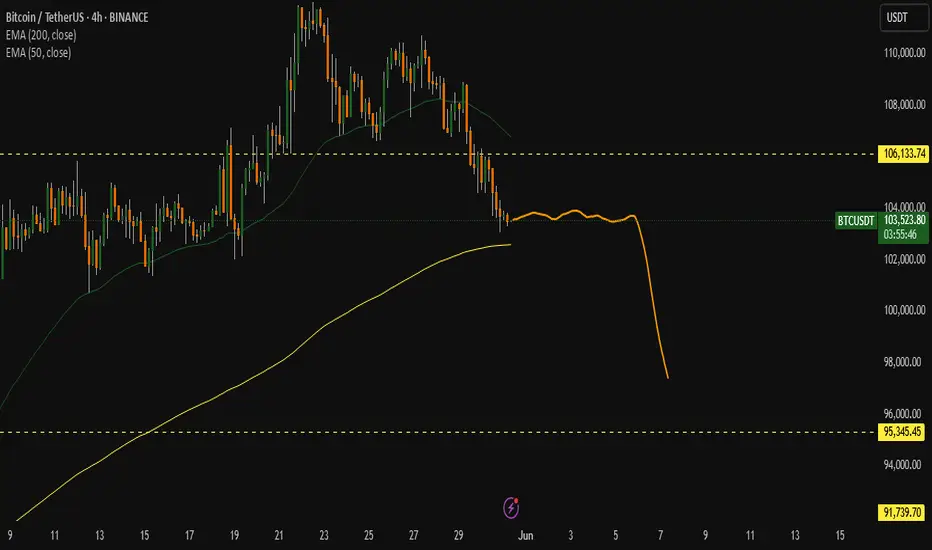
Technical Note on BTC/USDBearish bias in the short term unless the price breaks and holds above the resistance.
• Monitor volume and structure on the breakdown to confirm momentum.
• Key levels to watch: Resistance ~109,000, Support ~104,000–104,500.
BINANCE:BTCUSDT
Please, God, please 🚀🚀
Bullish divergences spotted across 5 key indicators:
🔹 MACD
🔹 RSI
🔹 CCI
🔹 OBV
🔹 VWMA + MACD Combo
📍Price currently reacting from the 103K discount zone
🎯 Targeting 104570 my equilibrium zone
Setup looks clean. Let’s see if bulls take control 🐂📈
#BTC #SmartMoney #CryptoSetup

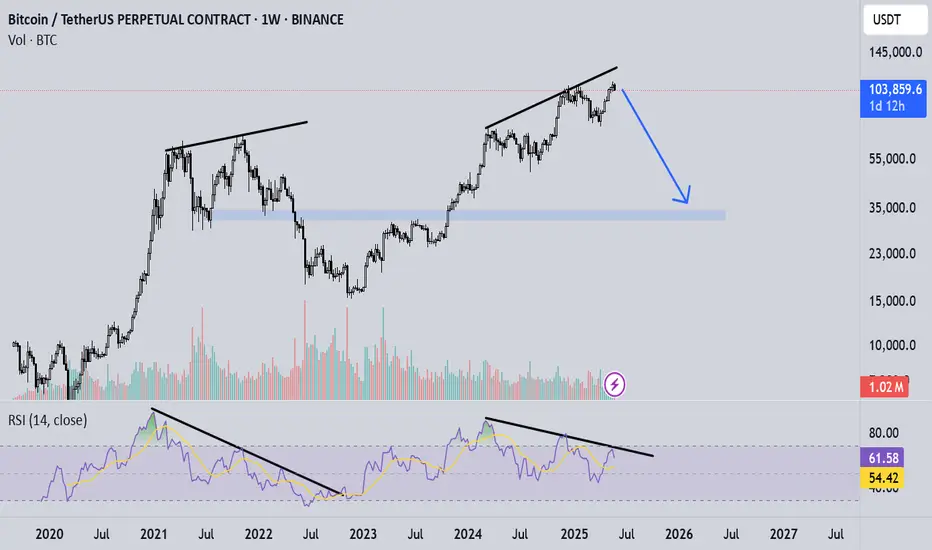
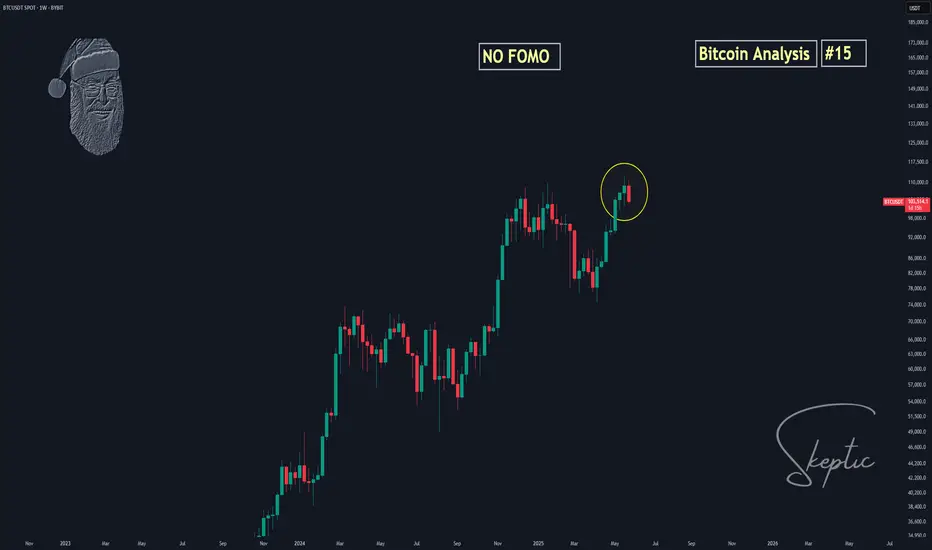
Skeptic | Bitcoin Weekly Recap #15 Bull Run On? Altcoin Next?Hey everyone, Skeptic here! Bitcoin’s been throwing curveballs this past week—did it leave you spinning? 😵 Still unsure if the bull run’s officially on, or hunting for the perfect altcoin entry? Don’t worry, in this recap, I’m laying it all out with clear reasoning to give you a crystal-clear view of the market and help you ditch those FOMO-driven decisions. Here at Skeptic Lab , we analyze Markets with one motto: No FOMO. No hype. Just reason. We’re not like others who panic over dumps or hype every pump—we’ve got risk management , stop losses , and we stay glued to the market’s pulse. Let’s dive into the Bitcoin Weekly Recap and unpack it all! 📊
Monthly Timeframe: The Big Picture
Let’s zoom out to the last three months. The 74,000 to 82,000 range has been a rock-solid support zone for Bitcoin, with heavy shadows every time we touch it. Big shadows like that scream potential trend reversal, and right now, Bitcoin’s major trend is firmly uptrend. Until we see a clear signal for a trend change, all that noise about Bitcoin crashing to 50K or “the bull run’s over” is pure nonsense. If you hear anyone making those bold future price predictions, run the other way! Our job isn’t to predict the future—it’s to map out scenarios and have a plan when they play out. Comparing the 2022 bear market to now is flat-out silly. Why? Back then, we’d already seen massive gains, but now, we haven’t had significant growth yet—altcoins are quiet, and total market volume hasn’t spiked. The end of a trend isn’t when everyone’s scared of losses; it’s when everyone’s dreaming of becoming a millionaire and the news is pumping FOMO. 😄 So, ignore those baseless analyses and let’s get to the real stuff.
Weekly Timeframe: Momentum Check
On the weekly chart, we kicked off a solid uptrend momentum, even hitting a new all-time high. Bears tried to jump in and sell, but here’s the catch: the previous ceiling hasn’t been technically broken yet, so we haven’t gotten a clear buy signal. Why? Because support and resistance levels aren’t static—they shift over time. The longer time passes, the higher or lower these levels move, and they need updating. Right now, we got rejected after testing the ceiling because our true resistance is still intact. So, when do we get confirmation? Let’s drop to the Daily Timeframe for clarity.
Daily Timeframe: Spot Trigger
After breaking 112,000 , we’ll get the main confirmation that the last ceiling before the correction is broken, signaling the continuation of the major uptrend per Dow Theory. That’s our spot buy trigger—buy above 112,000 with a stop loss below 100,000 , giving you a 10% stop loss size. Please, manage your capital so that if you hit the stop loss, you lose no more than 3% of your total capital. Staying alive in financial markets hinges on risk management. Now, let’s hit the 4-Hour Timeframe for long and short triggers.
4-Hour Timeframe: Long & Short Setups
We had a solid upward trendline on the 4-hour chart, but it broke to the downside. When this happens, two scenarios are possible: either the uptrend’s slope has just softened with no trend change, or we’re entering a correction. My take? We’re likely heading for a time-based correction (think range-bound boxes). If we start ranging, don’t beat yourself up or pile into trades impulsively—win rates for most traders tank in range phases, and losing streaks pile up. For long positions, I suggest waiting for a break above 108,900 . That’s where we got a strong rejection and pullback last time, so we need solid confirmation to go long since bearish momentum is stronger in this phase. For shorts, 105,000 was a good level, but the next short trigger is a break below support at 101,577 . If we see a strong reaction at any level on this timeframe before that, you could short on a break there too. For breakout confirmation, indicators like SMA or RSI work, but volume is king. High volume on a break means it’s likely to continue; low volume screams fake breakout, so cut your risk there.
Bitcoin Dominance (BTC.D): Altcoin Timing
Let’s wrap up with a quick look at BTC.D to figure out if it’s time to jump into altcoins. BTC.D shows Bitcoin’s share of the total crypto market cap—the higher it is, the more liquidity flows into Bitcoin, often from altcoin sales. On the daily chart, we’re still above an upward trendline I mentioned in previous analyses, and altcoins haven’t made any real moves. When I say “moves,” I mean serious 100-500% or even 10,000% rallies , not just 10-20% pops. An altseason would be confirmed by a break of this trendline and a drop below support at 60.27. That’s when we’d expect massive altcoin gains, but it only works if Bitcoin’s already in a strong uptrend with solid market liquidity. Otherwise, don’t expect crazy altcoin pumps. The total market cap needs to be growing too for this to happen.
💬 Let’s Talk!
If this recap sparked some ideas, give it a quick boost—it means a lot! 😊 Got a pair or setup you want me to tackle next? Drop it in the comments. Thanks for joining me at Skeptic Lab—let’s grow together with No FOMO. No hype. Just reason. Keep trading smart! <3✌️
BTC HTD Demand zones for longBTH HTF Demand Zone are marked,
when price hit these levels you can take long if you want,
trading is risky, Do-your-own-research, Follow risk management

BTC///SHORT/// Risk to reward Unusual, do not copyHello. This is trade that i take on prop firm account with around 10 to 1 risk to reward. Do not copy this trade.

Bitcoin Price Correction or Crash?📉Here's What Traders Should Know
Amid recent market fluctuations, it's important not to fall for fear-based narratives. What we’re experiencing is not a market crash, but rather a technical correction within the ongoing bullish cycle.
🔍 Key Insight:
This correction may extend toward the $96,000 to $93,000 price zone, aligning with key support areas and potential Fibonacci retracement levels. There's currently no significant cause for concern, as this movement appears to be part of a healthy market structure.
💡 Pro Tip for Traders:
Stay calm and avoid emotional decisions. Focus your attention on identifying high-conviction long setups when market conditions become favorable again.
📊 Strategy Tip:
Use this consolidation phase to reassess your risk management, refine your trade setups, and get ready to act when bullish confirmation signals emerge. Volatility often sets the stage for the next major move — preparation is key.
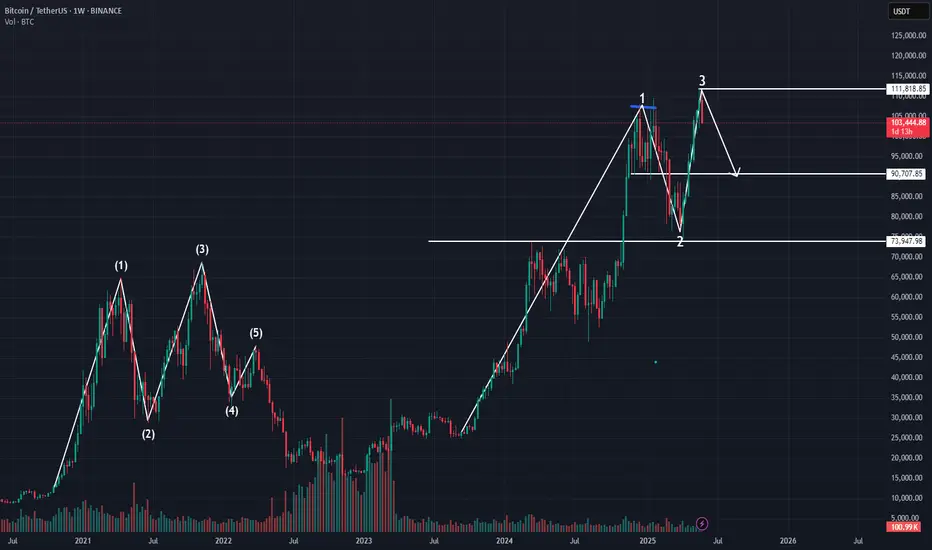
The time has come for #Bitcoin's highest flight.After hitting the user stops, now it's time for Bitcoin to gain strength and reach its true value. The last lag, in my opinion, should be much larger than lags 1 and 2. Everything I predicted so far has come true. If this one comes true, I'll take a training course. BINANCE:BTCUSDT 😅💚
