BTC RISK FALLING BACK TO 99k!!Bear pressure increases after price failed to break or trade back to an all time high price of 111,900 from the technical standpoint, we’re likely going to see a drop in price to 99k ( slightly below the 23.6% fibo retracement level) this has a high probability of occurring price pushed to ATH right after the 99k & 100k level got broken. So , I anticipate price to revisit that zone.
BTCUSDT.P trade ideas

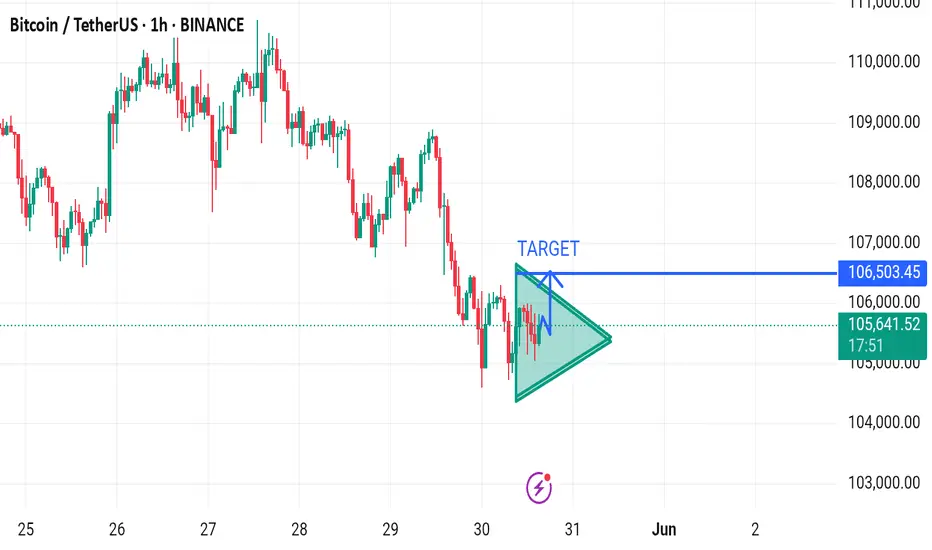
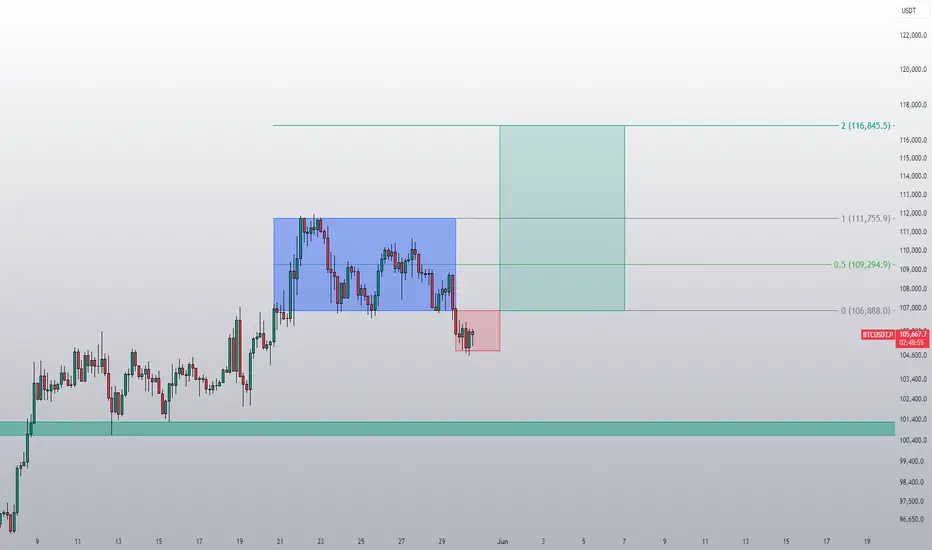
BTCUSD Entre point 106 105500target 106500 stop loss 104700I think there's a formatting issue with the entry point. Assuming it's BTCUSD:
- Entry Point: 105,500
- Target: 106,500 (1,000-point gain)
- Stop Loss: 104,700 (800-point risk)
Risk-reward ratio looks decent! Let's see how it plays out. What's your trading strategy behind this setup? Are you expecting a bullish breakout?
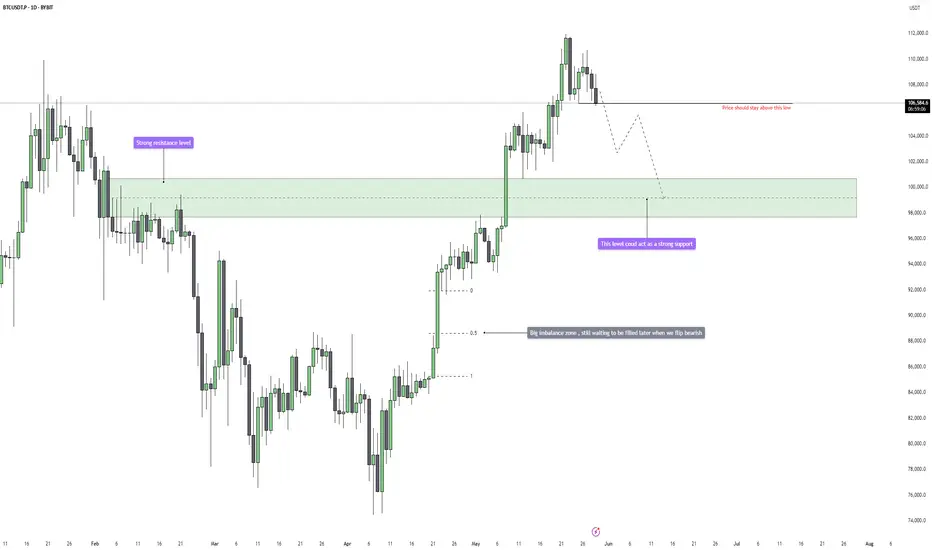
BitcoinBitcoin needs to find buying volume from this area to grow, otherwise further correction is still expected.
BTC long setup 15m 30 may 2025BTC long setup 15m 30 may 2025 this is a 15 minute scalping setup please monitor it
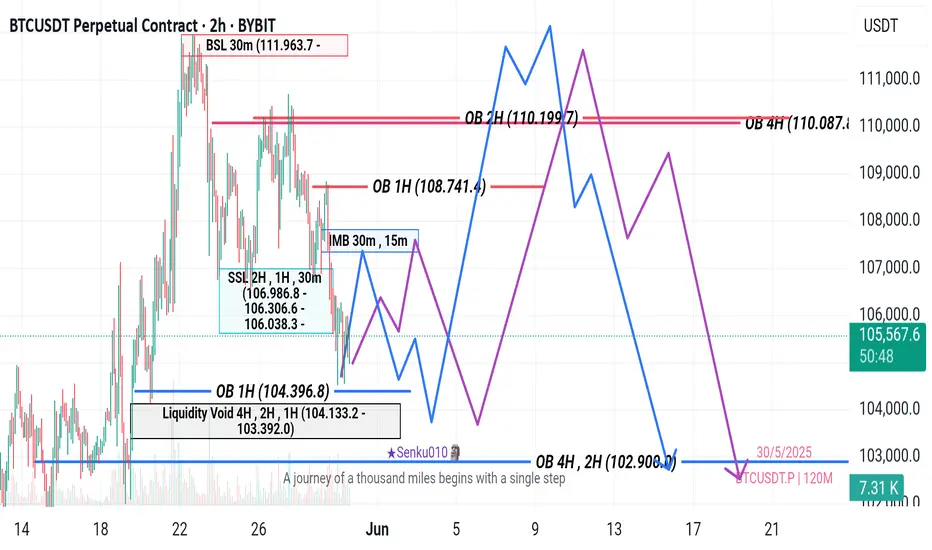
BTC Update Overall Bias
1D, 4H BTC exhibits a strong underlying bullish
decisively swept major multi-timeframe Sell-Side Liquidity
Bitcoin - Will we go back to $99k?Bitcoin is showing its first real signs of weakness after an extended bullish run. The current price action around $106,700 suggests a loss of momentum, with price hovering just above a key daily low that could act as a pivot point. If this low gets taken out, it would likely mark a short-term shift in sentiment from bullish to bearish, opening the door for a deeper retracement toward key inefficiency zones that remain unfilled.
Consolidation and Liquidity Structure
After the sharp breakout in early May, price rallied aggressively with minimal pullbacks, leaving behind several imbalance zones that now act as downside magnets. The previous range high around $99,000, which acted as a strong resistance level earlier this year, has not yet been properly retested. This area aligns with a large daily imbalance, making it a highly probable target in the event of a breakdown. Currently, price is consolidating just above this previous resistance-turned-support zone, and pressure is building.
Bearish Breakdown Potential
If the current daily low breaks, it would likely trigger a flush into the $99,000 to $95,000 range, where we find that unfilled imbalance waiting to be closed. A break and acceptance below the $99,000 level could suggest deeper trouble for the bulls. In that case, the next major downside target sits around $92,000, where an even larger inefficiency from earlier in the year remains open. This level also coincides with a significant accumulation zone that could provide the next strong base of support if the market continues correcting.
Bullish Recovery Conditions
On the flip side, if Bitcoin holds this low and finds demand stepping in at current levels, we could see a local bottom form. A recovery and push back toward $108,000 or even a reattempt of the $112,000 highs would be back on the table. But for this bullish case to stay alive, the current daily low must hold. A sweep and reclaim could trap late sellers and fuel a quick reversal. However, right now, the pressure is clearly leaning to the downside unless buyers show strong intent soon.
Imbalance Zones and Key Price Areas
The most critical area to watch is the $99,000 level. It’s the confluence of an old resistance, an unfilled imbalance, and psychological round number support. If price tags this zone, we’ll need to monitor reaction closely. Weakness below $99,000 opens the door to $92,000, which is where the next higher timeframe imbalance sits. If we start accepting below $92,000, that would confirm a much more extended corrective phase is underway.
Price Target and Expectations
The primary expectation is a move into the $99,000 imbalance zone, assuming we get a clean daily low break. A bounce there would offer the first chance for a bullish reaction, but if sellers dominate, $92,000 becomes the secondary and more extreme downside target. A reclaim of $108,000 would invalidate this short-term bearish thesis and shift the focus back toward the highs.
Conclusion
All eyes are on the daily low. A clean break below it would change the tone of this market and likely initiate a short-term bearish cycle, targeting inefficiencies left behind during the rally. $99,000 is the key zone to watch first. If it holds, bulls may step back in. If not, $92,000 becomes the next target in line. For now, caution is warranted as the risk of deeper downside continues to grow.
___________________________________
Thanks for your support!
If you found this idea helpful or learned something new, drop a like 👍 and leave a comment, I’d love to hear your thoughts! 🚀
Bitcoin (BTCUSDT) Daily Chart
### 🔥 **Bitcoin (BTCUSDT) Daily Chart Analysis – May 30, 2025**
**“Correction in Play or Deeper Dive Incoming?”**
After a powerful breakout above the descending trendline, Bitcoin surged with momentum — but now the bulls are pausing for breath.
🔻 **Current Price Action:**
BTC is showing early signs of a **pullback**, rejecting near \$106K. The uptrend line (dashed pink) has been breached, signaling that we might be entering a **correction phase**.
🛡️ **Key Support Zone – \$90,000 to \$95,000:**
Highlighted in red, this zone acted as a **major resistance** in the past and is now likely to **flip into support**. It's a strong demand area — buyers are expected to step in here.
🔍 **What’s Next?**
A move down toward this support area looks probable in the short term (as indicated by the arrow). Price reaction in this zone will be **critical**:
* ✅ **If BTC holds this zone** and forms bullish reversal candles → we could see another **leg up**.
* ❌ **If this support breaks down**, BTC may revisit deeper levels — possibly around \$87K or lower.
---
### 📊 **Summary**
* **Trend:** Bullish with short-term correction
* **Support to Watch:** \$90K–\$95K
* **Resistance:** \$106K–\$108K
* **Strategy:** Wait for a bullish confirmation near the support zone. Patience is power.
---
📢 *Trade with logic, not emotions. The market rewards preparation – not prediction.*

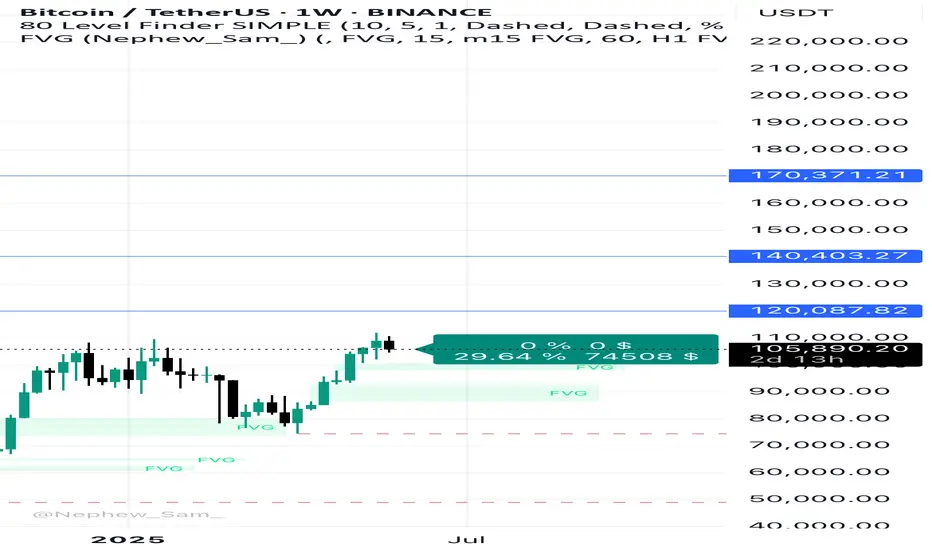
What if Bitcoin fails to break beyond the $120k resistance?This is only a theory and not a financial advice. What if Bitcoin fails to break beyond $120k? What if the the BTC supply remains the same due to large number of sells than buys? The "rising wedge" shows a potential downturn in the near future to ~$80,000 range again. This is only a technical analysis based on historical data and can be changed depending on investors confidence. Diamond hands is all it needs to bring the Bitcoin price to the $200k level.
BTC/USDT Analysis – Local Downtrend
Hello everyone! This is the daily analysis from a trader-analyst at CryptoRobotics.
Yesterday, contrary to expectations and the overall bullish context, we broke the local low and entered a phase of a local downtrend, within a broader uptrend.
At the moment, despite buyer defense and weakening selling pressure, we should expect a test of the buyer zone below $104,200–$102,300 (slightly adjusted based on the daily timeframe), from which stronger buying is more likely to resume.
A local resistance area has also formed during the decline at $106,800–$107,600 (aggressive selling volumes).
Sell zone:
$106,800–$107,600 (aggressive selling volumes)
Buy zones:
$104,200–$102,300 (accumulated volume)
Around $100,000 (aggressive buying volumes)
$98,000–$97,200 (local support)
$93,000
$91,500–$90,000 (strong buying imbalance)
This publication is not financial advice.

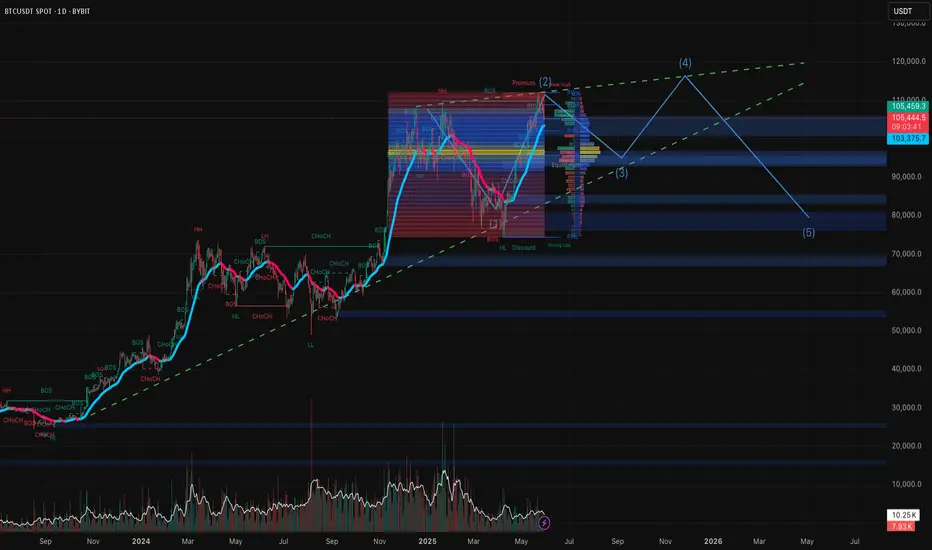
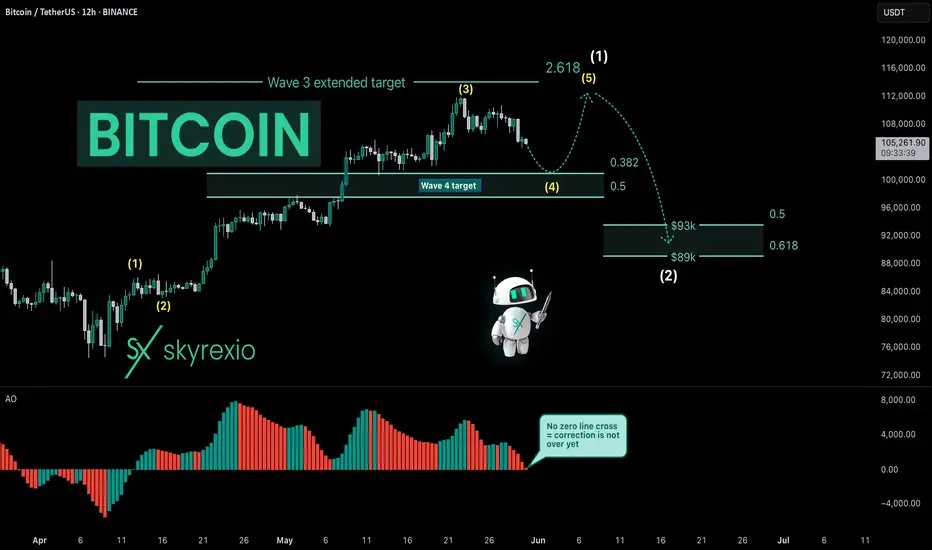
Bitcoin Is Entering Into Very Difficult TimesHello, Skyrexians!
I have been thinking what will happen next with BINANCE:BTCUSDT and it was obvious that correction has been started, you can easily find my recent update on Bitcoin and check it, but what will happen after. Today I decided that the first impulse has not been finessed yet and we need one more small leg up to complete this growth before significant correction.
Let's take a look at the yellow Elliott waves cycle. Awesome Oscillator gave me an idea that only wave 3 has been finished above $110k. Now price is printing wave 4. Wave 4 has a target between 0.38 and 0.5 Fibonacci, but this time it will be definitely 0.38 at $101k. Here was the smaller degree wave's 4 bottom. Wave 5 will be shortened because wave 3 was extended, it's very logically. After $111k retest the major wave 2 will go to $90k approximately. Difficult times ahead for crypto, I think this period will be finished only at the end of June.
Best regards,
Ivan Skyrexio
___________________________________________________________
Please, boost this article and subscribe our page if you like analysis!
Bitcoin Short-Term, Aims Below $100,000 (Alert!)Good morning my fellow Cryptocurrency trader, overall, the market looks great.
The market looks great but never forget that nothing is set in stone, market conditions can always change.
Let's consider Bitcoin for once on the short-term timeframe.
The long-term timeframes are good to spot the bigger cycle; the smaller timeframes are good to know what will happen next.
— Bitcoin 4H TF (Short-term)
Bitcoin hit a new all-time high and was followed by a strong bearish volume session. The action went on to move below a strong resistance zone, the ath range.
Now Bitcoin is trading below "local resistance" and this opens up a bearish bias short-term. When it moves back above $110,000, we can say the bulls are back in. When it trades below $106,000, we can say bearish confirmed.
Here we can see Bitcoin bearish while aiming lower.
If it continues dropping, 100K won't be the end. Either it recovers now, or else we will see a test of the low 90Ks.
Leave a comment if you agree.
Follow if you disagree.
Thank you for reading.
Namaste.

Bitcoin Technical Analysis – Quick Summary Date: May 30, 2025 Daily TF
Potential new Higher Low (HL) forming.
Confirmed only by forming a new HH on the dailly TF, which means we’ll have to break the ATH.
Break below 102,038 and we make a LL structure shift to bearish, which will mean likely more downside.
4H TF
Currently in a bearish structure.
Break above 108,900 = bullish shift, potential move toward a new ATH.
1H TF
Reclaiming 106,300 breaks the recent LH (CHOCH), triggering potential short-term bullish momentum.
Demand Zone (102,000–103,700)
Key area for a possible bounce and to form a new HL on the dailly TF.
Break below this zone and below the HL at 102,038 = possible strong bearish continuation.
Key Scenarios
Bullish:
1. Reclaim 106,300 → Break 108,900 → Push toward ATH.
2. Drop into demand zone → form a new LH on the dailly → Push toward ATH.
Bearish:
Drop into demand zone → Break 102,038 → Further downside.

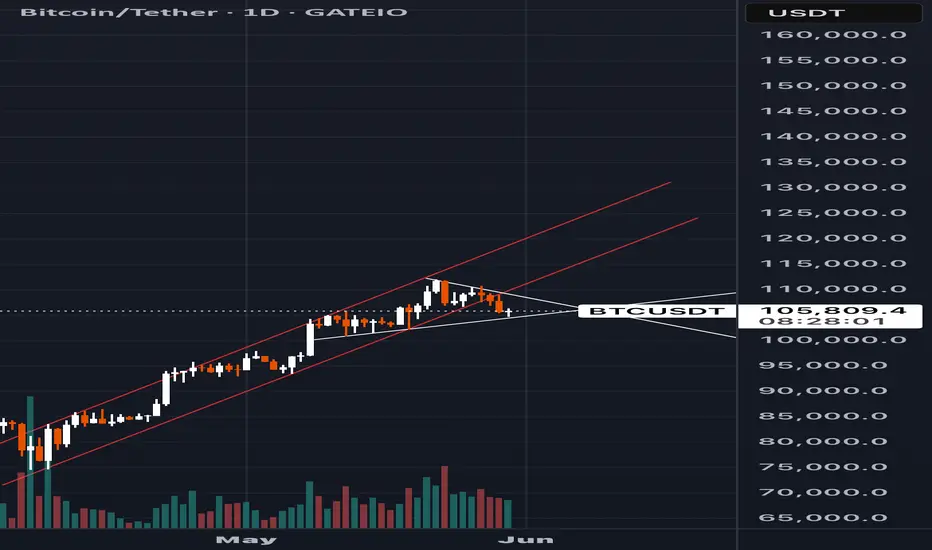
BTC – 4H Trendline Support TestGATEIO:BTCUSDT
🔎 CRYPTOCAP:BTC is testing the lower trendline support on the 4H chart.
📊 If it holds, we could see a quick pump. If it rejects, lower support levels are likely to come into play.
💬 Watching closely for the reaction to this critical level — let’s see if the bulls step in! 👀

Golden Cross vs. Death Cross: What Do They Really Tell Us?Hello, traders! 🤝🏻
It’s hard to scroll through a crypto newsfeed without spotting a headline screaming about a “Golden Cross” forming on Bitcoin or warning of an ominous “Death Cross” approaching. But what do these classic MA signals can really mean? Are they as prophetic as they sound, or is there more nuance to the story? Let’s break it down.
📈 The Basics: What Are Golden and Death Crosses?
At their core, both patterns are simple moving average crossovers. They occur when two moving averages — typically the 50-day and the 200-day — cross paths on a chart.
Golden Cross: When the 50-day MA crosses above the 200-day MA, signaling a potential shift from a bearish phase to a bullish trend. It's often seen as a sign of renewed strength and a long-term uptrend.
Death Cross: When the 50-day MA crosses below the 200-day MA, suggesting a possible transition from bullish to bearish, hinting at extended downside pressure.
📊 Why They Work (and When They Don't)
In theory, the idea is simple: The 50-day MA represents shorter-term sentiment, while the 200-day MA captures longer-term momentum. When short-term price action overtakes long-term averages, it’s seen as a bullish signal (golden cross). When it drops below, it’s bearish (death cross).
This highlights a key point: moving average crossover signals are inherently delayed. They’re based on historical data, so they can’t predict future price moves in real time.
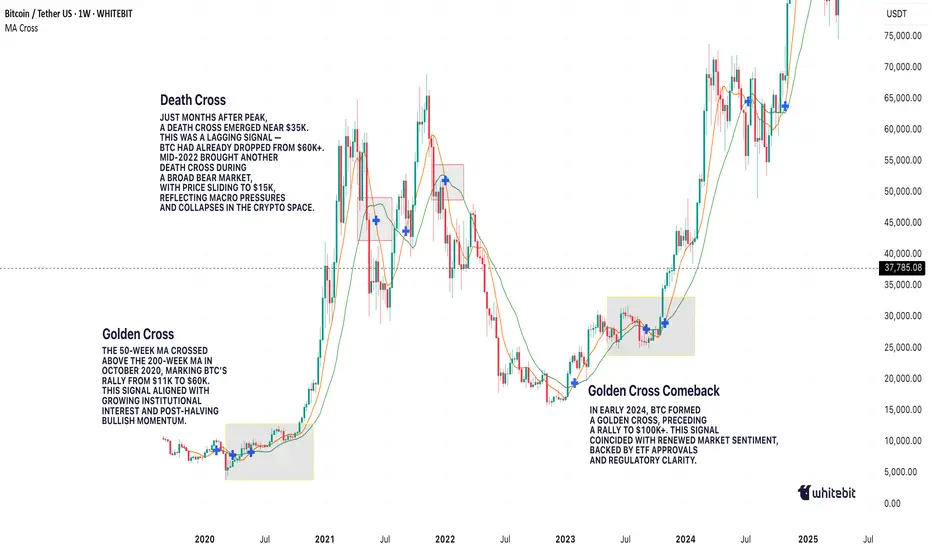
🔹 October 2020: Golden Cross
On the weekly BTC/USDT chart, we can clearly see a Golden Cross forming in October 2020. The 50-week MA (short-term) crossed above the 200-week MA (long-term), marking the start of Bitcoin's explosive rally from around $11,000 to its then all-time high above $60,000 in 2021. This signal aligned with growing institutional interest and the post-halving narrative, reinforcing the bull case.
🔹 June 2021: Death Cross
Just months after Bitcoin’s peak, a Death Cross emerged around June 2021, near the $35,000 mark. However, this was more of a lagging signal: by the time it appeared, the sharp pullback from $60K+ had already taken place. Interestingly, the market stabilized not long after, with a recovery above $50K later that year, showing that Death Cross signals aren’t always the end of the story.
🔹 Mid-2022: Another Death Cross
In mid-2022, BTC formed another Death Cross during its prolonged bear market. This one aligned better with the broader trend, as price continued to slide towards $15,000, reflecting macro pressures like tightening monetary policies and the collapse of major players in the crypto space.
🔹 Early 2024: Golden Cross Comeback
The most recent Golden Cross appeared in early 2024, signaling renewed bullish momentum. This crossover preceded a significant rally, pushing Bitcoin above $100,000 by mid-2025, as seen in your chart. While macro factors (like ETF approvals or regulatory clarity) also played a role, this MA signal coincided with a notable shift in sentiment.
⚙️ Golden Cross ≠ Guaranteed Rally, Death Cross ≠ Doom
While these MA crossovers are clean and appealing, they’re not foolproof. Their lagging nature means they often confirm trends rather than predict them. For example, in June 2021, the Death Cross appeared after much of the selling pressure had already played out. Conversely, in October 2020 and early 2024, the Golden Crosses aligned with genuine upward shifts.
🔍 Why Care About These Signals?
Because they help us contextualize market sentiment. The golden cross and death cross reflect collective trader psychology — optimism and fear. But to truly understand them, we need to combine them with volume, market structure, and macro narratives.
So, are golden crosses and death crosses reliable signals, or just eye-catching headlines?
Your chart tells us both stories: sometimes they work, sometimes they mislead. What’s your take? Do you use these MA signals in your trading, or do you prefer other methods? Let’s discuss below!
115k next?If BTC is able to reclaim 107k, the current breakdown may turn out to be a fakeout, and we could be looking at 115k.
Bitcoin Strong-Bullish Above 102000, Remember The Bigger PictureWe've defined $102,000 as the strongest support level ever based on the long-term. This number was extracted using the 2021-2022 bear market. It is mapped which a red dotted line on the chart.
On this chart you can see how this level worked as resistance in December 2024 and January 2025, later to become the strongest support ever now, in May 2025. Bitcoin is 100% bullish as it trades above $102,000.
» I should say super-bullish, hyper-bullish, ultra-bullish, etc.
Right now Bitcoin is safe and sound when considering the bigger picture.
The Altcoins market is also safe and we can continue to accumulate; Buy and hold.
If you have any questions do not hesitate to leave a comment.
Please keep in mind that market conditions can always change. In a day without notice.
Thanks a lot for your continued support, it is truly appreciated.
Namaste.

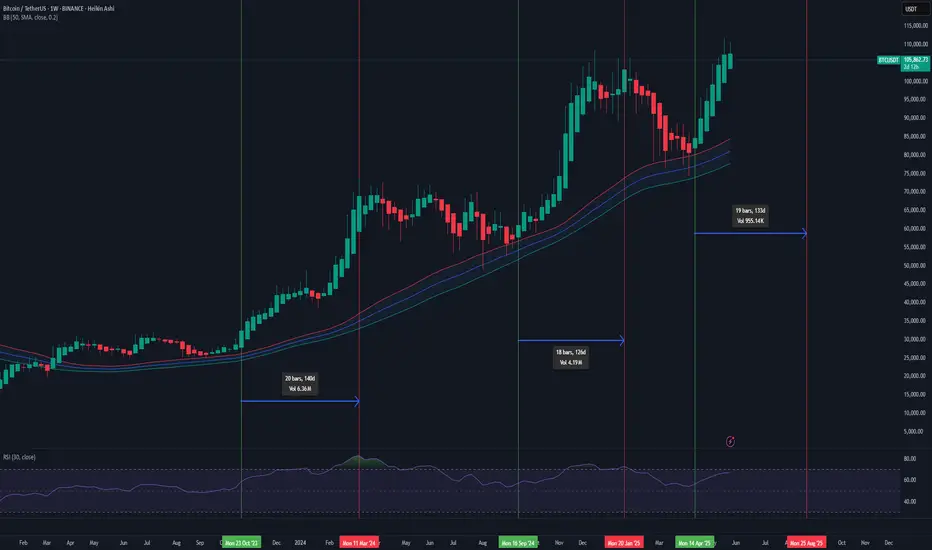
Bitcoin Technical Analysis (as of May 30, 2025)Bitcoin is currently forming another higher high within an established upward structure on the weekly timeframe.
In the previous two overbought scenarios on the weekly chart, significant retracements occurred shortly after the Relative Strength Index (RSI) entered the 72–82 range. These retracements followed parabolic price moves, signaling local tops.
📊 Current RSI Update:
As of this analysis, the weekly RSI stands at 66—a level that historically preceded strong upward moves. In both prior cycles, Bitcoin continued climbing after reaching RSI 56, before eventually topping out once the RSI reached the 72–82 range.
⏳ Timing Analysis:
Based on the average duration from when RSI crossed above 56 to Bitcoin’s major price peaks, we estimate there could be approximately 12 weeks remaining before a potential major retracement. This estimate is derived from:
March 2024 peak: 140 days from RSI 58
January 2025 peak: 126 days from RSI 56
Projected average: 133 days (~12 weeks)
Additionally, when weekly candles bounced off the lower Bollinger Band, the price subsequently moved higher, indicating continued bullish momentum.
🔍 What to Watch For:
RSI climbing past 70 could signal the final leg of the current rally.
RSI entering the 72–82 range has historically aligned with local tops.
Watch for volume divergence, candle exhaustion patterns, or other signs of weakening momentum near this RSI zone.
⚠️ Disclaimer:
This analysis is not a prediction or financial advice. It is a pattern-based observation derived from historical data. Market conditions can change rapidly. Always conduct your own research and manage your risk accordingly.
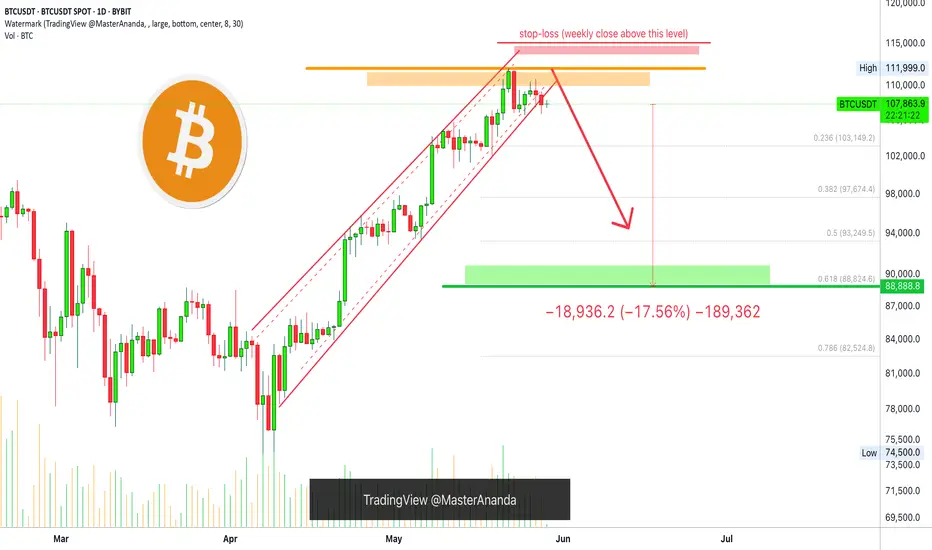
SHORT Bitcoin 10X Lev. Full PREMIUM Trade-Numbers (PP: 175.6%)For experts only. This is not for beginners.
Leveraged trading is ultra-high risk and it is even harder when it comes to shorting.
This is not medical advice. This is not spiritual advice.
This is definitely not financial advice. This is just a chart and some numbers.
How you decide to use these numbers is completely up to you.
I am wishing you tons of luck and success; profits 100%.
This is a strong chart setup. It looks great.
_____
SHORT BTCUSDT
Leverage: 10X
Entry levels:
1) $111,111
2) $109,255
3) $108,000
4) $107,000
Targets:
1) $103,149
2) $101,012
3) $98,790
4) $94.239
5) $89,999
11) $88,888
Stop-loss:
Close weekly above $115,000
Potential profits: 175%
Capital allocation: 4%
_____
Thank you for reading.
If you enjoy the content make sure to follow.
(Leave a comment with your toughts.)
Namaste.
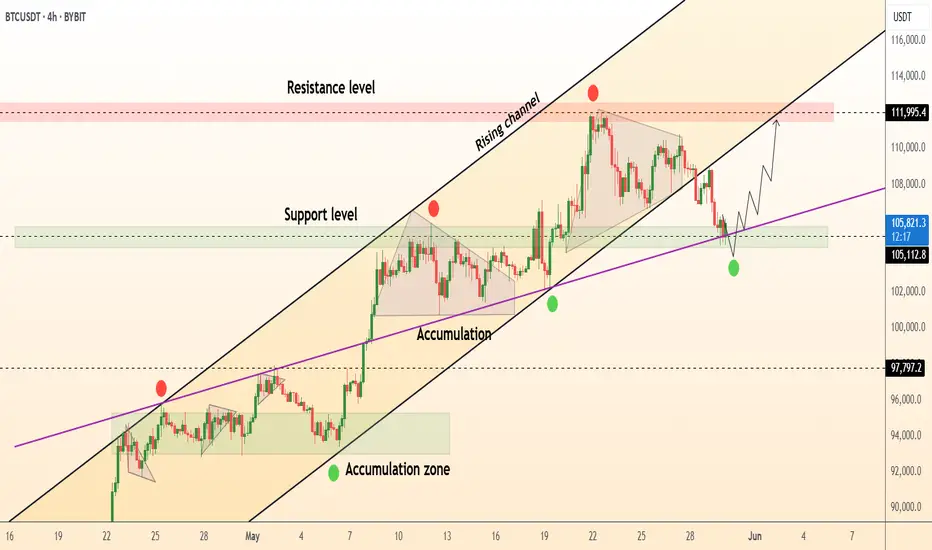
DeGRAM | BTCUSD reached the strong trend line📊 Technical Analysis
● Bulls defended 105 k again: a bullish inside-bar formed on the green demand band and purple trend-line, keeping price glued to the rising-channel median.
● 4 h RSI reset to mid-40s while OBV held flat, signalling dip absorption; pattern projects a swing back to the channel roof/-red supply near 112-115 k if 111 k neckline is cleared.
💡 Fundamental Analysis
● The Coinbase premium flipped positive for the first time in two weeks, reflecting fresh US spot buying just as soft Chicago PMI dragged the DXY lower, easing macro head-winds.
✨ Summary
Buy 105-108 k dips; break above 111 k eyes 112 k then 115 k. Trend intact while price closes above 104 k.
-------------------
Share your opinion in the comments and support the idea with a like. Thanks for your support!
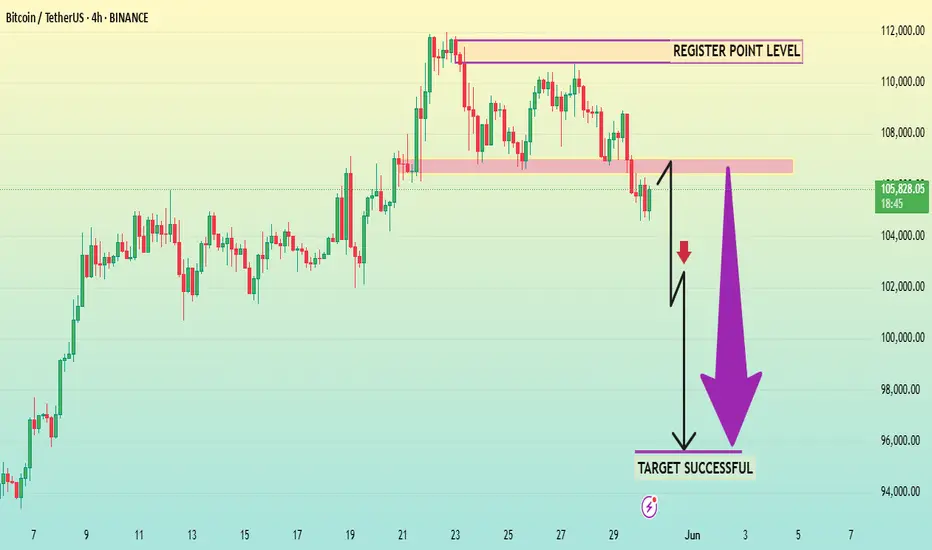
BTCUSD 4HThis chart presents a bearish setup for Bitcoin (BTC/USDT) on the 4-hour timeframe, shared by "Alpha_Gold_Trader." Here's the key breakdown:
---
Chart Breakdown
Current Price: Around $105,857
Resistance Zone (Register Point Level): ~$109,000 to ~$111,500
Support Zone (Breakout Level): ~$106,500 to ~$107,500 (pink box)
Bias: Bearish (implied by breakdown and downward projection)
Price Target: Around $95,000, labeled as "TARGET SUCCESSFUL"
---
Technical Implication
Price has broken below the support zone marked in pink.
A retest of broken support is anticipated before continuation down (common in breakout setups).
The setup suggests a short trade if price fails to reclaim the broken support and confirms rejection.
---
Trading Strategy Outline
Entry: Near $107,000 (on failed retest)
Stop Loss: Above $108,500 (back in the previous range)
Take Profit: ~$95,000 (target zone)
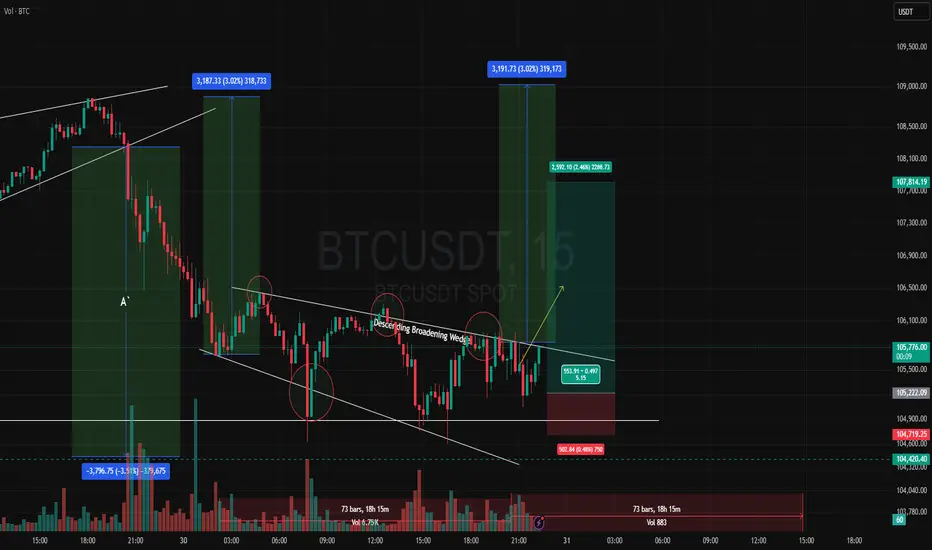
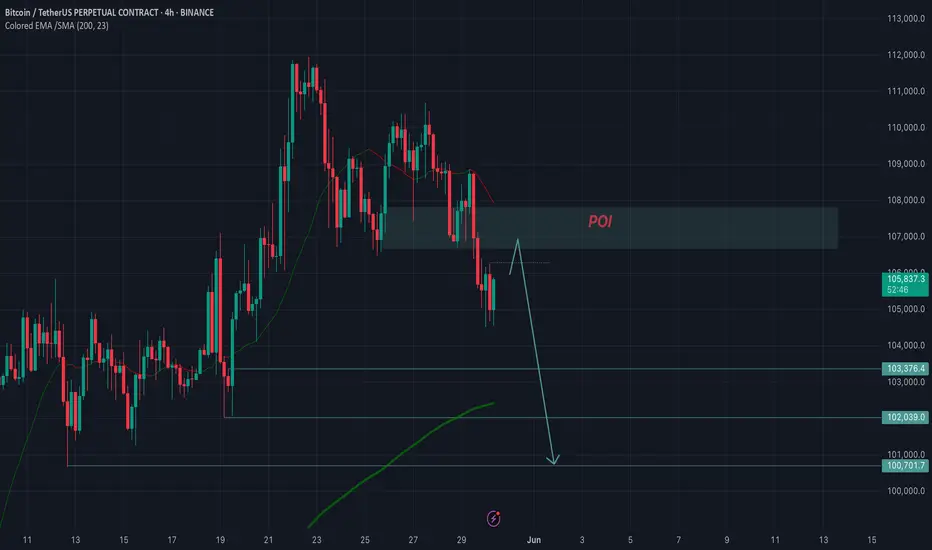
BTC SHORT correction. CRYPTOCAP:BTC 4H
This is not what I would bet on today, but in general I think the correction is not over
The marked zone of interest is a potential opportunity to open a local short position, without overestimating the volume in the deal
Local targets are: $103,424, $102,001, $100,717
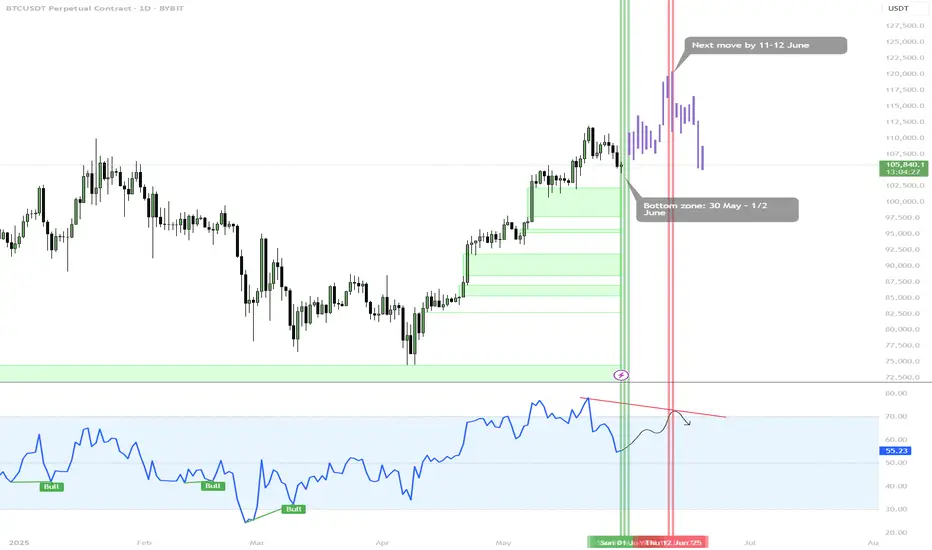
THE WALES ARE BUYINGAs you'll know there is no movement without correction, It seems we will hit new ATH (120k) by middle of the June
BTC — Time-Based Setup: Bottom Window in PlayTiming Windows
🟩 Bottom Zone: 🗓️ 30 May – 1/2 June
🟥 Next Major Move: 🗓️ 11–12 June
🧭 Time-based setups can offer precision — align with price and structure for confirmation.