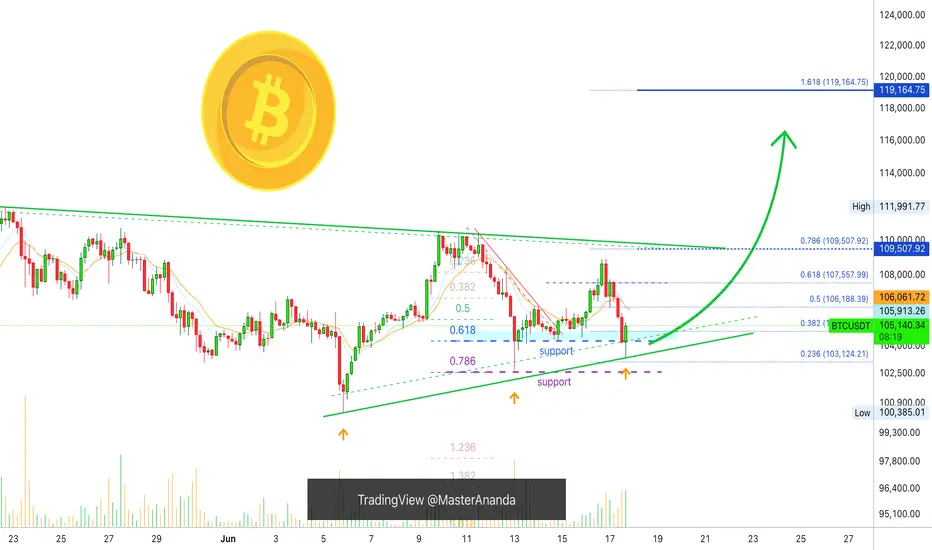
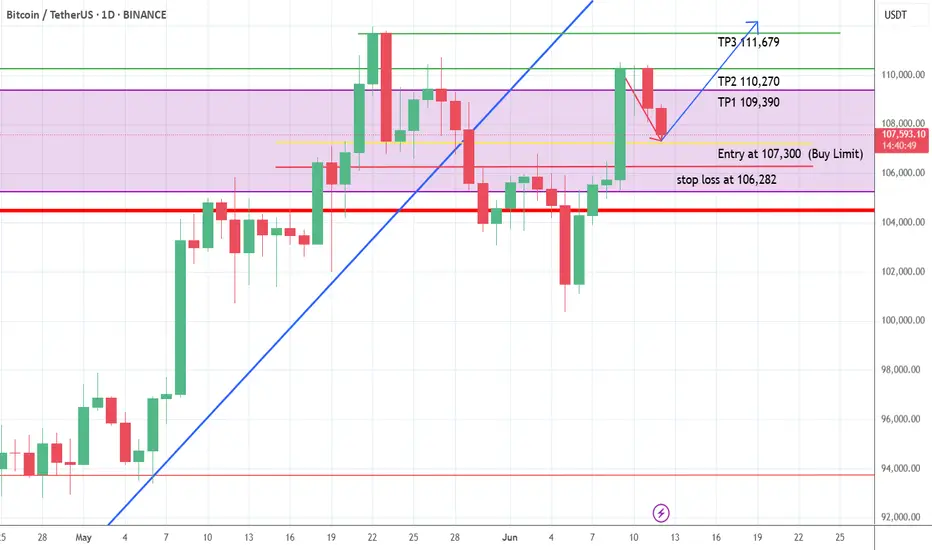
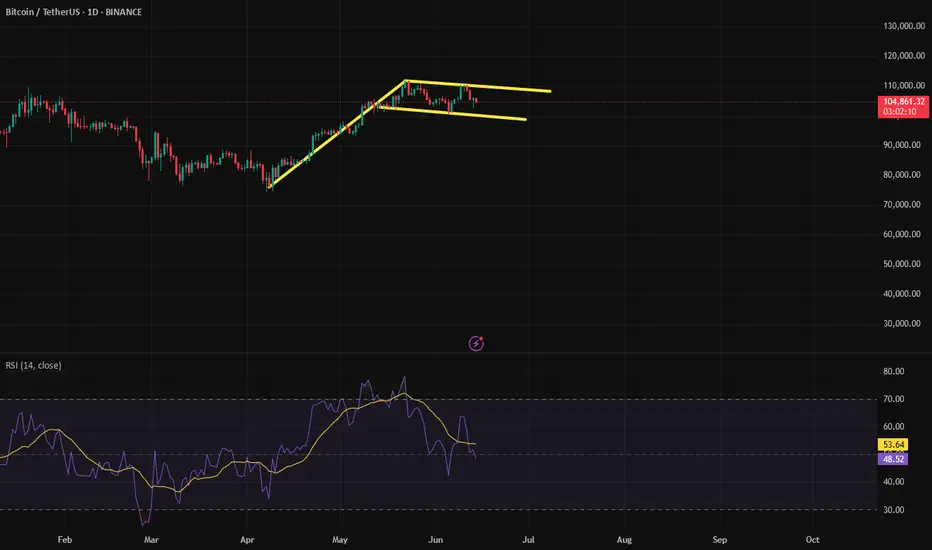
The Next BTCUSDT Bullish Rally Setup (Buy Limit Order)BTCUSDT has been in a long-term bullish trend and continues to maintain its upward momentum. Currently, the price is undergoing a minor pullback as it retests a key resistance level. Once it reaches the previous minor support zone, I expect the bullish trend to resume.
To take advantage of the next bullish move early, consider placing a buy limit order at that earlier minor support level. For proper risk management, set a stop loss slightly below the support area.
Everything is clearly illustrated on the chart provided.
BTCUSDT.P trade ideas
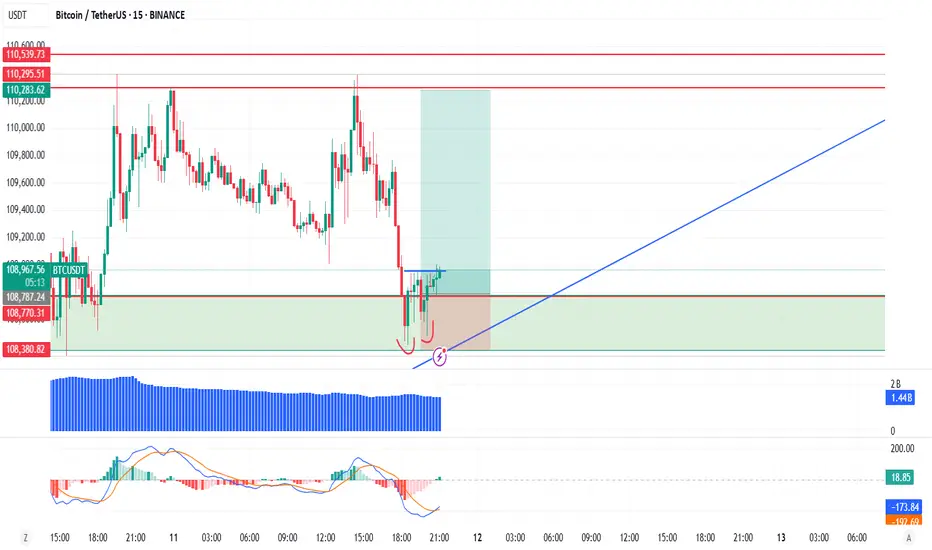
a scalp long opportunitya scalp long opportunity- btc forming a downle bottom a small scalp opptunity to 109500 and if possible 110000. lets see
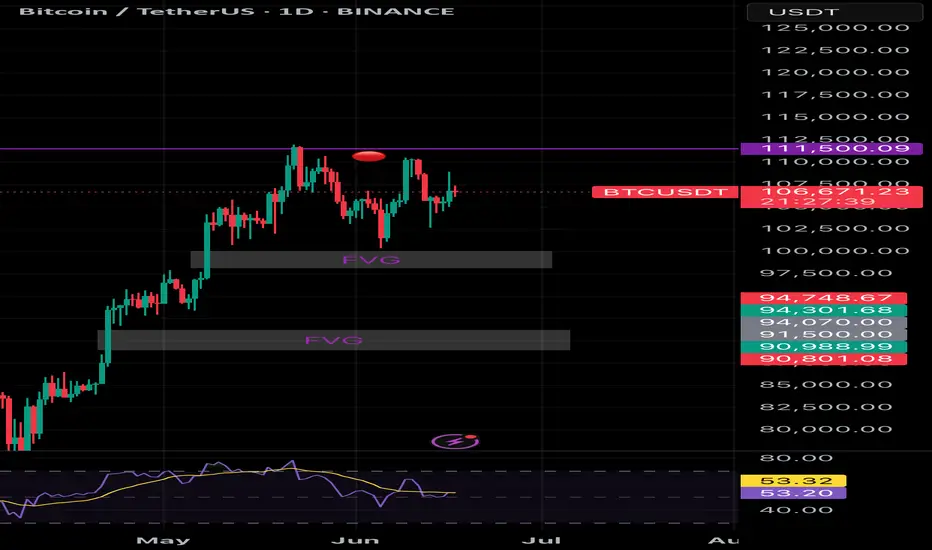
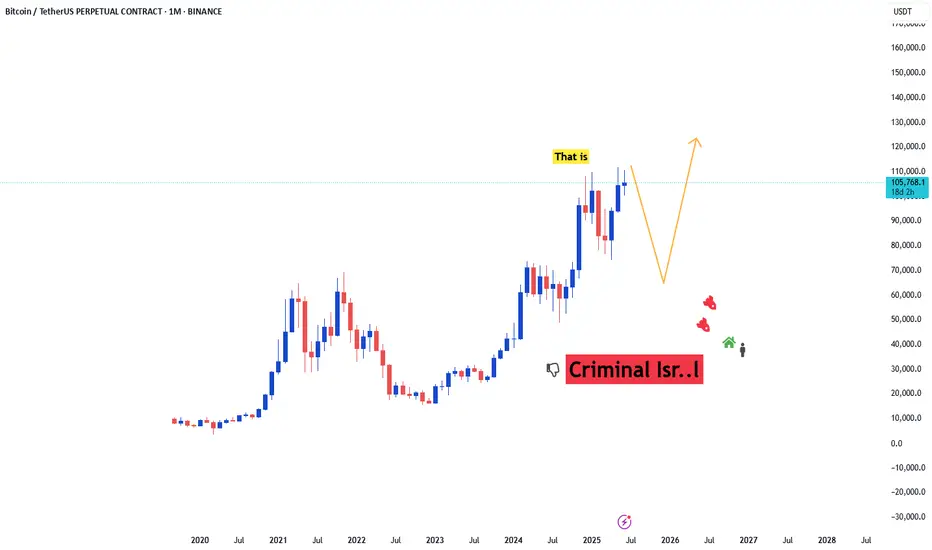
What is what I think BTC is bearish short to full the FVGs if you look very closely to the chart. Full the gaps and back up for a long
$BTC has seen neither wars nor crises nor antics.CRYPTOCAP:BTC has seen neither wars nor crises nor antics. But it is still here and still rising. What do you see in this chart? I do not recommend investing in the rise. I may be wrong about buying with what I wrote, but I am bullish flag technology in this chart. 100k 99k needles can be thrown but it will go up after closing the day under it.
Bitcoin at the Crossroads: Will BTC Breakout or Retest SupportBitcoin (BTC) – Testing Resistance, Ready for Reversal or Breakout
Technical Outlook — June 11, 2025
Current Market Condition:
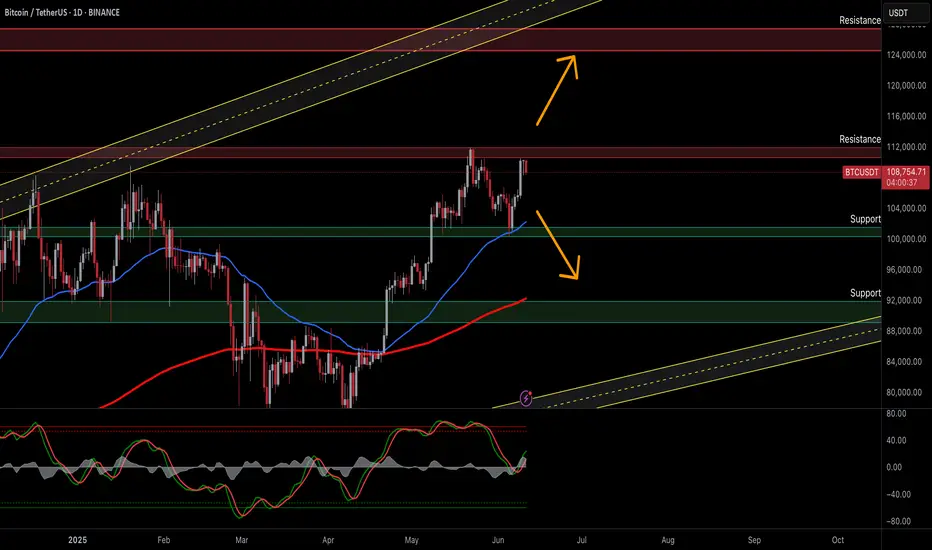
Bitcoin (BTC/USDT) is currently trading around $108,644 following a modest decline of -1.48% on the daily chart. After a bullish recovery from the $92,000–$96,000 zone, BTC has approached a strong resistance band near $112,000. The current structure suggests the market is in a critical phase — either poised to break higher or risk a deeper retracement toward key demand levels.
Key Technical Highlights:
Price is trading above the 50 EMA (blue) and the 200 MA (red), suggesting a bullish short- to medium-term bias.
The $112,000 zone is acting as a strong resistance, where BTC has previously faced rejections.
The ascending yellow parallel channel outlines the broader uptrend structure — BTC remains well within bounds, showing potential for continuation.
The Stochastic Oscillator is climbing, indicating building bullish momentum but nearing overbought territory, which could trigger short-term pullbacks.
Immediate supports are found near $104,000 and $96,000. A failure to hold above $104,000 could trigger downside pressure.
Trade Plan:
✅ 1. Bullish Breakout (Long) – Most Probable Scenario
Trigger: Daily close above $112,000 with strong volume and momentum
Target: $122,000 - $125,000
Stop Loss: Below $109,000
⚠️ 2. Bearish Rejection (Short) – Possible Scenario
Trigger: Bearish reversal candle at $112,000 or daily close below $106,000
Target: $102,000, then $92,000
Stop Loss: Above $111,000
📉 3. Dip Buy Setup – Last Scenario
Trigger: Price retests and holds $96,000 or $92,000 with a bullish reversal signal (e.g., pin bar, hammer)
Target: Immediate resistance at $104,000, then $112,000
Stop Loss: Below $91,000
Risk Management:
Always apply proper risk management, including clear stop-loss placement and responsible position sizing. Bitcoin can react aggressively to macroeconomic events and regulatory news — monitor sentiment closely when near major technical levels.
📢 If you found this analysis valuable, kindly consider boosting and following for more updates.
⚠️ Disclaimer: This content is intended for educational purposes only and does not constitute financial advice.
It Is Belief That Keeps Bitcoin Alive Above $100,000In recent weeks, following Bitcoin’s surge beyond the $100,000 threshold, a new collective sentiment has taken shape. Each rally strengthens the conviction of long-term holders, and each correction plants new seeds of optimism.
The true battle lies not in price fluctuations, but in ideology. For many, Bitcoin represents far more than a tradable asset it's a paradigm shift. They see institutional adoption, such as government-backed ETFs, not as a luxury but as a necessity. In contrast, short-sighted voices focus solely on speculative price gains, missing the broader vision.
What truly fuels this market is collective belief in the future. The steadfast resistance against recent sell-offs reveals a deep and growing confidence not shaken by volatility but shaped by it.
As the saying goes: For the believer, the struggle is not a barrier it is the path.

Bitcoin Strategic Interval, CME Dislocation and Macro Friction.⊢
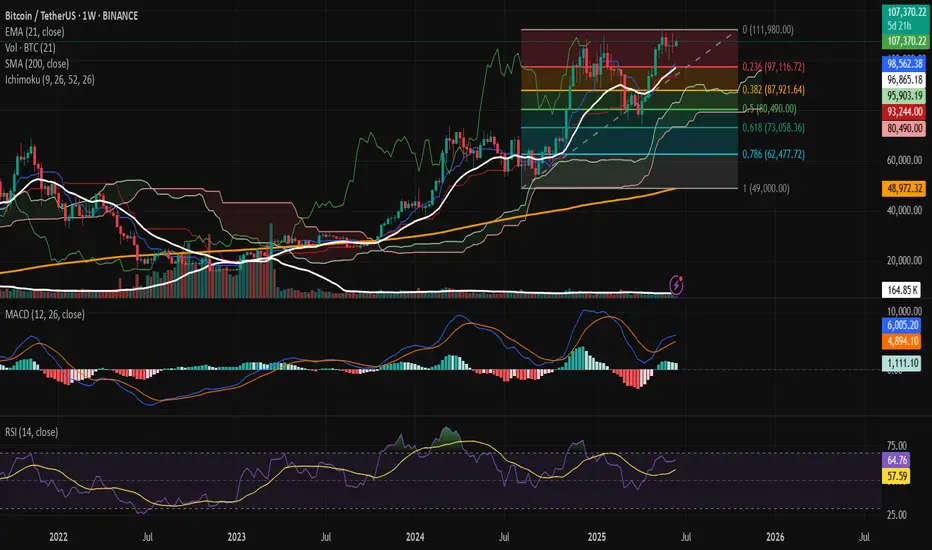
𝟙⟠ - BTC/USDT - Binance - (CHART: 1W) - (June 17, 2025).
⟐ Analysis Price: $106,851.31.
⊢
I. ⨀ Temporal Axis – Strategic Interval - (1W):
▦ EMA21 – ($96,818.00):
∴ The current candle closes +10.3% above the EMA21, maintaining bullish dominance over the mid-term dynamic average;
∴ This is the 17th consecutive weekly candle closing above the EMA21 since its reclaim in February 2025, forming a structurally intact uptrend;
∴ No violation or wick-close below the EMA21 has occurred since April, and the distance from price to EMA21 remains within a standard deviation of mid-trend movement.
✴ Conclusion: The trend is active and preserved. EMA21 acts as dynamic support and bullish pressure zone. A reversion would only be expected if weekly closes return below $98K with volume confirmation.
⊢
▦ SMA200 – ($48,969.73):
∴ The 200-week simple moving average remains untouched since early 2023, never tested during the current cycle;
∴ The slope of the SMA200 is positive and gradually increasing, indicating a long-term structural trend recovery;
∴ Price stands +118% above the SMA200, a level historically associated with mid-cycle rallies or overheated continuation phases.
✴ Conclusion: The SMA200 confirms long-term bullish structure. Its current distance from price makes it irrelevant for immediate action but critical as the absolute invalidation level of the macro trend.
⊢
▦ Ichimoku – Kumo | Tenkan | Kijun:
∴ Price is above the Kumo cloud, with Span A ($107,172.16) and Span B ($98,562.38) creating a bullish tunnel of support;
∴ The Kijun-sen rests at $95,903.19, slightly below EMA21, and aligns with the last strong horizontal range;
∴ Chikou Span is free from historical candles, confirming trend continuity under Ichimoku principles.
✴ Conclusion: All Ichimoku components are aligned bullish. Pullbacks to the Kijun around $96K would be healthy within a macro-uptrend, and only sub-cloud closes would question this formation.
⊢
▦ Fibonacci - (Swing Low $49,000 – High $111,980):
∴ Bitcoin remains between the (0.236 Fibo - $97,116.72) and local top at $111,980, showing respect for fib-based resistance;
∴ The (0.5 Fibo - $80,490.00) has not been retested since March, confirming the range compression toward upper quadrants;
∴ Weekly price is consolidating under fib extension with decreasing body size, suggesting strength with pause.
✴ Conclusion: The Fibonacci structure confirms bullish extension phase. If $97K breaks, retracement to (0.382 Fibo - $87,921.64) is expected. Otherwise, the breakout above $112K enters full projection territory.
⊢
▦ MACD – (Values: 1,077.98 | 5,963.81 | 4,885.82):
∴ MACD line remains above signal line for the third consecutive week, recovering from a prior bearish cross in April;
∴ The histogram has printed higher bars for four weeks, but the slope of growth is decelerating;
∴ Positive cross occurred just below the zero-line, which often results in delayed reactions or failures unless reinforced by volume.
✴ Conclusion: MACD signals a weak but persistent momentum recovery. Reaffirmation depends on histogram expansion above 1,500+ and signal spread widening.
⊢
▦ RSI – (Close: 64.37 | MA: 57.56):
∴ The RSI is in the bullish upper quadrant, but without overbought extension, suggesting active buying without euphoria;
∴ The RSI has been above its moving average since mid-May, maintaining a healthy angle;
∴ Momentum is not diverging from price yet, but is approaching the 70 zone, historically a point of hesitation.
✴ Conclusion: RSI confirms controlled strength. Further advance without consolidation may trigger premature profit-taking. Above 70, caution increases without being bearish.
⊢
▦ Volume - (16.97K BTC):
∴ Weekly volume is slightly above the 20-week average, marking a minor recovery in participation;
∴ There is no volume spike to validate a breakout, which is common in compressive ranges near resistance;
∴ Volume has been declining since mid-May, forming a local divergence with price highs.
✴ Conclusion: Volume profile supports current levels but does not confirm breakout potential. A rejection with strong volume will mark local exhaustion.
⊢
II. ∆ CME Technical Dislocation – BTC1! Futures:
▦ CME GAP – BTC1! – ($107,445.00):
∴ The CME Futures opened this week at $105,060.00 and closed the previous session at $107,445.00;
∴ A clear unfilled gap persists between $105,060.00 and $107,900.00, with price action hovering just above the top edge;
∴ Bitcoin has a consistent historical behavior of returning to close such gaps within a short- to mid-term range.
✴ Conclusion: The unfilled CME gap acts as a gravitational technical force. As long as price remains below $109K without volume expansion, the probability of revisiting the $105K area remains elevated.
⊢
III. ∫ On-Chain Intelligence – (Source: CryptoQuant):
▦ Exchange Inflow Total - (All Exchanges):
∴ Current inflow volume remains below the 1,000 Bitcoin daily threshold, indicating no panic selling or institutional exits;
∴ This inflow level corresponds to accumulation or holding phases, rather than distribution;
∴ The pattern matches a neutral-to-positive mid-cycle environment.
✴ Conclusion: There is no structural on-chain pressure. As long as inflows remain low, risk of capitulation or distribution is minimal.
⊢
▦ Spot Taker CVD - (Cumulative Volume Delta, 90-day) – (All Exchanges):
∴ The 90-day CVD shows continued dominance of taker buys over sells, reflecting ongoing demand strength in spot markets;
∴ However, the curve is flattening, suggesting buyers are meeting resistance or fading interest;
∴ No sharp reversal in the CVD curve is detected — only saturation.
✴ Conclusion: Demand remains dominant, but the pace is decelerating. Without renewed volume, this curve may revert or plateau.
⊢
▦ Exchange Inflow Mean - (MA7) – (All Exchanges):
∴ The 7-day moving average of exchange inflow continues to decline steadily;
∴ This metric often precedes calm phases or pre-breakout plateaus;
∴ Historical patterns show similar inflow behavior before prior volatility expansions.
✴ Conclusion: A period of silence is unfolding. Reduced mean inflow suggests price is awaiting external catalysts for movement.
⊢
▦ Funding Rates – (Binance):
∴ Current funding rates are neutral, with slight positive bias, suggesting balanced long-short sentiment;
∴ No extreme spikes indicate absence of excessive leverage;
∴ This equilibrium typically precedes significant directional moves.
✴ Conclusion: Market is leveled. Funding neutrality reflects hesitation and prepares ground for upcoming directional choice.
⊢
IV. ⚖️ Macro–Geopolitical Axis – (Powell, Middle East & BTC/XAU):
▦ MACRO CONTEXT:
∴ Jerome Powell is scheduled to speak on Wednesday (June 19), with markets anticipating remarks on rate stability or future hikes;
∴ Ongoing tensions in the Middle East (Israel–Iran) elevate risk-off behavior in traditional markets;
∴ Bitcoin has triggered a rare Golden Cross vs. Gold, as noted by U.Today, signaling digital strength over legacy value.
✴ Conclusion: Macro remains the primary external catalyst. Powell’s statement will determine short-term volatility. Until then, Bitcoin floats between its technical support and CME magnetism, with gold dynamics providing long-term bullish backdrop.
⊢
⚜️ 𝟙⟠ Magister Arcanvm – Vox Primordialis!
⚖️ Wisdom begins in silence. Precision unfolds in strategy.
⊢
BTC/USDT Double Top Breakdown – Bearish Target in PlayBTC/USDT – 1H Chart Analysis (Binance)
The chart shows a bearish setup based on Smart Money Concepts (SMC) and price action.
Key Points:
Rising Wedge: A bearish pattern formed earlier, indicating a weakening bullish move.
Top 1 & Top 2: Double-top structure suggesting strong resistance around 106,000.
CHoCH & BOS: Multiple Change of Character (CHoCH) and Break of Structure (BOS) confirm the shift from bullish to bearish trend.
Breakdown Zone: After forming Top 2, price broke below key structure zones.
Target Zone: Marked in green and pink below 104,000, showing a bearish continuation toward 102,000 area.
Strong Low: This zone is highlighted as the next major support where price could react.

Sell Bitcoin and buy Altcoins!🚨 Controversial Take Ahead – Packed With High-Value Insights 🚨
Let’s dive deep.
👨💻 A bit about me:
I’ve been riding the tech wave since the beginning:
Programmed video games in the 80s and 90s
Built VSTi plugins in the early 2000s
Started creating websites when Internet Explorer 1.0 launched
Sold 3D assets when Unity 2.5 (first PC version) dropped
Launched my own blockchain in 2016
Deployed smart contracts on TRON in 2018
I don’t follow trends—I predict them. My instincts are backed by decades of hands-on experience.
Now, here’s what I see coming:
⚠️ 1. Sell Your Bitcoins
Yes, Bitcoin is obsolete. It’s a technology—not a precious metal—and like all tech, it must evolve or die.
Ask yourself:
Do you use a Blackberry today?
Still flying in 1930s planes?
Gaming on an Atari or Commodore 64?
Surfing the web with Lycos or Altavista?
No? Then why are you betting on a 2009 technology?
Most people don’t even understand how Bitcoin works—ask around what SHA256 or RSA means.
Crypto is misunderstood, and that’s dangerous.
Back in 1998, I created the UPL library, which handled data compression & encryption using all major algorithms—Huffman, LZSS, DES, RSA, etc. I’m not just throwing words around—I’ve built this stuff.
Politicians and financial institutions (yes, even Saylor) are 15 years late to Bitcoin. They're missing the truth: BTC’s upgrades failed (Ordinals, Runes, etc). Its value holds due to FOMO from the uninformed, not innovation.
One day, your Bitcoins will be as worthless as mp3.com stock. That’s not opinion—that’s technological reality.
🪙 2. Buy Altcoins
Not every altcoin is a winner—but that’s where the real opportunity is.
Remember:
Nokia and Blackberry ruled before Samsung and Xiaomi.
The next Amazon, Google, or Nvidia already exists—and it's trading for pennies.
When people laugh at altcoins, that’s the time to buy low.
Altcoins like CRYPTOCAP:SOL , CRYPTOCAP:SUI , MIL:UNI could 100x… even 100,000x.
Bitcoin might double—and then crash.
Smart traders buy when everyone else is mocking.
🌍 3. Consequences of the BTC Collapse
This collapse will come at a turning point in global power.
Wall Street and U.S. states are heavily exposed to BTC. If it crashes, the Western financial system could implode—a dot-com-level disaster.
China, on the other hand, is stable, adaptive, and tech-forward.
Crypto without staking, DeFi, NFTs, GameFi, smart contracts? That’s not the future—that’s Bitcoin. Altcoins are the future.
Bookmark this post. Re-read it in 10 years.
You’ll remember I said it first: Innovation is unstoppable.
Enjoy the last Bitcoin pump. Then watch what comes next.
DYOR.
#CryptoRevolution #AltcoinSeason #BitcoinCollapse #Web3Future #BlockchainInnovation #SellBitcoin #BuyAltcoins #CryptoTruth #DeFi #GameFi #SmartContracts #CryptoShift #UnstoppableInnovation
It can beTo reach higher prices, you must definitely collect fuel and this fuel we have eaten the traders.!!
It can be
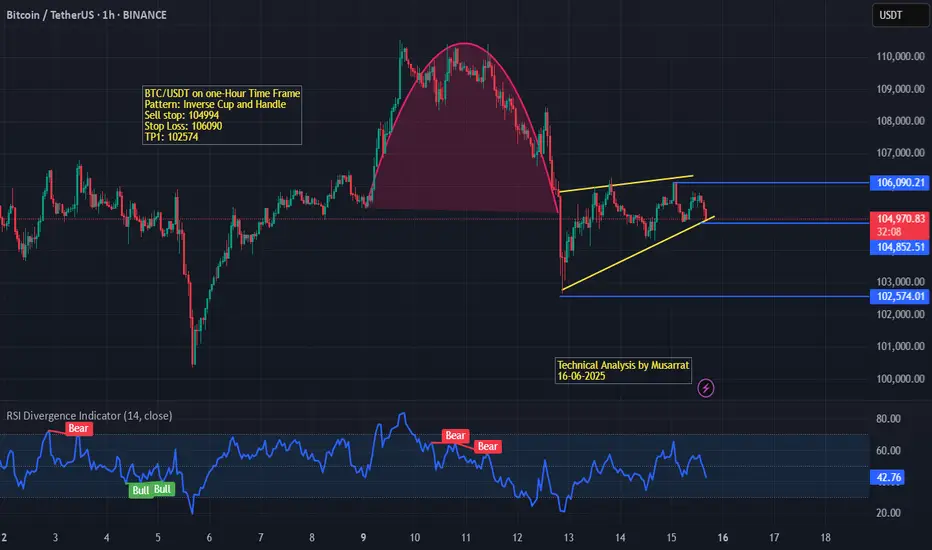
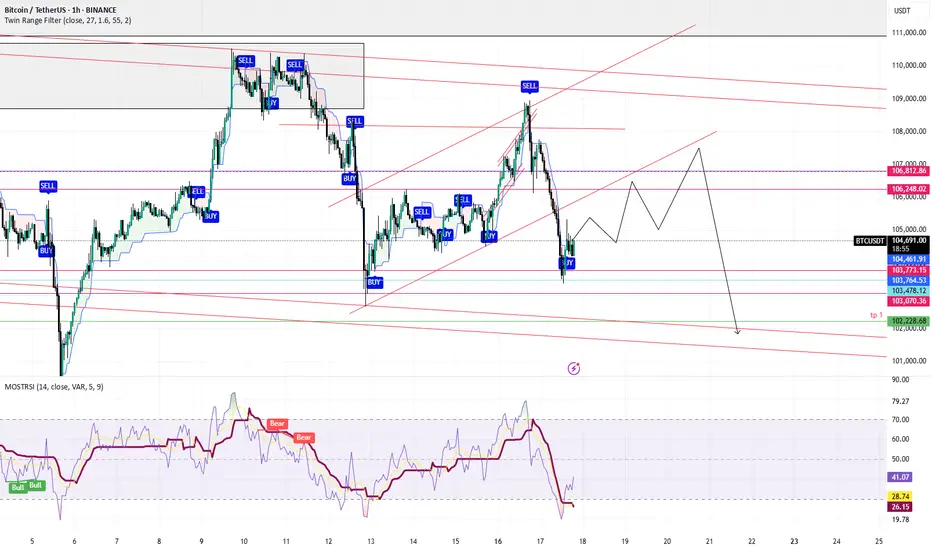
BTC/USDT on one-hour Chart ProjectionsThe chart illustrates a classic Inverse Cup and Handle pattern formation. The cup is clearly marked by a rounded top, indicating a reversal structure forming after a previous uptrend. Following the breakdown from the right rim of the cup, the price action has transitioned into a bearish consolidation, forming a potential rising wedge or weak bear flag – both of which typically indicate continuation to the downside.
Key Levels & Trade Setup:
Sell Stop: 104,494
Stop Loss: 106,090
Take Profit 1 (TP1): 102,574
These levels suggest a short-selling strategy with a favorable risk-to-reward setup targeting the breakdown of the handle portion of the pattern.
Indicators:
RSI (14, close) is currently at 42.95, which lies in the neutral-to-bearish territory.
Multiple Bearish RSI Divergences were signaled before the recent drop, supporting the short thesis.
Minor Bullish RSI signals were observed earlier but failed to sustain momentum above the 50 line.
Conclusion:
The technical structure, along with bearish RSI signals and pattern confirmation, suggests that BTC/USDT is likely to experience further downside, especially if price breaks below the 104,494 support. A breakdown from the current ascending structure could lead to the 102,574 support zone being tested in the near term.
Trade #12: $BTC - Bullish Alignment Confirmed! Long Setup WatchRecap & Lesson Learned:
In Trade #11, I noted the daily structure was strongly bullish, but the 1HR chart was bearish. My expectation was for price to dip toward the 98,000 daily demand zone. However, the 1HR structure reversed structure before reaching that level — a reminder that markets don’t always follow our ideal path.
The Shift: Timeframe Synced = Conviction Amplified!
Now, BOTH daily AND 1HR structures are BULLISH and aligned. This synchronization signals robust momentum, and I’m positioned fully bullish — awaiting the right technical trigger to enter a long trade.
The Opportunity: Precision Entry at Demand
I’m eyeing the green demand zone near 106,500 for a potential long entry. This is where buyers previously stepped in aggressively, making it a high-probability reaction area.
Key Refinement: Patience & Confirmation
(Learning from Trade #11):
I will NOT enter blindly at 106,500. Instead, I’ll:
1️⃣ Watch price behavior for signs of strength
2️⃣ Confirm my entry criteria are met
3️⃣ Execute ONLY if evidence validates the setup.
Why This Discipline?
"It’s better to enter slightly higher WITH confirmation than chase a ‘sniper entry’ without confirmation."
No confirmation = No trade. Period.
My Plan:
WAIT for price to test ~106,500.
CONFIRM buyer strength and alignment with my rules.
EXECUTE a long position only if all boxes are checked.
Stay Alert, Stay Patient.
The trend is our friend — but only if we respect its rhythm. Updates to follow!
✅ Key Takeaways:
Daily + 1HR = Bullish Synergy.
Watch 106,500 for a confirmed long entry.
No confirmation = No trade. Discipline over FOMO.

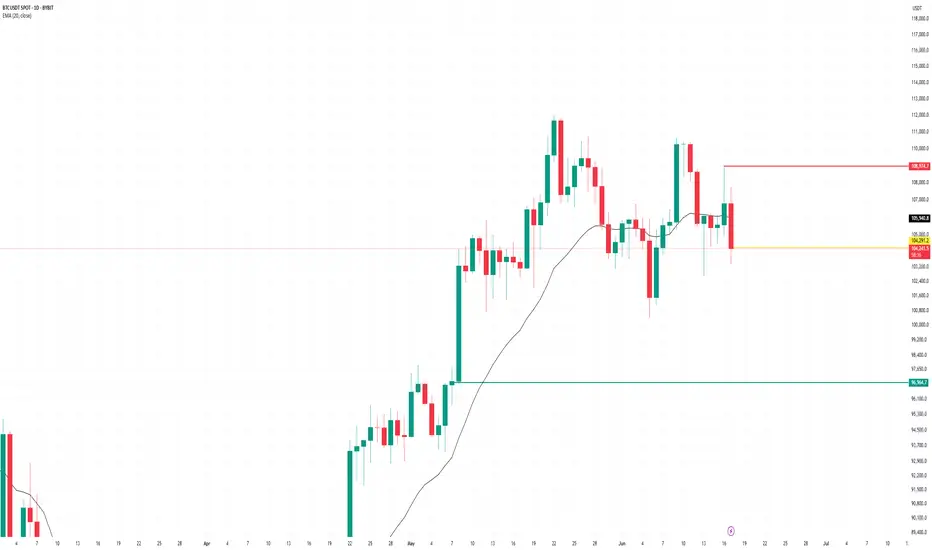
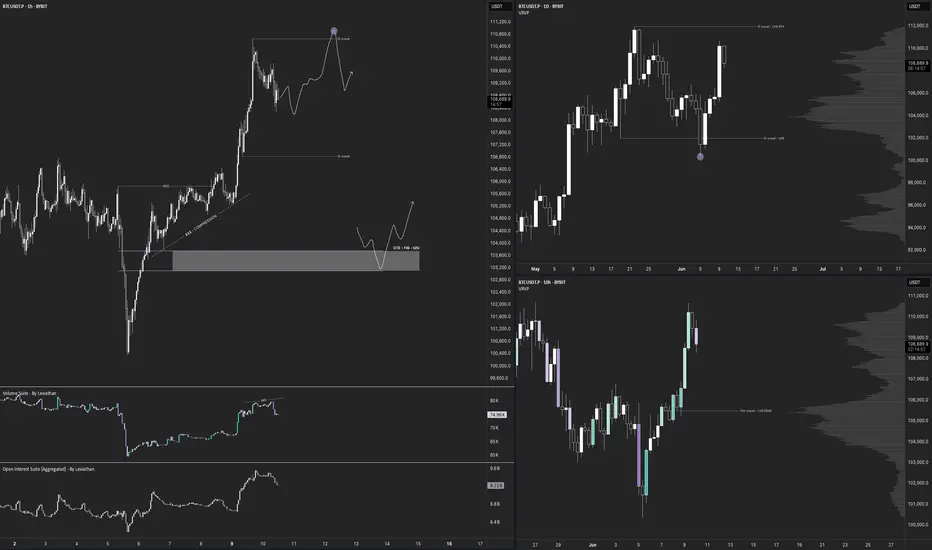
$BTC - Top Down BYBIT:BTCUSDT.P Top Down (10/06/25)
V-Levels Bias
Weekly = Bullish
Daily = Bullish
10-Hour = Bullish
1-Hour = Bullish
V-Levels Momentum
Weekly = Bullish
Daily = Bullish
10-Hour = Neutral
1-Hour = Neutral
Analysis & Insights
DeCode Market Breakdown
Macro Context
Overall, the Weekly structure remains bullish — both in bias and momentum. We’re trading below a key level at $111,968.0, and continuation is likely unless we see a clear Failed Auction at that level.
That would trigger some serious red flags and force a reevaluation of the directional bias.
Daily Chart
Daily structure is extremely bullish at the moment.
The price recently showed a Failed Auction around the $102,000.0 V-structure Higher Low — indicating aggressive absorption and buyer strength.
As long as price holds above that area, the priority is to stay on the long side.
⸻
10-Hour Chart
Still holding a bullish structure overall.
One thing I’ll be watching closely: the price reacting to the previous High at $110,660.8.
If we get a rejection + Failed Auction at that level, that opens up the possibility for intraday shorts; as a short-term shift in momentum and local resistance kicks in.
1-Hour Chart
📈 Long Setup: Waiting for a clean entry from an OTE / Fib zone + Over/Under structure.
📉 Short Setup: Watching for a sweep of the current highs + a clear Failed Auction (ideally with footprint confirmation).
There’s visible compression between $104k and $105k, so price might look to grab liquidity there first before any real move upward.
10-Min Chart
Currently, no clear trade setups on the 10M.
The 1H hasn’t reached optimal trade zones yet. I’ll be watching closely for any structure shifts or setups aligning with the macro bias.
⸻
🔍 Trading Plan Summary
Bias: Bullish (Weekly + Daily)
Look for longs aligned with HTF support + intraday confirmation
Short opportunities only if we get clear rejection from $110,660.8 + footprint signals
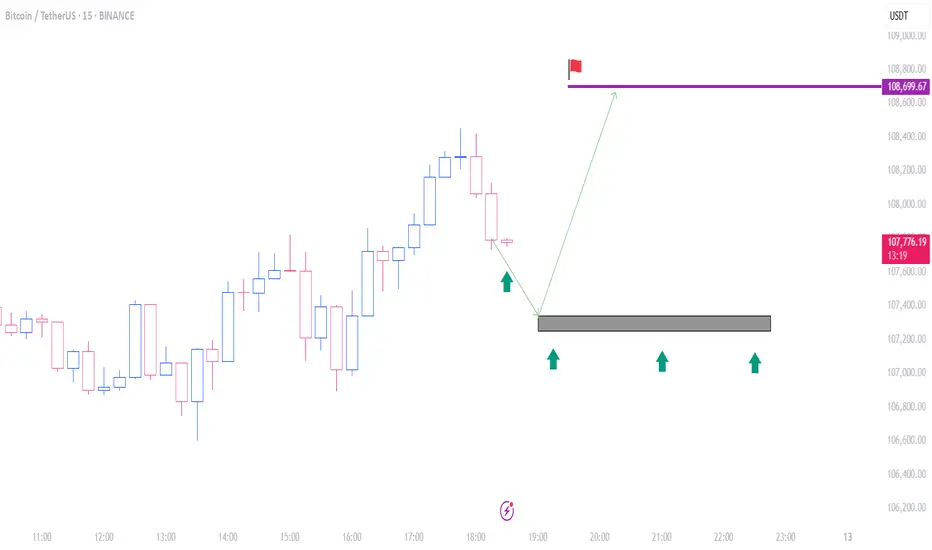
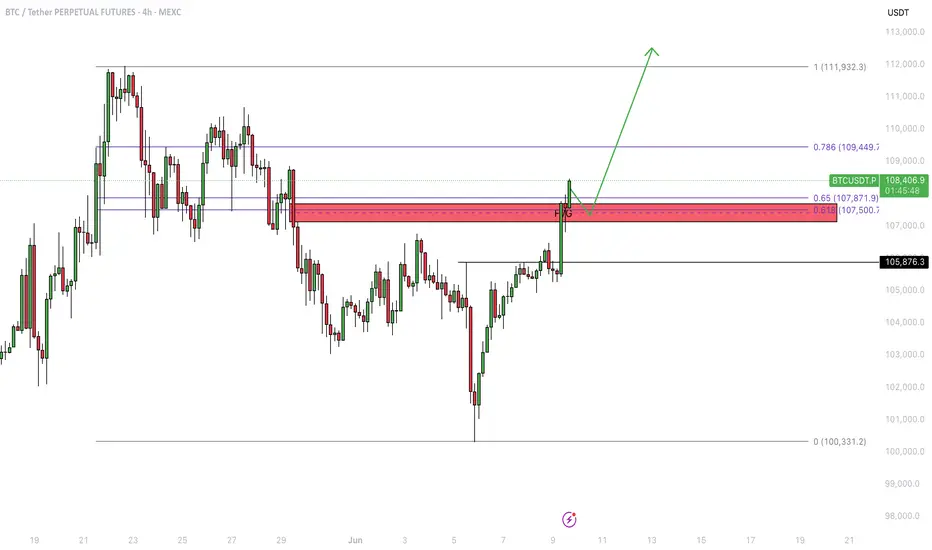
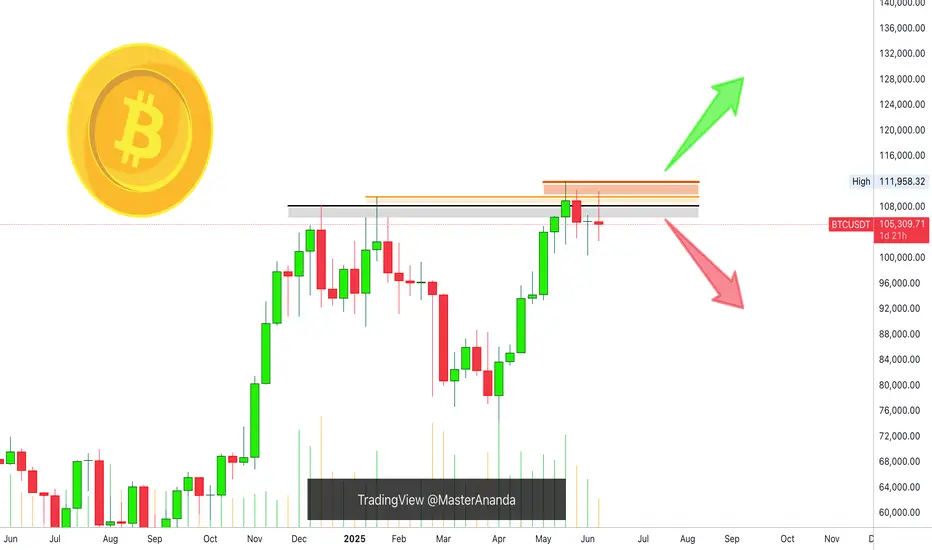
Bitcoin - Showing strength as it breaks key resistance levels!Bitcoin (BTC) recently demonstrated impressive strength by bouncing off a well-known confluence zone consisting of the golden pocket and a 4-hour fair value gap (FVG) around the $100,000 level. This technical area has historically acted as a reliable support and once again proved its significance, offering a solid foundation for the current rally.
Following this bounce, BTC surged to $108,000, decisively breaking above the 4-hour FVG near $107,000. With this breakout, the previously resistant zone is now expected to flip into support, adding further confidence to the bullish outlook. This type of price action is often seen in strong uptrends, where key resistance levels are reclaimed and converted into support, providing a base for further upside.
Importantly, BTC has also managed to push through the golden pocket resistance, a critical Fibonacci retracement area closely watched by traders. This breakout, in conjunction with the 4H FVG clearance, clears the path for a potential continuation toward Bitcoin’s all-time high.
Momentum is clearly building. Buying pressure is strong, and retracements have been shallow, indicating a market dominated by demand. While this is a bullish sign, a brief pullback or bounce off the newly formed support (the 4H FVG zone) would be healthy. Such a move would allow BTC to consolidate and build strength before potentially pushing toward new highs.
Overall, the technical landscape looks increasingly favorable for BTC. As long as it holds above the reclaimed support zones, the path to retesting, and possibly surpassing, the all-time high appears wide open.
Thanks for your support.
- Make sure to follow me so you don't miss out on the next analysis!
- Drop a like and leave a comment!
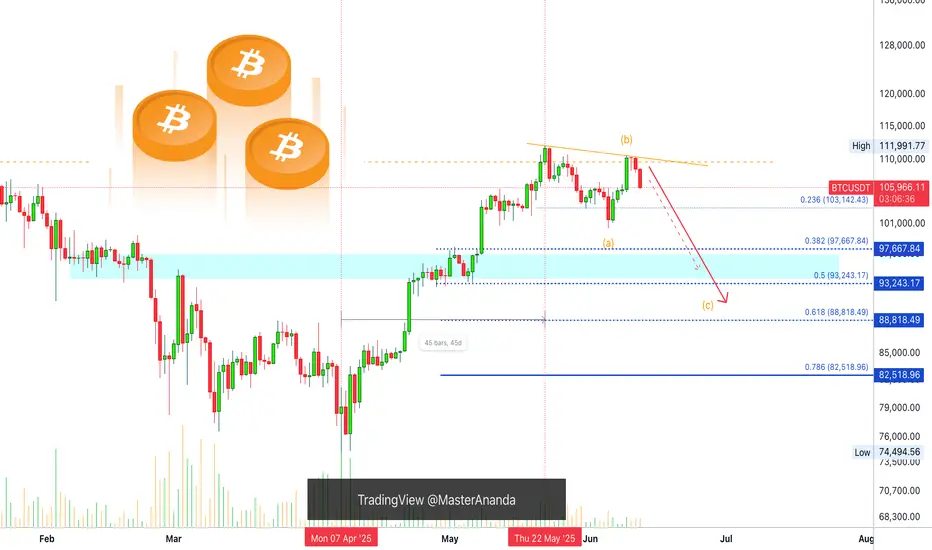
Bitcoin's Correction Confirmed, 93-97K Next TargetBitcoin's bearish continuation is now confirmed with three consecutive days of bearish action, today being a full red candle.
Good afternoon my fellow trader, how are you feeling today?
Opportunities are endless in this market, and if you trade, you can profit from the bullish as well as the bearish waves. Good entry timing is all that is needed for a successful trade, the right map and mindset.
So the lower high is confirmed and today's action confirms an incoming lower low. The 100K support is very likely to break but this is not written in stone. This is a high probability scenario. We are aiming for a price range of $97,000 - $93,000. But this isn't necessarily the end. Depending on how this level is handled, we will be able to know if prices will go lower or what.
$88,000 is a good level in the case there is strong bearish volume when the above price range is challenged as support. Now it is all a wait and see. Patience is key.
Once the a new support zone settles, we adapt to the market and focus on green. The next step is red. Down we go.
Thank you for reading.
Namaste.
Bitcoin Breaks 20-Jan 2025 Peak Price, New ATH Next (+Altcoins)Look at this, Bitcoin closed the day exactly above the 20-Jan 2025 high. This day Bitcoin peaked at $110,265, the all-time high before May; yesterday, 9-June 2025, Bitcoin peaked at $110,577.4 but closed at $110,270, five dollars higher. Is this a bearish or bullish signal? What to expect!
Good evening my fellow Cryptocurrency trader, I hope you are having a wonderful day.
This week starts with a bang, a big bang, with Bitcoin doing great. The question immediately arises and I will answer, Will Bitcoin continue growing? Or, will Bitcoin produce a retrace?
I can tell you with 100% certainty that Bitcoin will continue to grow. I can support this statement with data from the charts.
We have hundreds and hundreds of altcoins going bullish, strongly bullish, some coming out of a new all-time low. If Bitcoin was set to crash, these altcoins wouldn't be gaining in bullish momentum, they would be diving deep much lower in order to create new lows. But this isn't what is happening this week, last week and today, no! What we are seeing now is huge growth across the altcoins market and this confirms what Bitcoin will do next.
Needless to say, as Bitcoin trades near its all-time high this is extremely bullish.
If a new all-time high is hit but the action moves lower, say 10-15% lower and remains there, this is bearish and points to lower prices. If the action remains very close to resistance, as it is now, this is ultra-bullish. It is simple do you agree?
Because when there is an incoming drop many people in the know start to sell, so the action never stays at resistance there is always a strong rejection with high bearish volume.
On the other hand, when resistance is challenged and continues to be hit over and over, or the action stays very close, it simply means that people are buying, holding and ready for growth. Bitcoin will continue moving higher mark my words. It is very easy because this has been confirmed long ago.
The bottom was hit 7-April and we are now experiencing long-term growth. As Bitcoin continues to trade near its all-time high, the altcoins will blow up.
When Bitcoin grows 20-30%, some altcoins can grow 100-200%. When Bitcoin grows 50%, some altcoins can grow 300-500%. This is the 2025 bull market.
Thank you for reading.
Give me a boost if you trade and profits from the altcoins market.
Namaste.
P.S. Leave a comment with your favorite altcoins, I will consider the pair for a few full analysis.

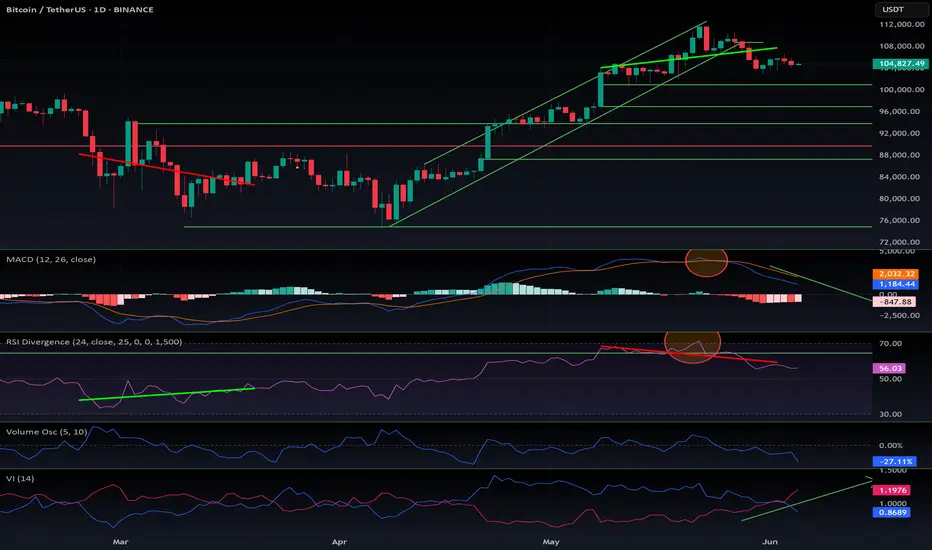
Bitcoin’s Final Wave & Time Reversal Zone _ New ATH Loading?Today, I want to analyze Bitcoin ( BINANCE:BTCUSDT ) on the weekly time frame and answer these questions :
Can Bitcoin create a new All-time High(ATH) or not!?
At what price range can Bitcoin's uptrend end!?
When can we expect the uptrend to end!?
Please stay with me.
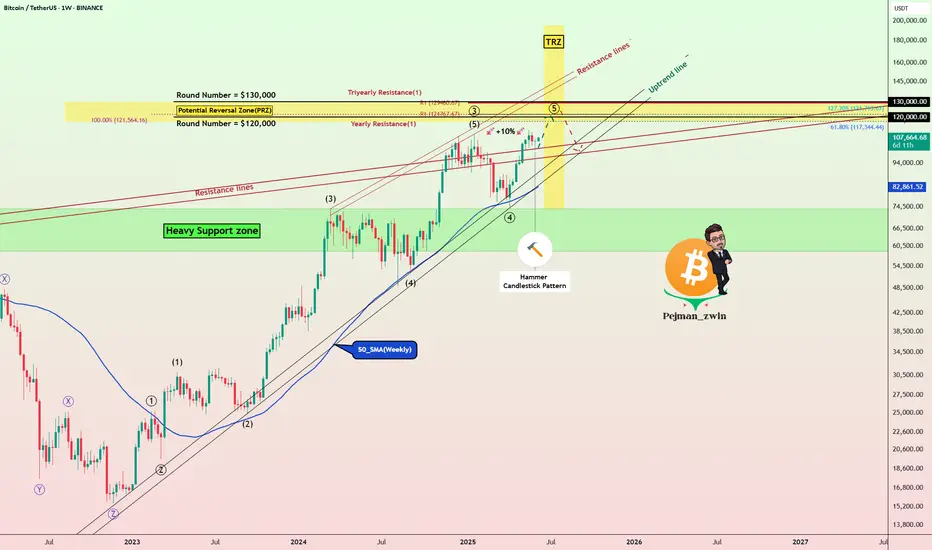
Bitcoin appears to have managed to break the Resistance lines , although we saw a fake break a few months ago , and it also appears to have a Hammer Candlestick Pattern in the previous weekly candle , which could signal the completion of Bitcoin's pullback to the Resistance lines(broken).
In terms of time , if we want to analyze the Bitcoin chart and look at Bitcoin's past, in general, the months of June(Average=-0.13%/Median=+2.20%) and especially July(Average=+7.56%/Median=+8.90%) have been among the most productive months for Bitcoin , and the months of August(Average=+1.75%/Median=-8.04%) and September(Average=-3.77%/Median=-4.35%) were the months when Bitcoin had a correction . Technical analysis tools show the end of the upward trend and the beginning of Bitcoin's correction at the Time Reversal Zone(TRZ=June 23 to August 4) .
In terms of Elliott Wave theory , Bitcoin appears to be completing the main wave 5 , as the main wave 3 was extended .
I expect Bitcoin to trend higher(+10%) in the coming weeks and create a new ATH . New ATH could be created in the Potential Reversal Zone(PRZ) and TRZ , and then we can wait for the start of the main correction .
What do you think about Bitcoin’s future movement? Can Bitcoin create a new ATH? When and at what price?
Note: If Bitcoin falls below $100,000, we should expect further declines.
Please respect each other's ideas and express them politely if you agree or disagree.
Bitcoin Analyze (BTCUSDT), weekly time frame.
Be sure to follow the updated ideas.
Do not forget to put a Stop loss for your positions (For every position you want to open).
Please follow your strategy and updates; this is just my Idea, and I will gladly see your ideas in this post.
Please do not forget the ✅' like '✅ button 🙏😊 & Share it with your friends; thanks, and Trade safe.
Bitcoin Weekly: Bullish & Bearish ScenariosThis is the definitive analysis based on the weekly timeframe. Depending on how the weekly session closes the market trend will be defined. Bitcoin is both bearish and bullish. Let me explain.
» If Bitcoin can move and close weekly above $110,000, market conditions are considered bullish and we can expect higher prices.
» If Bitcoin moves and closes weekly below $100,000, market conditions are considered bearish and we can expect lower prices.
» Any trading between $100,000 and $110,000 can be considered consolidation. Since the main move is an advance starting 7-April, the consolidation has a bullish bias; makes sense?
It is a bullish bias but a bullish continuation is not confirmed. Bitcoin peaked the 19-May week, a new all-time high. Then it produced a lower high this week. This implies bearish potential and bearish pressure.
» If this week closes above last weeks high, around $107,000, we can say the bulls are gaining ground.
» If this week closes at the open or lower, say $105,000 or lower, then the bears are gaining the upper-hand a lower low becomes more likely.
It has not been decided, anything goes. Anything can happen because Bitcoin will not die, trading won't end if prices move below 100K. This would simply lead to a bounce and a recovery later down the road.
It also works in reverse, if Bitcoin moves higher, nothing happens, the market will continue to be and exist, it will continue to grow and evolve.
Right now we are mixed, this is a decision point. The action is determined by the price, depending on what prices we get we can know what comes next. Since the week is yet to close, we remain in doubt but the bearish bias has the upper-hand short-term.
Short-term bearish potential is strong based on the ath, triple-top and lower high.
Mid-term the market is in a bullish trend facing resistance. The wave from 7-April through present day.
Retraces and corrections are normal.
Long-term Bitcoin is bullish, because it has been growing since November 2022.
Thank you for reading.
👉 If you would like to see an update when the week closes hit boost!
Namaste.
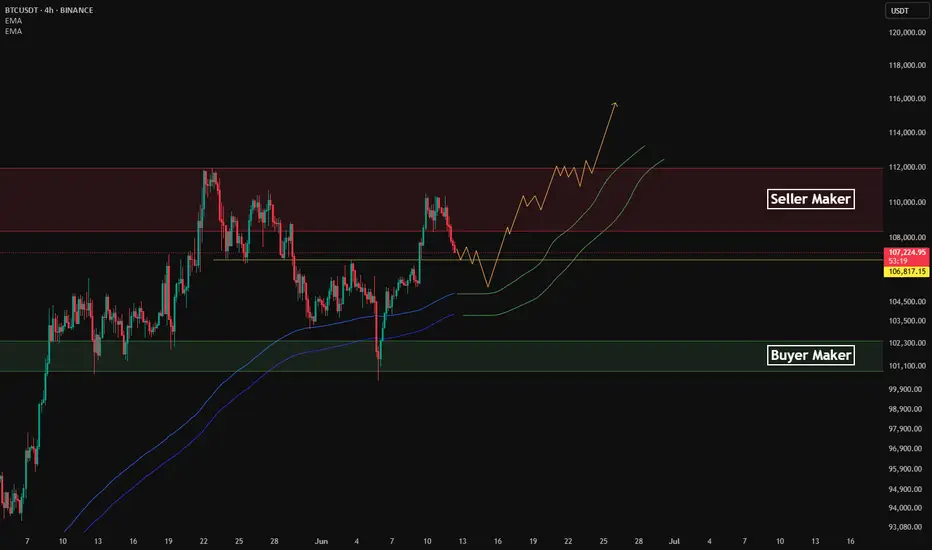
Bitcoin Probabilistic Analysis in the 4-Hour TimeframeIf Jerome Powell lowers interest rates today, we will likely see this trend.
Based on MAKER buy/sell signals and the High/Low of the EMA 200 indicator.
Bitcoin Short-Term 4H Timeframe, Still Bullish But...Bitcoin continues bullish on the 4H timeframe and we have some positive signals coming out of the most recent swing and shakeout.
» The action went below 0.618 but is back above this level.
» The higher low did not reach 0.786 Fib. retracement support, which is a signal of strength.
» Trading volume continues to rise and as the action happens above $100,000, this signal works in favor of the bulls.
Short-term, Bitcoin continues green with the bulls in full control of the chart. When in doubt, zoom out; Crypto is going up.
This is obviously a consolidation pattern because we have higher lows but also lower highs. The revealing signal of course comes from the altcoins, look at Bitcoin Cash and you can get a good example.
The market will resolve bullish once the consolidation ends.
I say this based on market data and the charts.
If you agree leave a comment.
Thank you for reading.
Namaste.