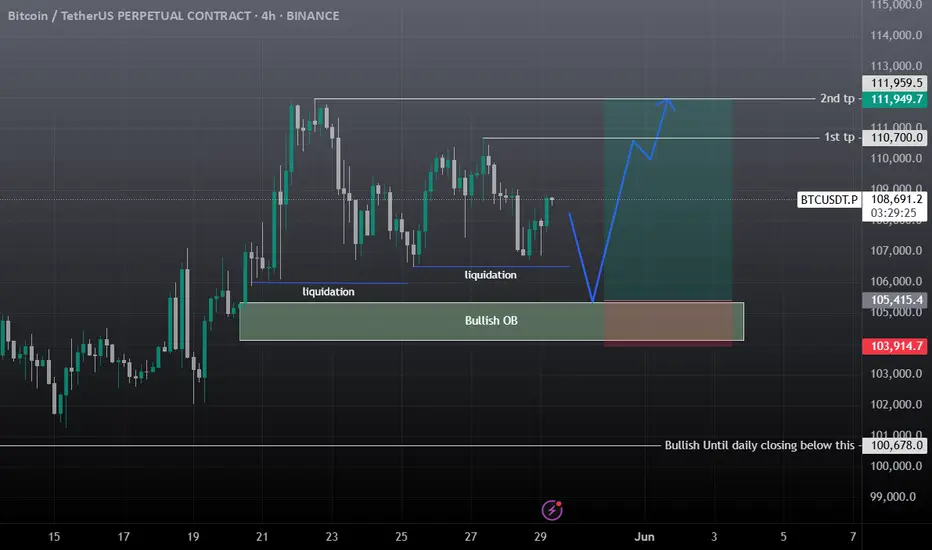
BTC Scalp Long / Buy SetupWait for the entry first, BTC must sweep the liquidation levels below side first then it should start pumping towards the tp, if it takes 2nd tp first then trade is not valid, if it takes first tp and then come back at entry level trade is still valid. if 4hr candle closing below the Bullish OB then close the position otherwise wick doesn't matter.
BTCUSDT.P trade ideas
BTC WHAT IF?⚠️ MACD Divergence (30M)
Visible bullish divergence forming on the 30-minute chart.
There's a lot of liquidity resting below market could trigger a max pain scenario before any reversal.
BTCi think that BTC it ill revert to 97-96k
chart is showing overbought conditions and market has not liquidity.
time will tell.

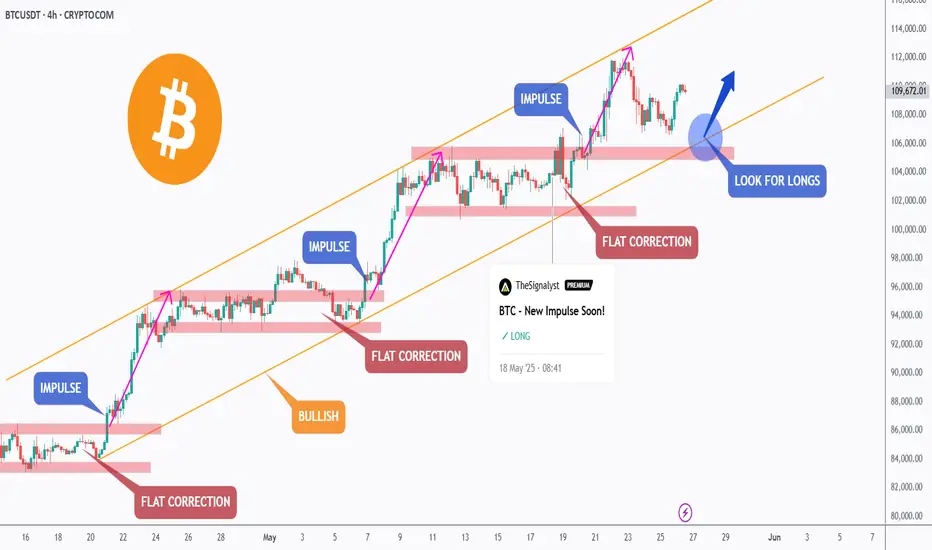
BTC - Let's Do It Again!!Hello TradingView Family / Fellow Traders. This is Richard, also known as theSignalyst.
📈 As per our last analysis (attached on the chart), BTC rejected the lower orange trendline and moved higher as expected! ✅
🔄 BTC is now retesting the lower trendline again, so we’ll be looking for new trend-following buy setups as long as the red structure at $105,000 holds!
📚 Always follow your trading plan regarding entry, risk management, and trade management.
Good luck!
All Strategies Are Good; If Managed Properly!
~Rich
DeGRAM | BTCUSD continues to move in the channel📊 Technical Analysis
● 108.7-109 k has held for the fourth time, flipping the purple retest line into solid support; each bounce prints a higher low, sketching a rising triangle inside the medium-term channel.
● A 6 h close above the triangle cap at 111.2 k should unleash a measured 13 k thrust toward the channel’s roof / red supply at ≈122 k.
💡 Fundamental Analysis
● Glassnode shows another 24 k BTC left exchanges in May while US spot ETFs recorded five consecutive inflow days, tightening tradable supply even as macro volatility fades.
✨ Summary
Buy 108-110 k; breakout >111.2 k targets 115 k → 122 k. Invalidate on a 6 h close below 105 k.
-------------------
Share your opinion in the comments and support the idea with a like. Thanks for your support!

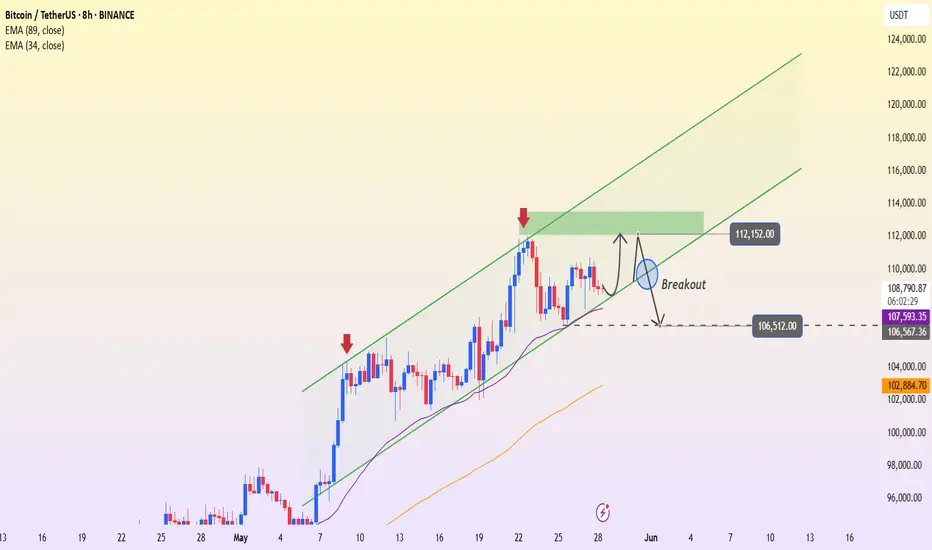
BTC breakout soon and return to ATH💎 Update Plan BTC (May 29)
Notable news about BTC:
The overall cryptocurrency market capitalization has remained relatively stable over the past 24 hours, hovering near the $3.42 trillion level. Digital assets appear largely indifferent to the recent rally in equities, as gains in traditional markets are driven by corporate earnings and tariff-related developments rather than shifts in monetary policy or liquidity conditions. Meanwhile, the US Dollar is strengthening for a third consecutive session, adding further pressure.
Bitcoin (BTC) has pulled back from the upper end of its recent trading range near $110,000, settling closer to the $107,000 mark. This pause near previous highs has helped ease short-term market overheating. As institutional participation in Bitcoin deepens, its price behavior is increasingly mirroring that of traditional financial instruments like equities and commodities—marked by more tempered momentum and fewer fear-driven surges.
Technical analysis angle
It is still a 107k bumper area that brings profits to Buyer. But the worrying thing here is that the vertices of BTC are lower.
We will have two scenarios for BTC:
) First within the next 1 week, the organizers still go in this flag model and gradually narrow towards the top. If the price line follows this model, it will be negative for BTC and investors
) Secondly: BTC price will breakout area 109k, the target will go straight to 113k-115k and lower boundary if Breakout area 107k will return to 102k-100k
🔥BTC 4H is currently in the adjustment phase, this time will cause a lot of traders, Future - Margin to lose money, this rhythm will last long
At this time, whether new or old, should spend more time to practice, load more knowledge about the PTKT, as well as find knowledge posts at the channel ..., to strengthen the solid foundation, as well as avoid losing money at this time offline
==> Comments for trend reference. Wishing investors successfully trading
Bitcoin will fall to support line of channel and then rebound upHello traders, I want share with you my opinion about Bitcoin. Bitcoin spent a considerable period trading within a horizontal range, bounded by the buyer zone around 92000 - 93000 points and the upper boundary just below 103000 points. Throughout this phase, the price respected both limits, bouncing between support and resistance, forming a stable consolidation base. Eventually, BTC broke out of this range with a strong bullish impulse, entering a clearly defined upward channel. Since then, price action has been guided by the structure of this rising channel, consistently forming higher highs and lows. Multiple clean retests of the support line confirm the integrity of the trend, and recent movement shows BTC pulling back from mid-channel after a short-term correction. Now the price is approaching the support area between 102000 - 103000, which aligns with the channel’s lower boundary. Given the pattern’s consistency and strength in previous rebounds, I think BTC can correct to the support line and continue to grow. For this case, I set my TP at 113000 points, near the resistance of the upward channel. Please share this idea with your friends and click Boost 🚀

Bitcoin (BTC): Fight Over Current Zone | Buyers HoldingThe fight keeps going on where both buyers and sellers are showing strong dominance with momentum candles. We are being patient here; we see that buyers still manage to hold the current zone but also we see the attempts by sellers to dump it from here.
Nevertheless, all those sell attempts have failed so far, so we might be seeing very volatile movement either to upper zones or lower zones, but we are voting for upward movement as long as buyers maintain dominance in current regions.
Swallow Academy
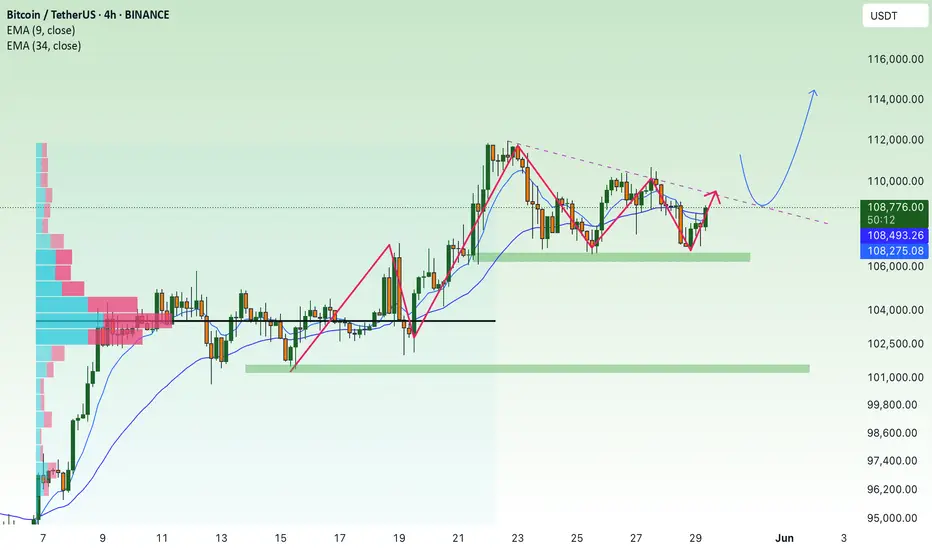
BTC shell fall!!!?This is how i am looking at market...
I can see a bearish triangle pattern in 4hr chart, which shows that btc may go 109,000-109,800 to complete third spike, then it might fall, main Support level will be 107,000-106,890, if market breaks it successfully then BTC may show 102,000 or if btc respect it's support level, then market may touch all time high 114,000!!!.

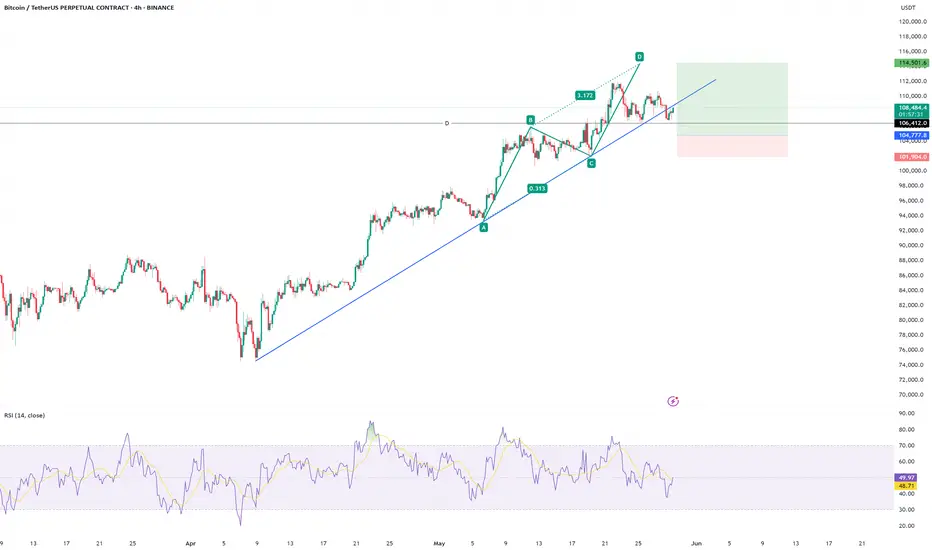
BTCUSDT LONG - TRADING PLANBTC Making a ABCD Pattern and follow the Trend Line it mate break the trend line but we have to focus on High High and High Low. My Entry is on pervious HH and my TP is D Point. I hope you Get this Trade. Thank you
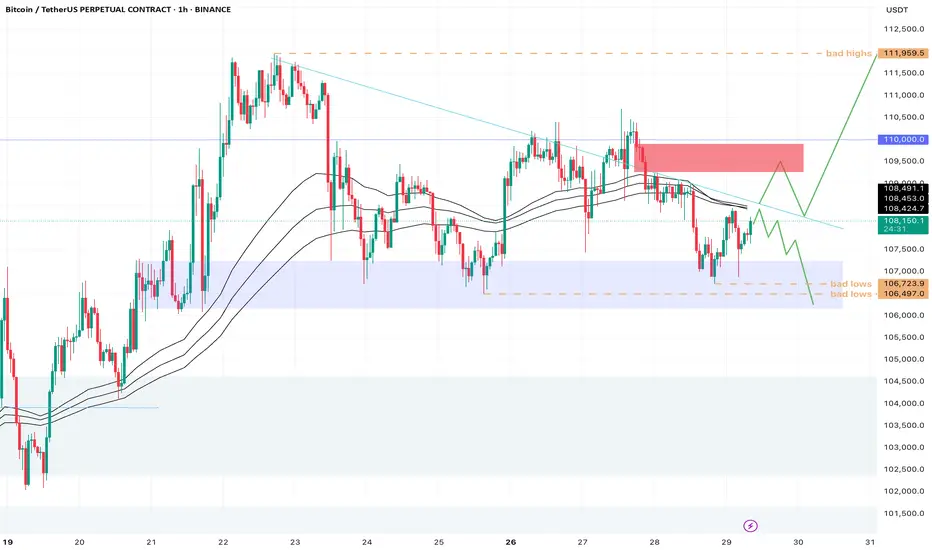
BTCUSDT – Risk of trend break, bearish signs emergingBTCUSDT is trading right at the lower boundary of its ascending channel, around the 108,800 mark. After several bounces from this trendline, price action now appears to be stalling—indicating that buying pressure is weakening. If the price breaks below the 107,500–106,500 support zone (marked by the 34 EMA and recent swing low), the short-term uptrend could be invalidated.
A confirmed break below 106,500 could trigger a further correction toward the 89 EMA around 102,800.
On the news front: Latest data shows Bitcoin’s dominance is slightly decreasing as capital rotates back into altcoins. Additionally, market uncertainty surrounding the Fed's monetary policy outlook is making investors more cautious about riskier assets like crypto.
Follow this BTC chart. And it will answer all your questions!This is very long term, monthly CRYPTOCAP:BTC chart. This chart may answer most of your questions. If it is handled with care, it may give you great insights. Please also pay attention to CRYPTOCAP:BTC.D for altcoins' situation.
I hope this helps.

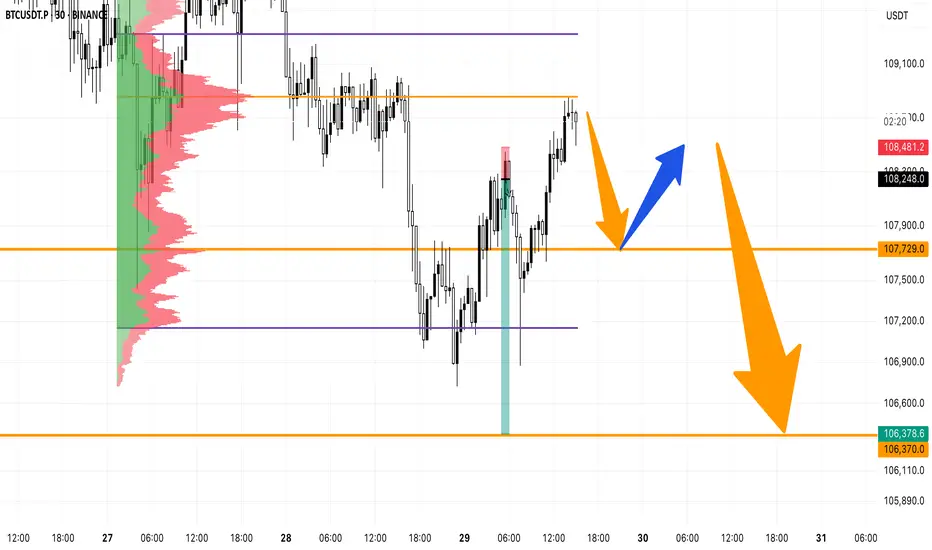
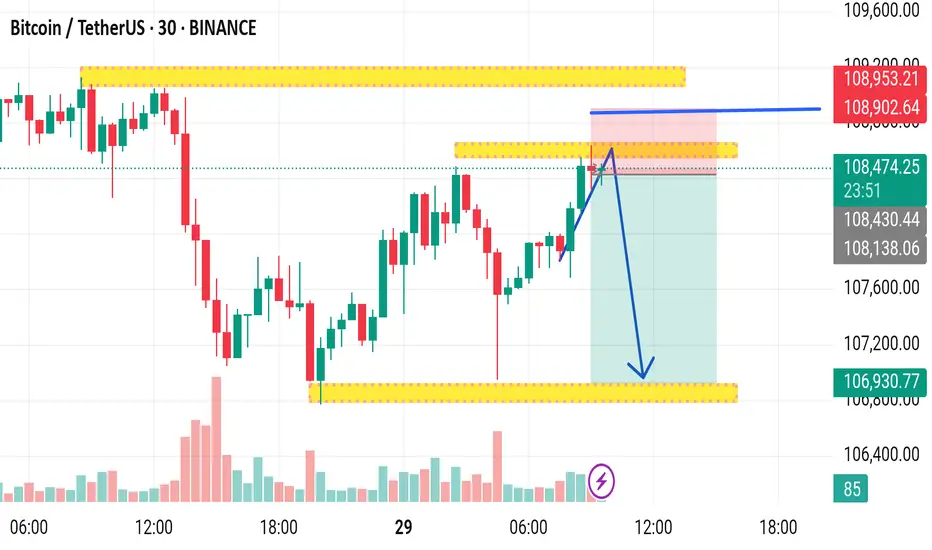
BTCUSD UPDATE 29 5 2025This chart is a 30-minute candlestick chart for Bitcoin/USDT (BTC/USDT) on Binance, published by Mr_Zakrii. Here's a detailed breakdown:
---
Chart Details and Analysis
1. Asset & Timeframe:
Asset: Bitcoin (BTC) / Tether (USDT)
Exchange: Binance
Timeframe: 30-minute candles
2. Current Price:
Price at snapshot: ~108,420.51 USDT
The price is shown moving upwards toward a resistance area.
3. Key Zones:
Resistance Zone (Top Yellow Box): ~108,900 – 108,950 USDT
Minor Resistance Zone (Middle Yellow Box): ~108,400 – 108,500 USDT
Support Zone (Bottom Yellow Box): ~106,900 – 107,000 USDT
4. Trading Setup (Illustrated by Blue Arrows):
A short (sell) position is being suggested:
Entry: Around 108,420.51 USDT
Stop-loss: ~108,902.64 – 108,953.21 USDT
Take-profit: ~106,930.77 USDT
The setup aims to capitalize on a reversal from the resistance zone, expecting the price to reject and drop toward the previous support.
5. Risk-Reward Visualization:
Red Box: Represents the stop-loss zone (risk)
Green Box: Represents the take-profit zone (reward)
This indicates a favorable risk-to-reward ratio, assuming price respects resistance.
6. Market Sentiment:
The price has recently surged with strong green candles and volume.
The chart suggests potential exhaustion or resistance at current levels.
7. Additional Indicators:
News/Economic Event Marker (Purple Icon): Indicates a possible upcoming event which could add volatility.
Volume: Noticeable increase in buying volume during the upward move, which may suggest momentum, but also a potential blow-off if rejected.
---
Conclusion:
The chart anticipates a short-term bearish reversal from the 108,400–108,900 resistance area down to the 106,900 support zone. The trade setup is based on price action and zone rejection. It's a technical sell setup, likely based on supply zones and momentum exhaustion.
Would you like help evaluating the risk/reward further, or how this setup aligns with broader Bitcoin market trends or news?
BTC - Still fighting H4 trendWatching closely here as we bounced once again from the demand zone around 106k.
H4 trend is starting to compress and inverse a bit, also lining up with a rough trend of lower highs.
I would look for rejection on H4 trend or if breached, rejection in the imbalance and then a bullish retest on trend on the trendline.
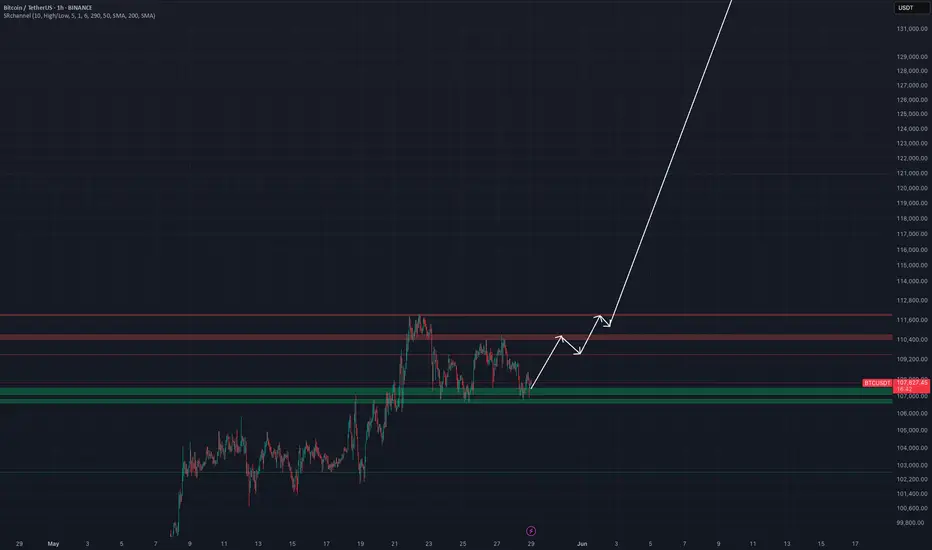
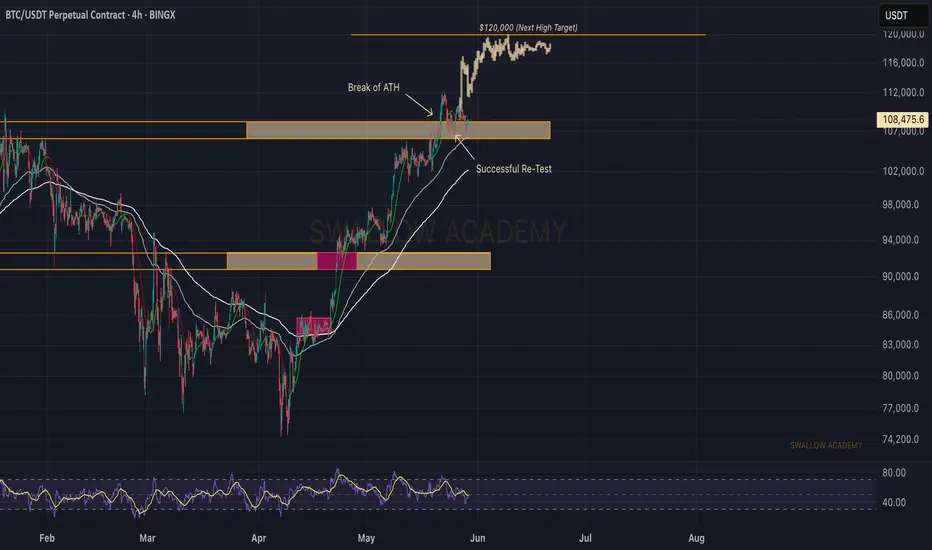
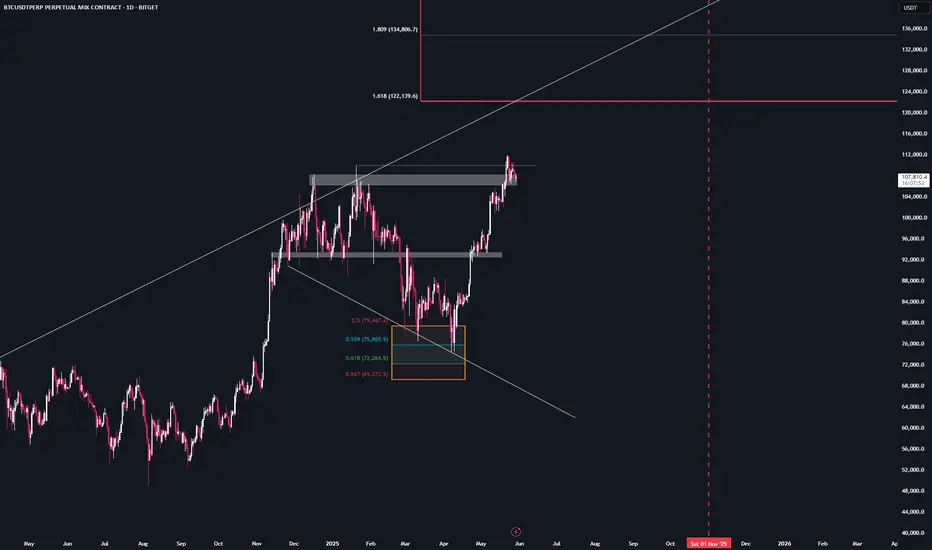
BTC near future PlanI see two scenarios that could play out in the near future:
1. We break through the ATH region and run up to $122,000 before seeing another consolidation — likely a summer dip...
2. We get rejected at current levels and dip down to the trendline throughout the summer.
I’m ready for both — and you should be too.
BTC Legendary Prediction.Just check the charts. It speaks for itself.
BTCUnknown out.
"The one who watches will never reap the reward." - Ghengis Khan