This Isn't a Crash Yet: Bitcoin's Real Correction Is Just Beginn⚡️ Hello, everyone! Bitcoin fell to $102,700 overnight. Liquidation volumes reached over a billion dollars according to official data alone. In reality, the figure is much higher.
This correction was linked to the start of hostilities between Israel and Iran. But those who follow me know that I have been predicting this for the past few weeks.
🌐 People think that geopolitics and macroeconomics drive the markets. And in part, that is true. But almost always, the signs of a sharp price movement in the near future are always visible on the chart much earlier.
➡️ And that is why I believe that the current decline is only the beginning:
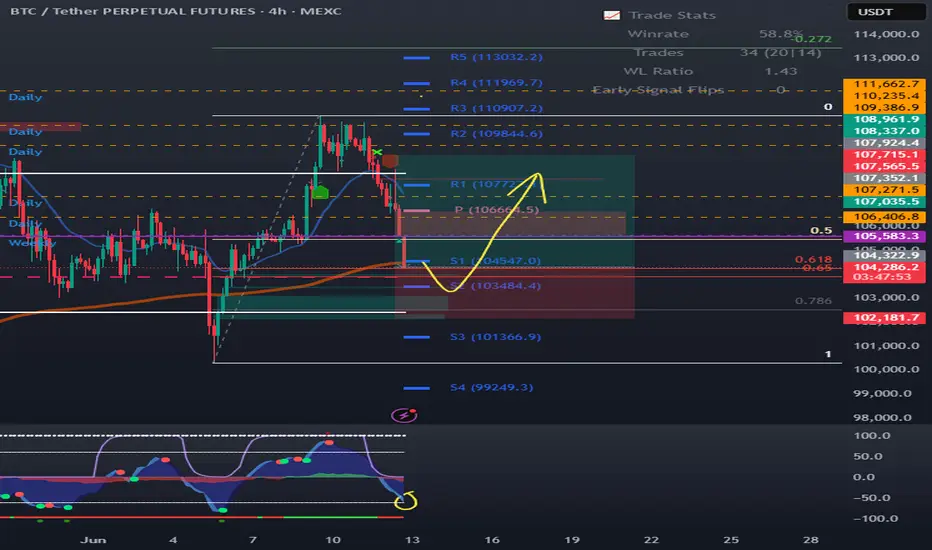
A triple top has formed on the 4H timeframe. There are a huge number of gaps below, starting with $102,810 - 97,368, and another $93,270 - 85,162. And as we know, in 99% of cases, gaps close sooner or later.
There are 1 billion liquidations at the $102,700 level alone. Now imagine how much liquidity there is at the $99,000 level? And at $90,000? I don't even need to turn on the indicators to understand that there is now a huge amount of liquidity in longs concentrated below. Because throughout the entire last impulse from the 70 levels, we have hardly seen any normal correction.
⚙️ What the indicators say:
Money Flow - the outflow of liquidity and closing of positions continues. A divergence has formed even in the current movement, hinting at a potential continuation of the correction.
Dynamic Sup/Rez - the level of $105,773 is one of the most important levels, judging by the trading volumes on it. It is now also the key resistance level. The nearest support of the same strength, judging by the volume of demand, is no earlier than $94,750. And its volumes are significantly lower, at least for now.
📌 Conclusion:
For a long time now, all indicators have been literally screaming at us that a correction is about to begin. But no one believes it. I do not believe that Bitcoin will fall to 95 tomorrow. We may even see a rebound to $107,000 to close the newly formed above us and drop those who decided to short too early.
The price moves from liquidity to liquidity — that's the law. And right now, there is simply no liquidity at the top, just as there is no demand to set new ATXs at $150,000 or whatever everyone is waiting for.
🔥 So let's be patient, or better yet, stock up on free USDT and get ready to increase our positions. Because we will definitely get such opportunities soon.
Have a great weekend, everyone!
BTCUSDT.P trade ideas

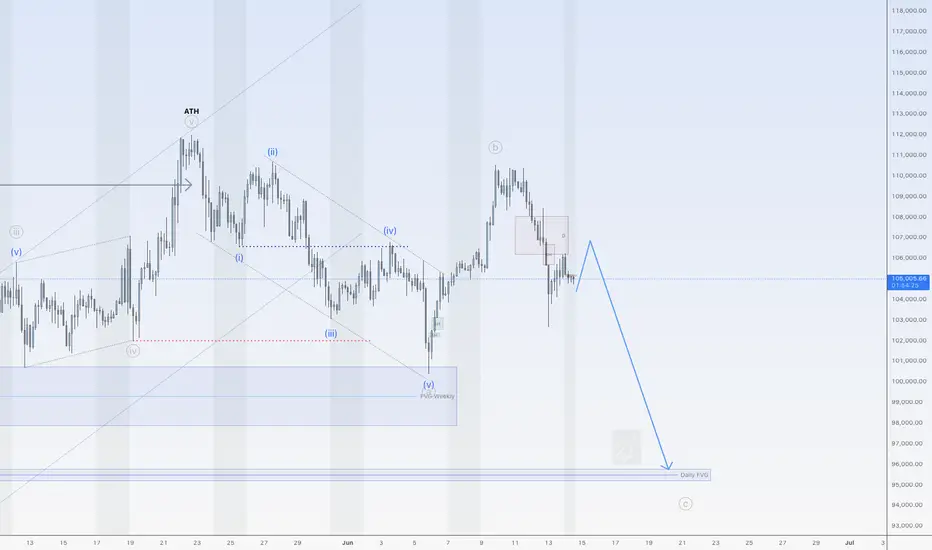
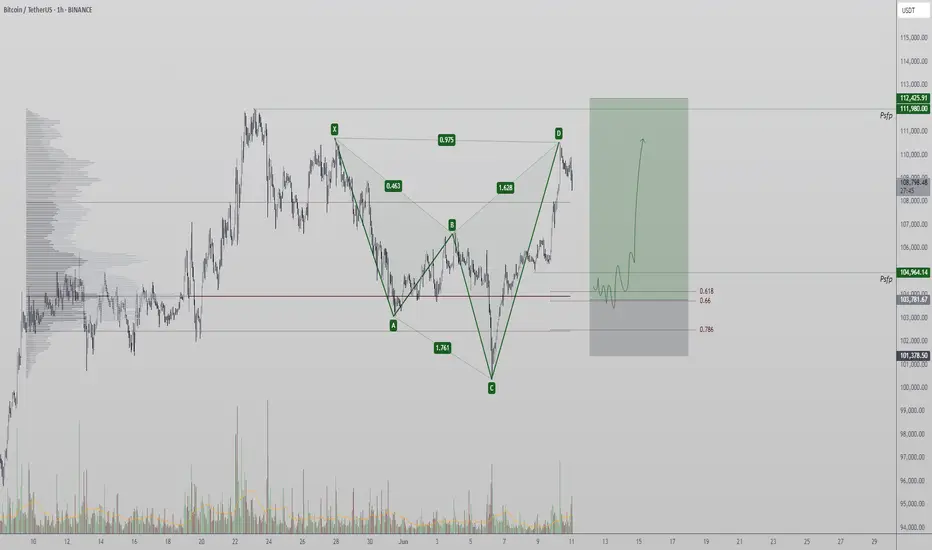
Bitcoin could drop to 95KHi traders,
Last week Bitcoin followed my outlook exactly.
Price went up a little higher to finish wave B (grey) and after that it started the next wave down.
Now we could see a small correction up and after that down again.
Let's see what the market does and react.
Trade idea: Wait for the correction up to finish to trade shorts.
If you want to learn more about trading FVG's with wave analysis, please make sure to follow me.
This shared post is only my point of view on what could be the next move in this pair based on my analysis.
Don't be emotional, just trade your plan!
Eduwave
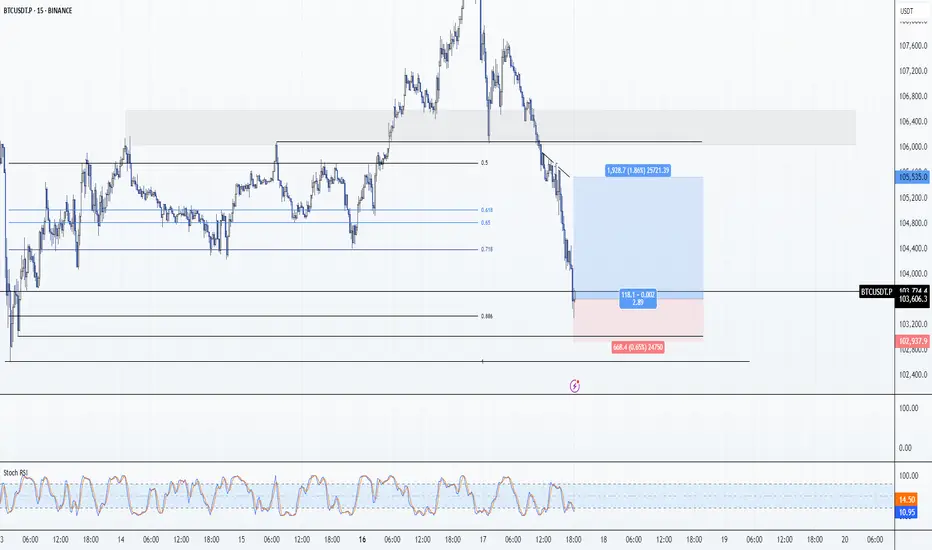
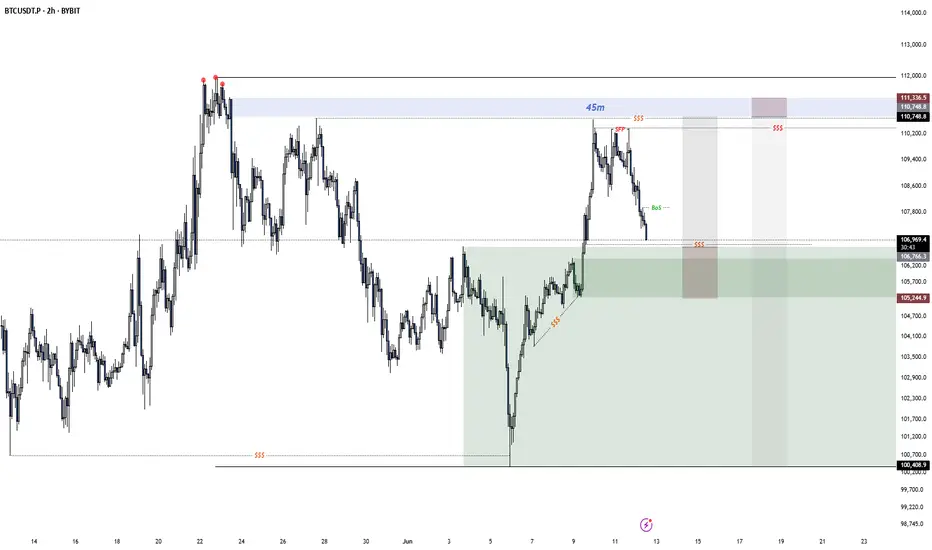
While they panic at 0.618, I loadThis is the type of setup that filters out noise traders. Four-hour price delivered into a stacked FVG zone — aligned with equilibrium, and structured to reprice.
Here’s the logic:
After taking out short-term highs near 111.9k, price repriced sharply — not randomly, but with algorithmic precision — into a series of untouched 240min FVGs.
Price tapped the upper imbalance, hovered at the 0.618 fib retrace (107.3k), and held. That’s not weakness. That’s orderflow.
Below this sits the final FVG + golden 0.786 (106.4k) and round number zone near 105.2k. That’s your invalidation layer. Anything inside it? Still Smart Money accumulation.
Above? The draw remains clear: inefficiency fill to 110.6k and liquidity resting above 111.9k.
My framework:
Bias: Bullish unless 105.2k gets violated with intent
Entry: 107.3k–106.4k
TP1: 108.5k (fib 0.382)
TP2: 110.6k (inefficiency fill)
Final objective: 111.9k raid
Volume confirms the handoff — sellers are trapped chasing the leg, Smart Money has already shifted to accumulation.
Final thought:
I don’t wait for signals. I wait for price to make sense. And here, it’s giving every reason to load.
“Fear at 0.618 is the edge of amateurs. Patience at imbalance is where precision lives.”

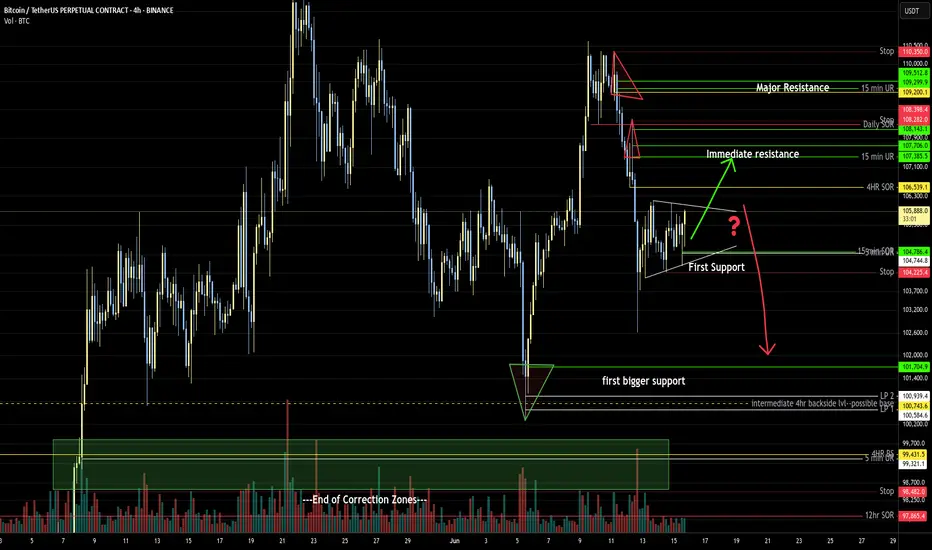
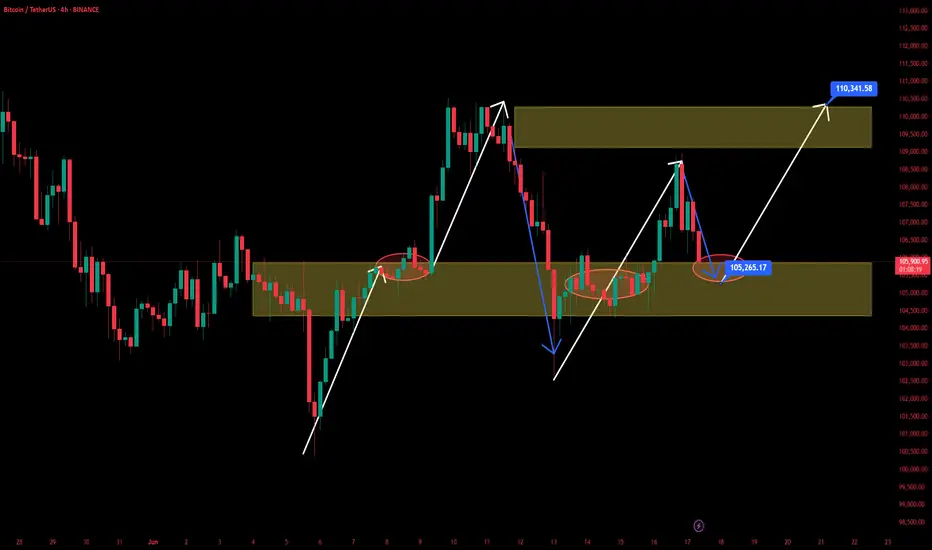
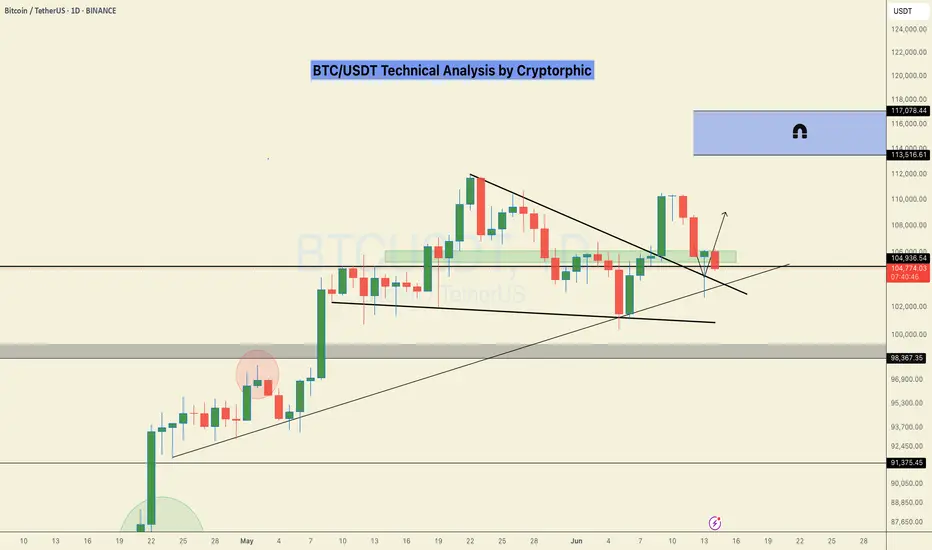
Bitcoin Overall: Likely Higher, then lower once moreIndicated are some of the major support and resistance levels I'm looking at. I'd expect price to break out of the current consolidation to the upside before moving lower.
BTC: Scalp Long 17/06/25Trade Direction:
BTC Scalp Long
Risk Management:
- 0.25% Risk
- High risk knife catch trade
Reason for Entry:
- 0.886 Retrace
- Weekly Open ideal area for short entries also lines up with a 0.5 corrective move for this leg.
- Oversold on 4 Macro TFs (M15,M30,H1,H2)
Additional Notes:
- Target Weekly Open
- High High Risk which = A very tiny risk on SL. My only trade of the day.
Bitcoin is about to bounce back!
The Israel-Iran conflict caused a drop in Bitcoin prices last week, but it didn’t last long as bullish institutions rushed to buy the dip, triggering a surge in demand and a rapid price recovery.
Strategy and Metaplanet, two of the most prominent Bitcoin asset managers, bought a combined 11,212 BTC in the last 24 hours, taking advantage of a brief drop in cryptocurrency prices following the Middle East conflict.
Fearing that a secret nuclear weapons program could pose an existential threat to Israel, Israel launched a preemptive missile attack on Iranian nuclear facilities last Thursday. Iran retaliated, and the conflict continued to escalate. Last Friday, stock and cryptocurrency markets fell as a result, providing firms like Strategy and Metaplanet with an opportunity to buy Bitcoin at a discount.
Strategy invested more than a billion dollars to buy 10,100 BTC, while Metaplanet purchased 1,112 BTC for approximately $117.2 million. Strategy now owns a total of 592,100 Bitcoins, and Metaplanet has achieved its 2025 goal of 10,000 BTC ahead of schedule. Metaplanet previously announced a "21 Million Plan" to obtain 21,000 BTC by 2026. The company has now upped the ante, announcing a new "Metaplanet Road to 210,000 Bitcoin" roadmap.
After the news came out, the price jumped to over $107K, fully recovering the losses from the drop to $103K at the beginning of the Israel-Iran conflict last week.
But the current Bitcoin price has returned to the adjustment range of 105K. My view is that as long as there is no further decline, there will be a rebound at the price position of 105K!
Bearish Shark Harmonic: Bitcoin Faces Potential PullbackBitcoin has confirmed a bearish shark harmonic on the intraday timeframe, indicating potential for a short-term correction. Volume remains average, with no signs of a short squeeze behind the move, increasing the likelihood of a reversal back into key volume zones.
Key Highlights:
Price testing the Value Area High — a key inflection level
Downside targets: Point of Control and 0.618 Fibonacci retracement
No short squeeze detected — risk of long squeeze triggering range rotation
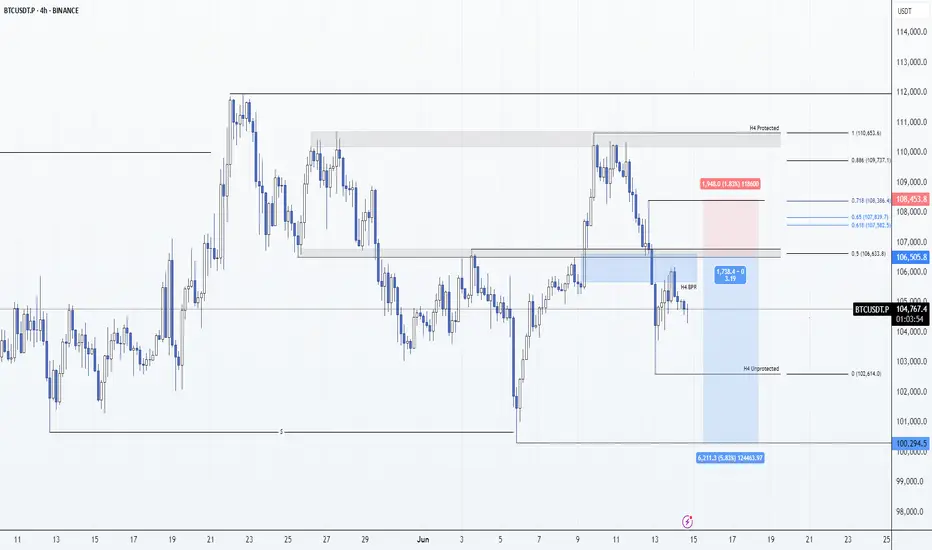
BTC: H4 14/06/25Bearish DOL @ $100,300
HTF Remains bearish
Any scam move Sunday would be my trigger to short.
Invalidation would be taking $100,300 before that or if structure changes between then and now.
That said, I think its a very high likelihood we just roll over here and we don't take that level. IMO the cleaner short was the H4 BPR but I was unavailable at the time to take that trigger.
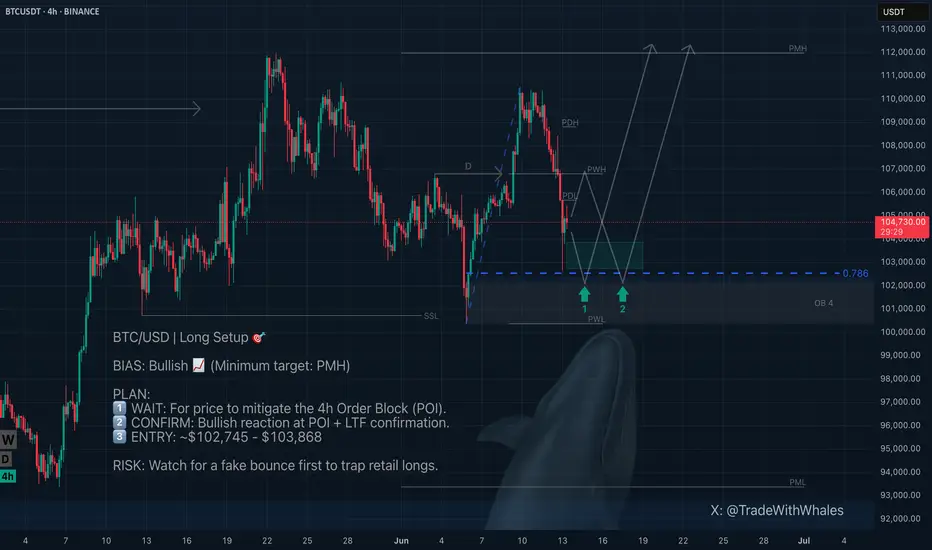
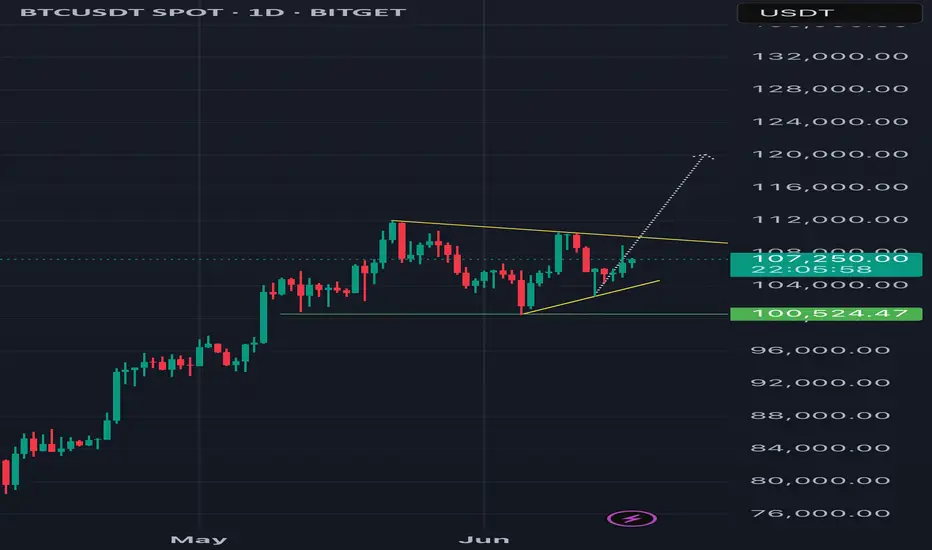
Bitcoin (BTC): Bullish, But Don't Buy Yet! Here's Why.Hello, traders! 👋 Let's break down the current situation with Bitcoin .
🔍 Overall Bias: Bullish
Bitcoin has confirmed its intention to continue the bullish trend towards a new All-Time High ( ATH ). This comes after a successful sweep of Sell Side Liquidity (SSL) and a confirmation of the bullish daily structure.
Price has already corrected into a discount zone, which is generally favorable for buys. But wait! Don't rush to open long positions just yet.
🐳 The Whale's Game Plan
The large players have a crucial Point of Interest (POI) below us — a 4h order block . This specific order block is what engineered the SSL sweep, making it a powerful support level and a magnet for price.
To sweep that liquidity and trigger the stop-loss orders of retail traders, the "whales" had to open short positions. Now, to continue the uptrend, they need to close those shorts at break-even or a small loss. The 4h order block is the perfect place to do that.
My Trading Scenarios
1️⃣ Primary Scenario: The Ideal Entry
I expect a mitigation of this 4h order block. I will be closely watching the price reaction around this POI and the 78.6% Fibonacci retracement level .
If the level holds and we get a Lower Timeframe (LTF) confirmation (e.g., the beginning of a bullish order flow), long positions could be considered.
🎯 Potential Long Entry Zone: ~ $102,745 - $103,868
2️⃣ Alternative Scenario: The Retail Trap
Price might not drop to our POI immediately. It could first bounce from the current levels, luring impatient retail traders into long positions. After that, a sharp drop could shake them out before the real move up begins next week, targeting the Previous Month's High (PML) as a minimum objective.
Conclusion
Patience is key. We need to watch the actual price behavior and reaction once the "whale" delivers the price to our POI.
This is not financial advice. My analysis is for educational purposes only.Hello, traders! 👋 Let's break down the current situation with Bitcoin.
BTC 4hr POC, 200EMA, Golden pocket confluenceBTC 4hr POC, 200EMA, Golden pocket confluence.
Looking at smaller timeframes for bullish divergence for entry.
This could be the bounce to test new ATH.
Break of all these support will be a big drop.
Time to leave marketIf you are an investor, it seems the risk-to-reward ratio is too high to stay in the market. The crypto market is giving us the last chance before it goes bearish!
Just look at the volume on this chart to find out that the last ATH was not supported by the bulls.

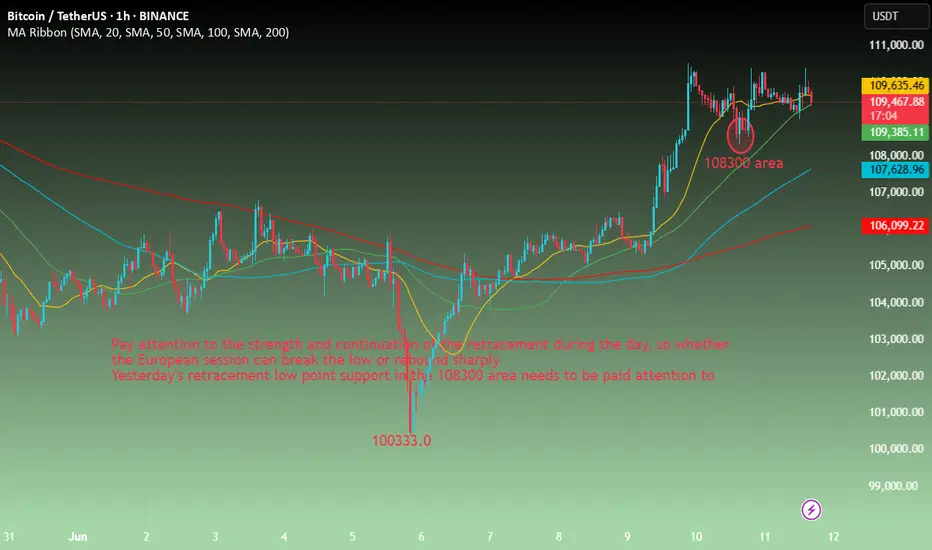
BTC-----Sell around 109500, target 108500 areaTechnical analysis of BTC contract on June 11:
Today, the large-cycle daily level closed with a small positive line yesterday, and the K-line pattern continued to rise. The price was above the moving average. The attached indicator was golden cross. The general trend of the rise was relatively obvious, but it should be noted that the large upward trend last week caused the current daily price to deviate from the moving average. Then the return to the moving average is a correction and retracement trend. The support position is near the 107000 area, so pay attention to avoid the risk of retracement; the short-cycle hourly chart yesterday's intraday retracement correction European session continued the US session support rebound, but did not break the previous high position. Today, the current pressure retracement, the K-line pattern continued to be negative, so the intraday still has to go through the retracement trend, the low point support position is 108300 area;
BTC short-term contract trading strategy:
sell at the current price of 109500, stop loss in the 110000 area, and the target is near the 108500 area;
Global M2 & BitcoinThe Bitcoin chart holds an open secret — and it’s still called: LIQUIDITY. 💥
Forget the media noise.
The current chart shows that global M2 liquidity (with a 12-week lead) continues to drive Bitcoin’s price almost entirely.
No magic. No coincidence.
Macro beats opinion.
If 89% of price movements can be explained by liquidity flows,
then the rest... is just background noise.

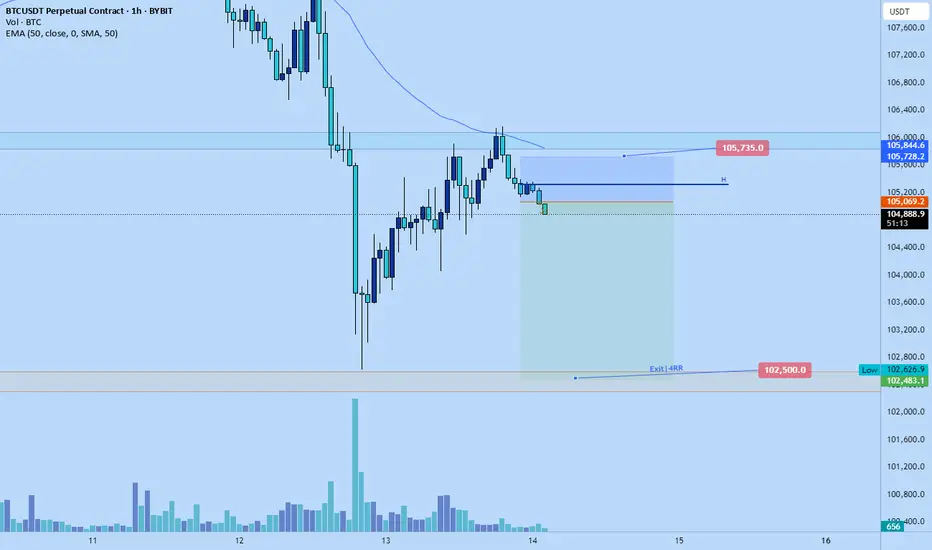
Bitcoin dump to 102500 ...maybe loweerJust recently opened a short position on bitcoin. Aiming for 102500 tp.
Its very evident the market wants to fall.
Getting roughly 4RR from this given plays out.
Stop: $105735
Market is aiming for new lows according to my DTT analysis.
BTC USDT LONG TRADE SETUPBTC/USDT is currently holding at a strong support zone, with a high probability of an upward price move. Also 100 EMA is acting as support.

As I said earlier, the real correction is STARTING right now!Hello, everyone! I started writing this review when Bitcoin was at $105,200, and I'm finishing it at $104,150.
⚡️ So far, my thesis is completely correct — we filled the GAP at $104,763 and are going lower to collect liquidity and close the GAPs.
But let's take a look at where and when something might change:
➡️ Today, there is a vote on the stablecoin bill. It is being hyped up a lot and in the short term, it could be a catalyst for a small rebound. But in reality, it has no global value right now. And it will take a very long time to truly feel its impact. But this law is definitely a breakthrough.
➡️ June 18 — the Fed's interest rate decision. The market expects the rate to remain at 4.5%. But in a bearish momentum, anything other than a rate cut (and even that is not always the case) is a bearish catalyst. Remember April, when positive news came out in droves, but Bitcoin at $75,000 didn't care.
However, if the rate is lowered, we can definitely expect a rebound. But I don't think it will be very high.
⚙️ Metrics and indicators:
Money flow - in complete harmony with the price. Position closing and liquidity outflow continue. It is clear that most of it has flowed into ETH and altcoins. But don't forget that if Bitcoin goes down, this liquidity from altcoins will evaporate even faster.
Support/Resistance Zones - as we can see, the level of 105,500 - 106,000 is still key, and without consolidating above it, we are going down. As long as the price is below this level, it is a bearish signal.
Liquidation Levels - just look at the amount of liquidity from below. As we know, the price moves from one liquidity to another; it is literally its fuel. And now, there is simply no liquidity from above, but there is plenty of it from below.
📌 Conclusion:
So far, everything is quite predictable for me and my subscribers. So, leaning back in our chairs, we continue to enjoy the show and wait for real discounts!
Have a great week, everyone!

BTC 12.06.25After BTC avoided the last supply there is on the chart since monday, i would expect a reaction as soon it comes in there. There is also a big area of range demand below where i am looking for a bullish reaction. My main focus is at the range high since i still have this HTF distribution scenario in mind and we are right in the first deviation of it.
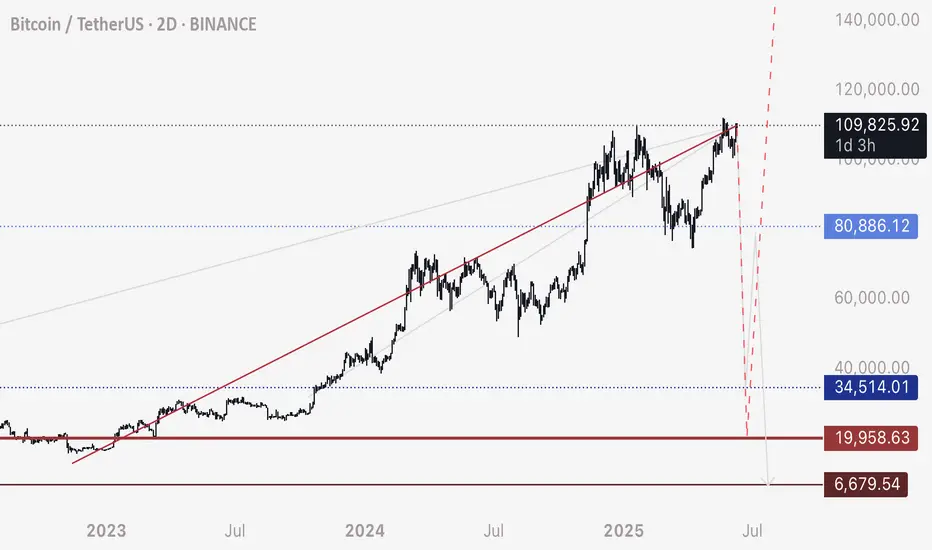
BTC - Be mindful of resistance around 109,800 to 110,000Per my second last post about this red trendline - be mindful that there is a resistance located 109,800 to 110,000 zone.
Although Bitcoin can break above, that doesn’t mean the resistance is invalid. Price will weave above and below until it sticks and plays out.
Personally I watch these levels for sudden fast movement and confirmation that it’s holding as resistance.
If you see a fast drop initiate from these levels, be mindful that this could be indicative of intention to hit the lows around 20,000.
For more information see my previous posts.
Happy trading
BTC long now ! Bullish divergence confirm ! Bullish divergence in daily timeframe. It might be good for take long position on btc .
#DYOR
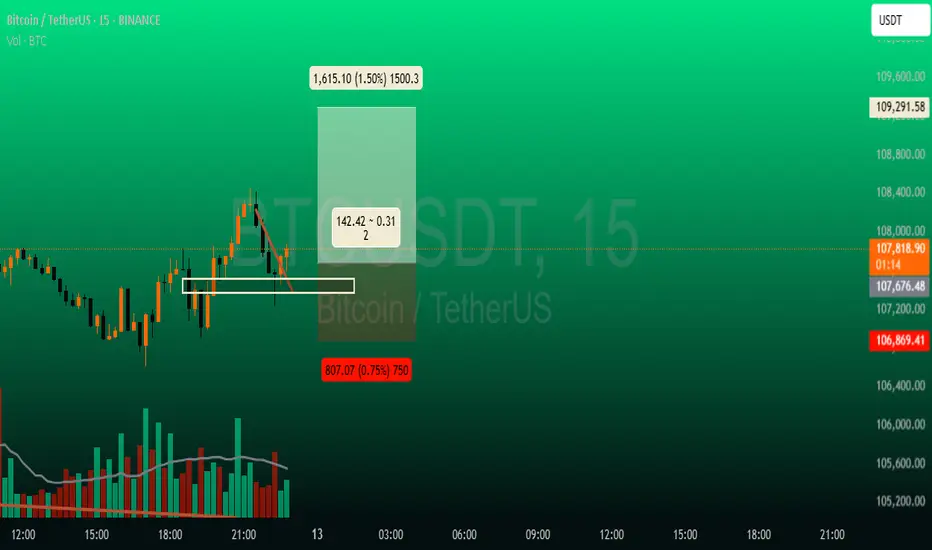
it's time to going up for BTCUSDT!!!before buying, please check for being sure about your opinion about this CRYPTOCURRENCY!!!
(in every target you want, closed the position but our target is the third one)
*Guy's the entry place is importance things in enter in a position and be careful do not going up your leverage over 7x ,all things it's about risk management*
*************************************************
if you want to enter in this position:
Enter Price: MARKET (Here)
Target1: 107924.72
Target2: 108456.11
Target3(Final Target): 109291.58
Stoploss: 106869.41
*************************************************
#Longtrend #bullish #signals #tradingview #trading #Binance #trader #cryptotrading #Daytrader #investing #Crypto #Money
#BTC URGENT UPDATECRYPTOCAP:BTC Update:
Keeping it simple, yesterday’s daily candle printed a nice hammer, but today’s candle looks rough.
That said, things can flip fast in this market.
🔹 Close above previous day’s high: Trend remains intact
🔹 Close above $103,500K: Bullish structure holds
🔹 Break below $102,600: Bearish, could open the door to low $90Ks in the coming weeks
We’re stuck in a tight zone. It's best to stay patient until we get a breakout in either direction.
DYOR, NFA
Let me know what you think, and hit the like button if you like it.
Thank you
#PEACE
Bitcoin Will Continue Rising —Long-Term Chart —$200,000+ New ATHIn November 2021, the week after the all-time high was a crash. The weeks that followed were a continuation and the market went full red and didn't stop dropping until November 2022, a year later.
In May 2025, the week after the all-time high is neutral, sideways. Four weeks later and Bitcoin continues sideways consolidating near resistance, ready to break to new highs and continue rising.
Market conditions now are very, very different compared to 2021. Right now, we are only halfway through the current bull market, for Bitcoin, and we have room left available for plenty of growth.
In a matter of days, maybe 5-6 days, we get a new all-time high and this means not the end of the bull market but the start of the next and final bullish wave.
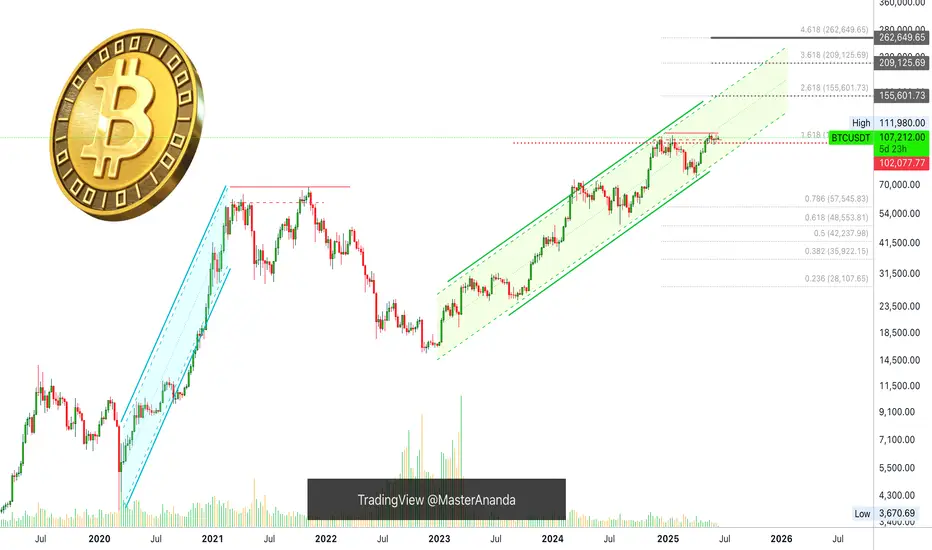
These targets on the chart are the most accurate of all numbers because they are based on almost 5 years of data.
Next target and minimum price for Bitcoin in the coming months is $155,601 but we know there is likely to be more, much more. With the institutional wave now in full force, banks opening to crypto because they have no other choice and the world evolving faster than anything we thought possible, we are aiming for $200,000 or more.
The next relevant level after $155,600 is $209,125. Which one is your target for this new 2025 all-time high?
Do you think Bitcoin will peak in late 2025 or early 2026?
Do you think you will manage to be successful in this round or are you bound to make the same mistakes? Over-trading, over-leverage, no being patient enough; not waiting for the right time to enter and not selling when the market is trading very high, greed; What will it be?
Do you think you have what it takes to succeed? You do!
Even if you made mistakes in the past or even if you are already doing good, you have what it takes.
If you are doing bad, this experience can be used to improve your game. If you are doing great, great, let's do better. There is never enough growth; we are happy, we are grateful but we accept abundance because we receive abundance thanks to hard work.
It is still very early but the market is starting to heat up. Once the bullish action starts, there is nothing that can stop us. The world will change for us. We will adapt to all market and geopolitical conditions, we will continue to improve and evolve.
The best one is not the one that makes no mistakes but the one that can extract learning from all experiences. Success is not being right all the time, success is never giving up.
Will you give up? Or, will you continue to trade long-term?
» Bitcoin is going up!
Namaste.
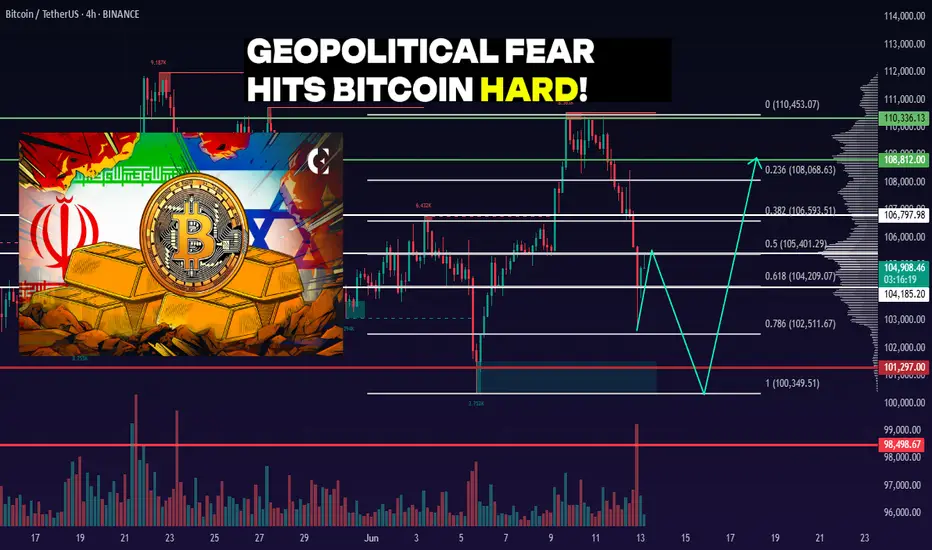
BTC 4H. $104K or Bust — Critical BTC Moment! 06/13/25BINANCE:BTCUSDT remains in a sideways range between $110,336 – $101,297. The main trading volume is concentrated around $103,907.
Recently, the price reached the upper boundary of the range at $110,336 and sharply declined from there — confirming the strength of resistance. The drop was intensified by negative geopolitical news (Israel–Iran tensions).
As a result, BTC retraced into the $104,185 – $101,297 demand zone — a potential area where buyers might step in again.
Personally, I expect one more dip into the $104,185 – $101,297 range to test the strength of buyers.
⚠️ If negative news continues, a breakdown below $100,349 and a new local low is possible.
DYOR.