BTC/USDT Technical Analysis BTC/USDT Technical Analysis | Approaching a Key Confluence Zone
As shown on the chart, Bitcoin has successfully reached our previous bullish targets. The price is now testing a critical resistance zone that could determine the next major move.
🟢 Bullish Scenario: Breakout Toward Key Levels
If BTC breaks above the current resistance, the next targets to watch are:
$106,596 – first resistance
$107,058 – major horizontal resistance
Descending trendline – dynamic resistance that has held strong in recent weeks
A clean breakout above the trendline may lead to further upside toward:
$107,902 and $108,008
These zones have historically acted as strong barriers, so price reaction here will be crucial.
🔻 Bearish Scenario: Rejection and Pullback
If BTC gets rejected at the current resistance, look for support at:
$104,740 – first area for a bounce
$104,146 – key support zone to hold for bulls
Failure to hold these levels could trigger further downside pressure.
📌 Summary
Bitcoin is at a critical intersection of horizontal and trendline resistance. A breakout could ignite a strong bullish move, while a rejection might bring another leg down.
📉 Wait for confirmation candles before entering.
🚀 If you find this helpful, smash that follow for more high-probability setups, clean charts, and daily updates. Let’s trade smart, not blind. 📈
BTCUSDT.P trade ideas

BTC SHORTI hope it plays as we predict, Market sentiments are really volatile we might get squeezed.
The trade setup is on the chart..
DYOR
Lingrid | BTCUSDT potential Bullish Continuation After PullbackThe price perfectly fulfilled my last idea . BINANCE:BTCUSDT has formed a higher low after rebounding from the trendline near $104K and is attempting to stabilize within a minor range just above $105.5K. The broader structure shows a clean breakout from the downward trendline, followed by consolidation, suggesting accumulation. A bounce from the $105K–$105.5K support area would favor a continuation toward the $109K resistance level.
📈 Key Levels
Buy zone: 105,000–105,500
Sell trigger: break below 104,800
Target: 109,000
Buy trigger: close above 106,800 with strong volume
💡 Risks
Breakdown of support could retest the $100K region
False breakout may trap bulls above $106K
External macro news could trigger short-term volatility
Traders, if you liked this idea or if you have your own opinion about it, write in the comments. I will be glad 👩💻
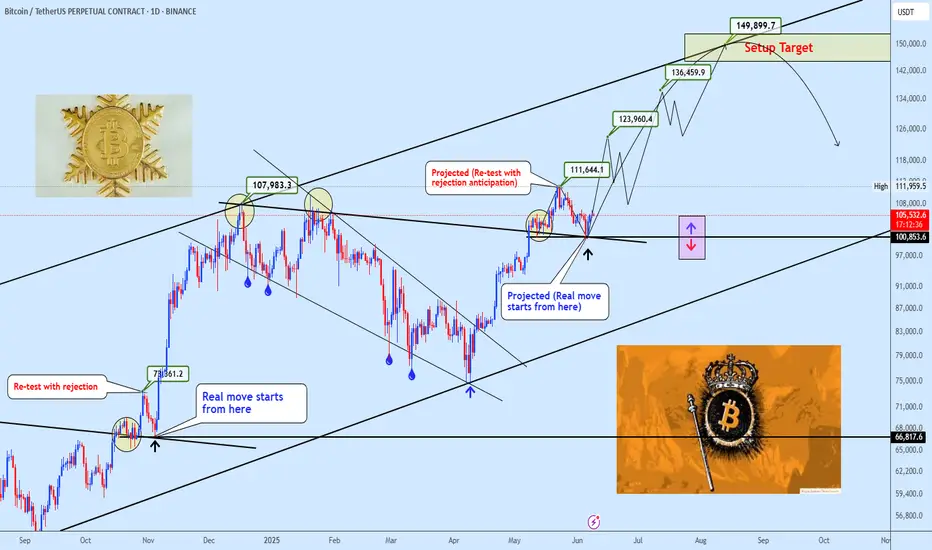
BTCUSDT Re-Test Complete Bullish Continuation Back in PlayAs anticipated in the previous analysis, BTC has successfully completed the projected retest of the $100,000–$101,000 zone. The price action within this region confirmed strong demand and validated it as a key structural support.
With the retest fulfilled and buyers stepping back in, the bullish continuation structure remains intact. We now shift focus toward the next upside targets around $123,420, $136,000, and $149,450, which form the anticipated confluence resistance zone for this current bullish cycle.
So long as price continues to hold above the $100K structure, market sentiment remains constructive. Any decisive break below this zone would warrant a re-evaluation of the short-term bias.
Stay sharp and manage risk accordingly. Feel free to share your thoughts in the comments.
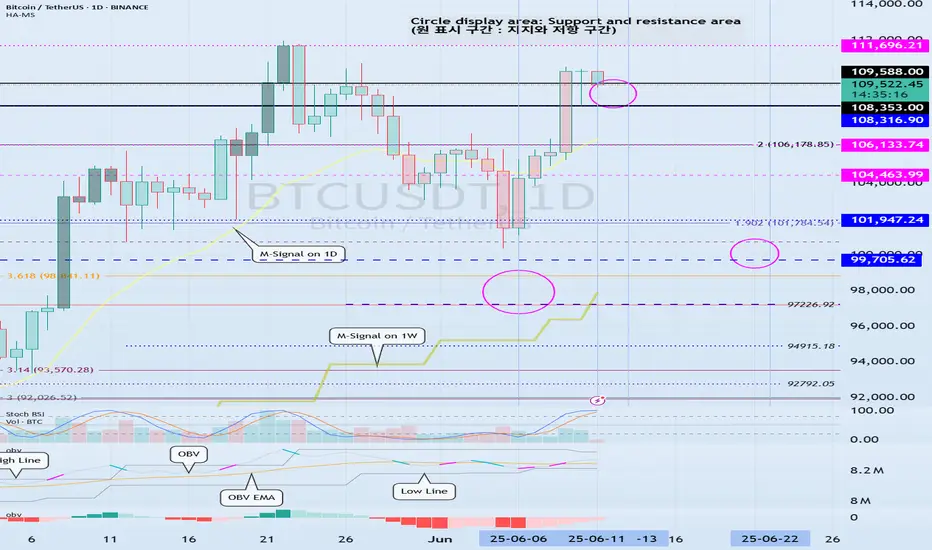
Check for support near 104463.99-106133.74
Hello, traders.
Please "Follow" to get the latest information quickly.
Have a nice day today.
-------------------------------------
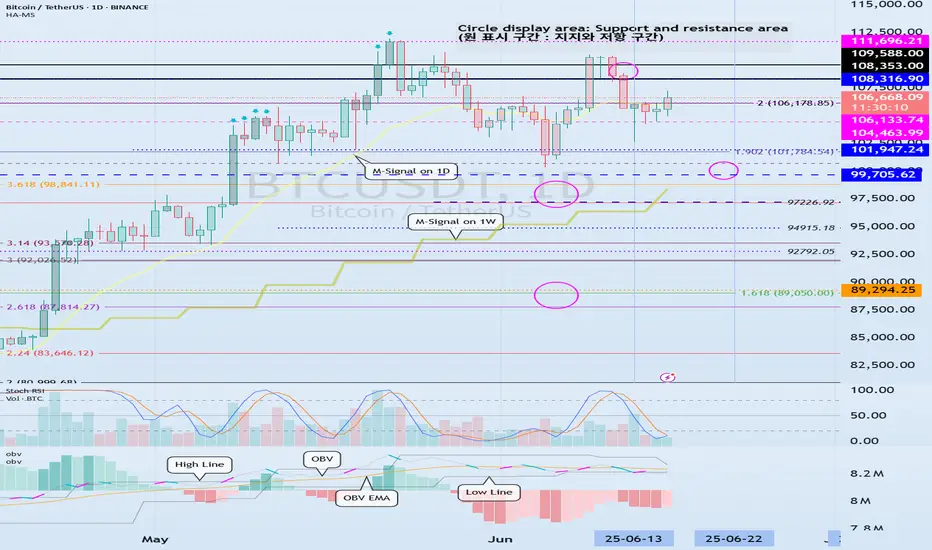
(BTCUSDT 1D chart)
The next volatility period we should pay attention to is around June 22nd (June 21-23).
Currently, the HA-High indicator of the 1D chart is formed at 108316.90, so the key is whether it can rise above that point and maintain the price.
If not, there is a possibility that it will touch the M-Signal indicator of the 1W chart.
In other words, we need to check whether there is support near 99705.62.
However, we need to check whether there is support near 104463.99-106133.74.
-
If we look at the auxiliary indicator OBV, the High Line is showing a downward trend.
This means that the high point is getting lower.
Therefore, if it rises above 108316.90 this time, we need to check whether the OBV can rise above the High Line and maintain it.
-
DOM(60), DOM(-60) indicators are displayed by the Close value.
HA-Low, HA-High indicators are displayed by the (Open + High + Low + Close) / 4 value.
Therefore, HA-Low and HA-High indicators represent the middle value, and DOM(60) and DOM(-60) represent the end point value.
This makes it difficult to trade when DOM(60) and DOM(-60) indicators are generated.
To make this clearer, I added an arrow signal.
DOM(60) indicator and HA-High indicator are indicators that represent high points.
In other words, the generation of DOM(60) indicator and HA-High indicator means that there has been a decline in the high point range.
However, as I mentioned earlier, the DOM(60) indicator is not easy to respond to because it indicates the end point, but the HA-High indicator indicates the middle value, so there is time to check whether there is support near the HA-High indicator and respond accordingly.
Therefore, you should check whether there is support in the section between the HA-High indicator and the DOM(60) indicator and respond accordingly.
On the contrary, the DOM(-60) indicator and the HA-Low indicator are indicators that indicate the low point.
You can think of it as the opposite of what I explained above.
-
By not indicating the support and resistance points according to the arrangement of the candles, but using the indicator points as the support and resistance points, anyone can see how the support and resistance points were created.
This will provide important objective information for trading.
-
Thank you for reading to the end.
I wish you successful trading.
--------------------------------------------------
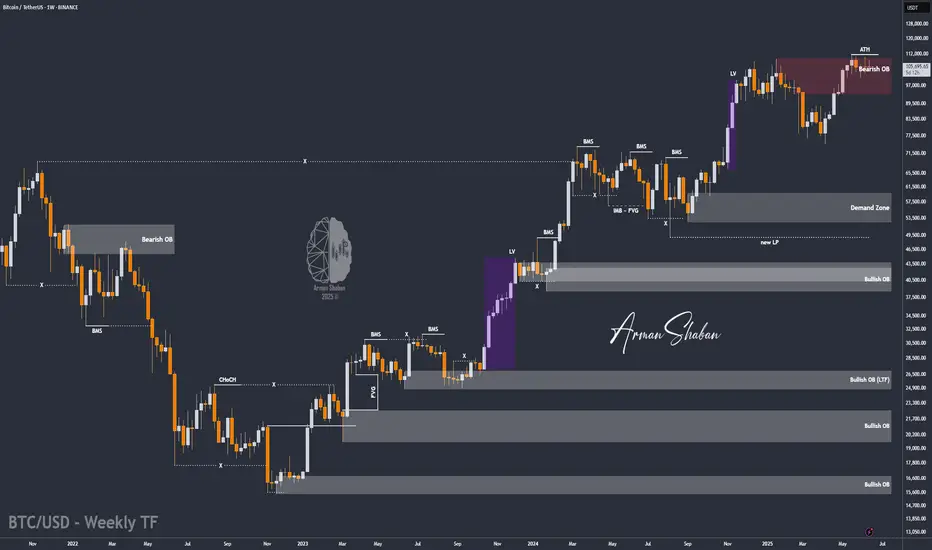
- This is an explanation of the big picture.
(3-year bull market, 1-year bear market pattern)
I will explain more details when the bear market starts.
------------------------------------------------------
BTC Dips After ATH – $100K Support in Focus Amid TensionsBy analyzing the #Bitcoin chart on the weekly timeframe, we can see that after rallying to $111,980 and printing a new all-time high, price faced a correction down to $100,000.
Currently, Bitcoin is trading around $105,700, and with geopolitical tensions escalating, particularly the risk of war, we could see further downside — potentially taking price as low as $90,000.
However, if BTC manages to hold above the $100,000 level, there’s a strong chance we’ll see a short-term rally toward $120,000.
This analysis will be updated as the situation evolves. Stay tuned!
Please support me with your likes and comments to motivate me to share more analysis with you and share your opinion about the possible trend of this chart with me !
Best Regards , Arman Shaban
#BTC Update and Altcoin StrategyCRYPTOCAP:BTC Keeping it simple.
If Bitcoin breaks above the current level, BTC will hit a new ATH, and altcoins may face a short-term hit but will recover, following Ethereum’s lead.
If BTC gets rejected, altcoins will likely take another hit and recover with Ethereum.
What’s the common pattern here?
Altcoins are setting up for a sustained bullish move.
It’s just a matter of time.
This is not the market to over-leverage.
Protect your capital and position yourself wisely for the real opportunities ahead.
Patience now will pay off later.
Cheers.
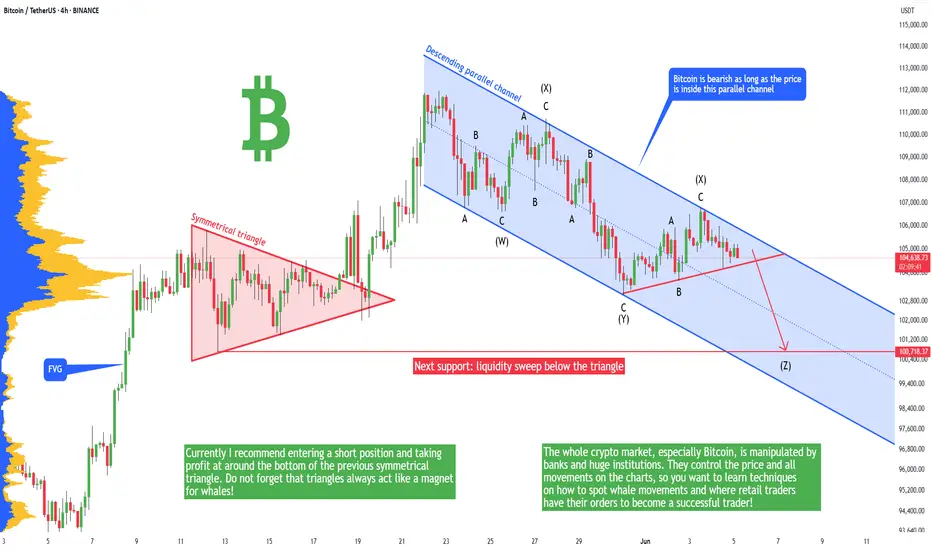
Bitcoin - Secret pattern no one talks about, drop below 100k!The price of Bitcoin is currently in a downtrend. We can see that the price is inside this secret descending channel that really no one talks about. As long as we are in this channel, Bitcoin remains bearish, and we can expect a huge drop in the short term! So what is the plan?
Currently I recommend entering a short position and taking profit at around the bottom of the previous symmetrical triangle. Do not forget that triangles always act like a magnet for whales! Usually the price wants to take liquidity above and below triangles, so be careful. There is an extremely high chance of sweeping liquidity below this symmetrical triangle. Triangles are also printed by the market maker to engage retail traders in trading.
The whole crypto market, especially Bitcoin, is manipulated by banks and huge institutions. They control the price and all movements on the charts, so you want to learn techniques on how to spot whale movements and where retail traders have their orders to become a successful trader! This can take a few years of education.
From the Elliott Wave perspective, it looks like we are ready for another leg down after the bears break the local red trendline. At this point, I marked it as a complex correction, but there are multiple scenarios on what could happen in the near future.
Currently I am bearish on Bitcoin and expect prices below 100,000. Always use technical analysis to confirm your bias.
Write a comment with your altcoin + hit the like button, and I will make an analysis for you in response. Trading is not hard if you have a good coach! This is not a trade setup, as there is no stop-loss or profit target. I share my trades privately. Thank you, and I wish you successful trades!
BTCUSDT – Bearish signs emerge below resistanceAfter a strong bullish run, BTCUSDT is now showing clear signs of weakness near the resistance zone around 109,600–112,000. Price action has formed a cluster of rejection candles at the top, failing to break above this key level – signaling that selling pressure is gaining control.
The current structure suggests a potential trend reversal, especially as the latest bearish candle came with rising volume, confirming selling interest from the supply zone. If the price breaks below the 101,500 support, BTC may continue dropping toward the 93,500–84,500 range – a high-liquidity area on the volume profile.
The previous bullish momentum appears to have lost strength, and this pullback may be confirming a shift after reaching its upper limit. As long as BTC remains below the 112,000 resistance, the bearish bias remains dominant.

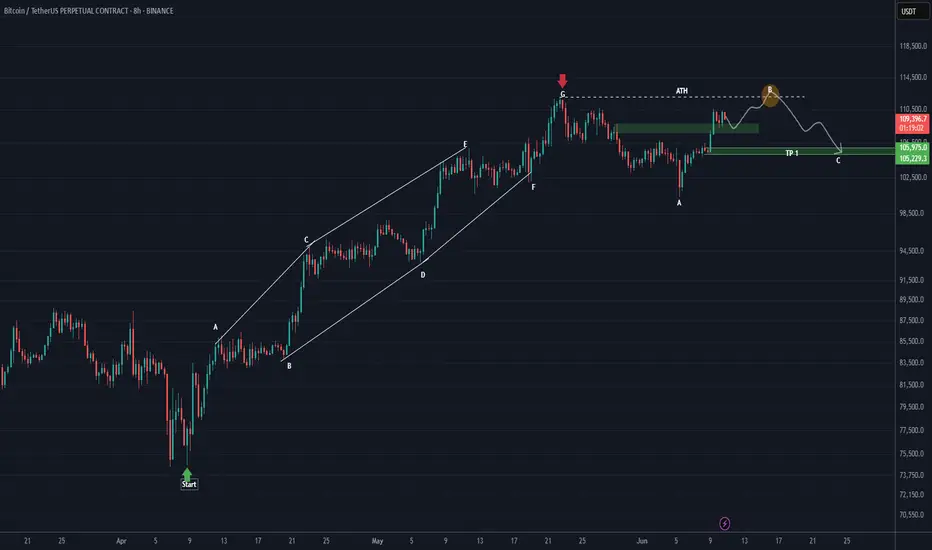
Will Bitcoin move toward its ATH?This analysis is an update of the analysis you see in the "Related publications" section
In the previous analysis, we mentioned that the red zone marked on the chart could potentially be broken.
From the point where we placed the green arrow on the chart, Bitcoin’s diametric pattern has completed, and it has entered a corrective phase.
It now appears that we are in wave B of a running flat, and wave B could complete around the all-time high or slightly above it.
Let’s see whether this move will play out or not.
For risk management, please don't forget stop loss and capital management
Comment if you have any questions
Thank You
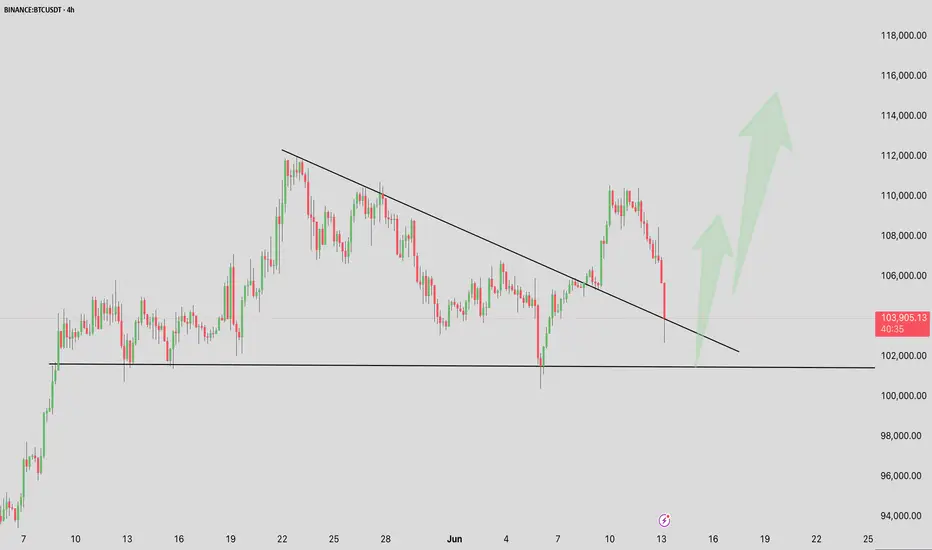
BTC/USDT 4H Chart Update –BTC/USDT 4H Chart Update –
After a strong rejection from the $110K+ zone, Bitcoin is now retesting a critical trendline support on the 4-hour chart.
Key Highlights:
Price dropped sharply to $103K, almost tagging the key ascending support zone.
The previous breakout from the descending trendline is now being retested, which is a classic bullish retest pattern.
If bulls defend this region successfully, expect a potential bounce towards $108K–$ 114 K.
However, a clean breakdown below $102K would shift short-term momentum bearish.
Eyes on this zone. High-probability decision area.
Watch for reaction candles and volume spikes to confirm the next move.
Thanks for your support!
DYOR. NFA
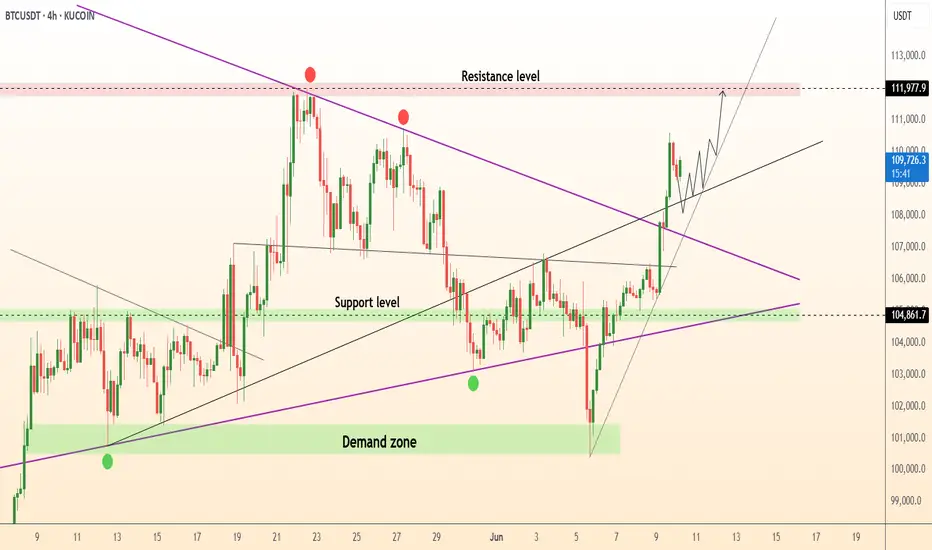
DeGRAM | BTCUSD fixed above the downtrend line📊 Technical Analysis
● Bulls pierced the descending purple trend-line and closed two candles above the 106 k pivot, confirming a pennant breakout and resetting higher-lows along the black mid-channel.
● Re-test of 104.8 k demand (green band) held as support; the new up-sloping flag projects to the 111.8 k-112 k red supply at the channel roof, with dynamic backup now rising to 103.8 k.
💡 Fundamental Analysis
● U.S. CPI whispers point to a softer June headline while spot-ETF cohort added another 3 200 BTC in two sessions and exchange reserves keep declining, underscoring supply squeeze amid easing rate fears.
✨ Summary
Long 104.8-106 k; sustained trade >107 k targets 111.8 k → 115 k. Bull thesis void on a 4 h close below 99 k.
-------------------
Share your opinion in the comments and support the idea with a like. Thanks for your support!
Bitcoin Hard to Stay on Top!Bitcoin rejected $110,000 for 3rd time and moving down now! Looking for $108,000 as possible support, but it could be brittle, so possible to see move down even further — to Weekly Open level - $106,000
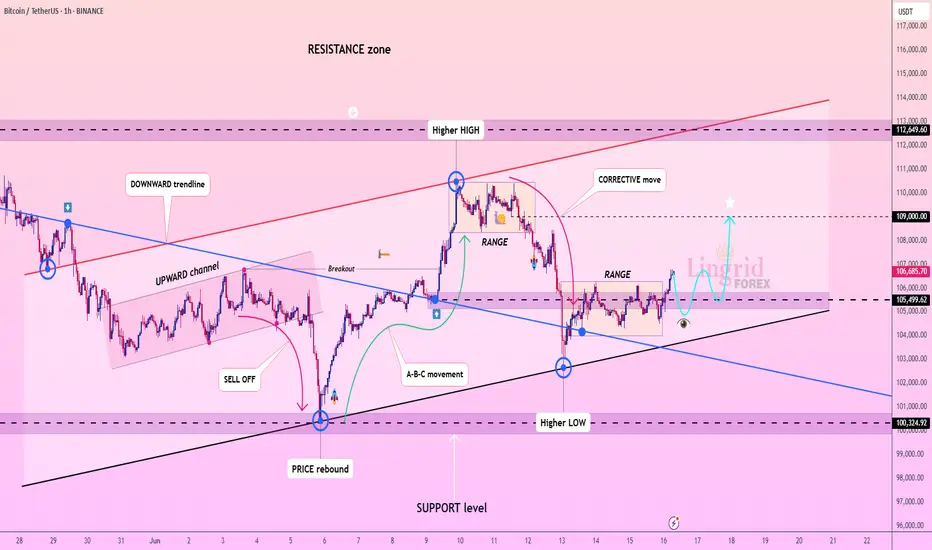
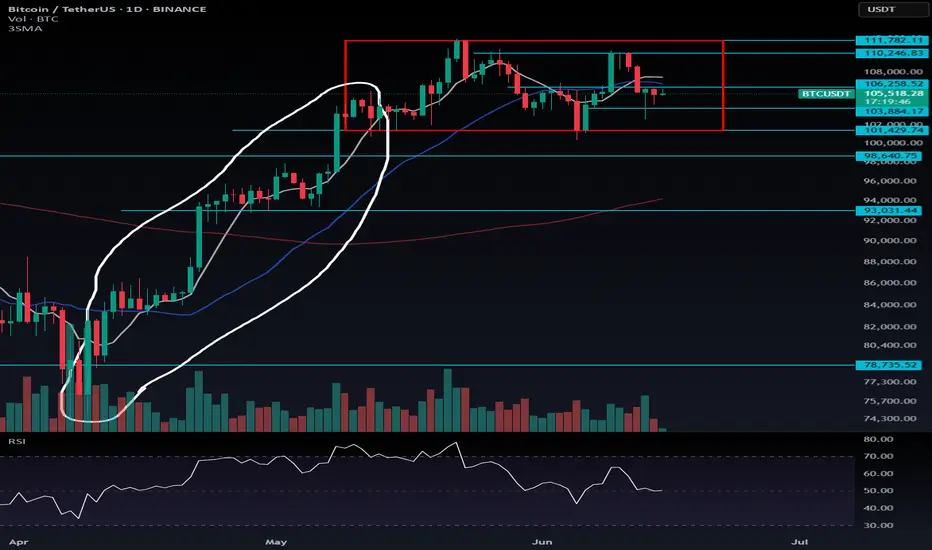
Bitcoin in Mid-Term Uptrend, But Consolidating in Short-Term Ran📊 Bitcoin in Mid-Term Uptrend, But Consolidating in Short-Term Range
Bitcoin remains in a mid- and long-term uptrend, clearly shown by the white trendline on the chart. However, in the short-term, the price is consolidating inside a sideways range (highlighted in red).
If price bounces from current levels and starts pushing upward, it would confirm a higher low above the range support at $101,429, which increases the probability of an upside breakout. Otherwise, we could see another test of the range bottom.
The levels at $103,884 (support) and $106,258 (resistance) are not particularly strong, but can still be used for aggressive pre-breakout trades. Personally, I won’t enter trades at these levels just yet — I’d like to see more interaction and confirmation.
⚠️ Note:
Breakouts from this range are likely to be sharp and impulsive, regardless of direction.
For short setups, you could either wait for a breakdown of $103,884, or use a sell-stop below $101,429 — but I’m not taking shorts, as the overall trend remains bullish on higher timeframes.
On the long side, I won’t enter on a break of $106,258 unless we see a fakeout below $103,884, which would increase the probability of a successful long breakout.
BtcBtc direction is turned over in to huge sell and bear whale is active now the trading price will go to ward 99k lets keep on eye
BTCUSDT: PYH Manipulation & Critical Target AheadWe're facing a potential manipulation at the Previous Yearly High (PYH) level. This is a trap for the unwary.
Here's the critical insight: Bitcoin's price is rising, but CDV (Cumulative Delta Volume) is falling. My volume footprint shows no serious buyers, despite the current price push. This means the underlying strength isn't real.
Your action plan is simple: if the volume footprint turns negative, our target is a precise $100,385.
I only focus on assets with sudden volume increases. Watch the CDV and PYH level closely. Most traders miss these details, but this is where you make the most informed decisions.
Act now: Keep your eyes locked on Bitcoin. Missing this insight could cost you dearly.

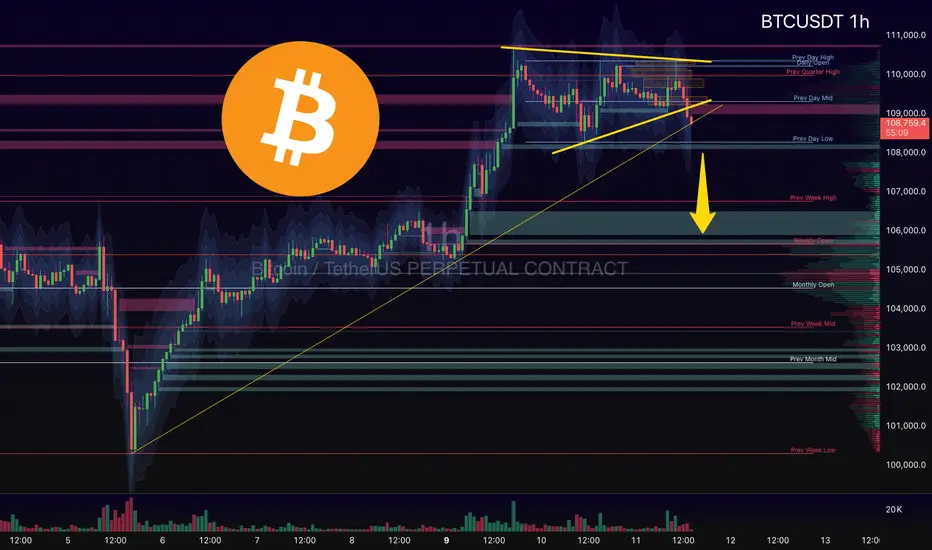
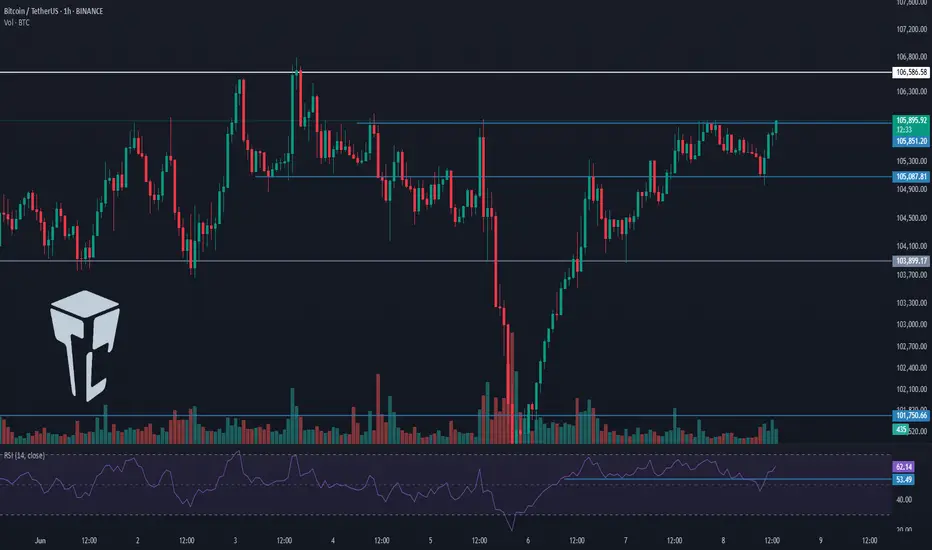
TradeCityPro | Bitcoin Daily Analysis #111👋 Welcome to TradeCity Pro!
Let’s take a look at Bitcoin and key crypto indicators. As usual in this analysis, I’ll review the futures triggers for the New York session.
⏳ 1-Hour Timeframe
As you can see in the 1-hour timeframe, none of our triggers were activated yesterday and Bitcoin has been ranging.
⭐ There was an important RSI level at 53.49, which was tested multiple times. I mentioned that breaking this level could trigger a slight correction — and that’s exactly what happened. The price pulled back slightly to 105087, retested this zone, and now RSI has returned above 53.49. Price is also moving with strong bullish momentum toward the 105851 resistance.
📊 The buying volume entering the market is quite strong, and if this increase continues, the price could begin an upward move. So in terms of both momentum and volume, we have bullish confirmation and can enter a position if the triggers activate.
📈 For a long position, the trigger we’re watching is 105851. While the main resistance is at 106586, I prefer to take the risk and open the position earlier, because I think the 106586 break won’t provide a clean entry and would be harder to act on.
✨ So my chosen trigger for a long position is 105851. Given the rising volume and high RSI momentum, we have the confirmations needed to open this trade.
🔽 For a short position, the first trigger is the break of 105087. This is a risky position since we haven’t yet confirmed a trend reversal — this would be the first signal if a downtrend begins. Personally, I’ll wait for confirmation of bearish momentum before opening a short.
👑 BTC.D Analysis
Bitcoin Dominance is still below the 64.67 level and is ranging under this resistance.
🧩 A break above 64.67 would confirm a bullish move in dominance. A break below 64.49 would signal a bearish reversal.
📅 Total2 Analysis
Total2 is ranging below the 1.15 level. A break above this zone could initiate a bullish move.
🔔 On the bearish side, the current trigger is the 1.13 level. We need to wait for this level to be broken for a trend reversal confirmation.
📅 USDT.D Analysis
Tether Dominance stabilized below the 4.79 zone yesterday and has now pulled back to it, preparing for a possible second leg downward.
🔑 If that happens, the crypto market could move upward. However, if USDT.D rises back above 4.79, its uptrend could continue.
❌ Disclaimer ❌
Trading futures is highly risky and dangerous. If you're not an expert, these triggers may not be suitable for you. You should first learn risk and capital management. You can also use the educational content from this channel.
Finally, these triggers reflect my personal opinions on price action, and the market may move completely against this analysis. So, do your own research before opening any position.
BTC:Range Likely Ahead of FOMC — Altcoin Strength Emerging📊 Bitcoin Price Update: Key Resistance Ahead – Range Likely Before FOMC
As previously discussed, Bitcoin may be entering a short-term consolidation phase. The current candlestick structure suggests that recent price action is driven by profit-taking from long positions, not aggressive selling. If bears were in control, we would have seen a deeper retracement by now — a positive sign for bulls.
Bitcoin is approaching a critical resistance zone between $110,264 and $111,782. If the price enters this range, some supply pressure is expected. However, as long as BTC holds above $107,000, the bullish market structure remains intact.
---
🔍 Key Technical Observations:
Recent candles show profit-taking, not distribution
Sellers are not yet active — indicating continued bullish sentiment
Bitcoin dominance is pulling back slightly while BTC ranges — this has led to stronger moves in altcoins
If BTC dips while dominance continues to fall, it could set the stage for an early altcoin rally (altseason)
---
🕰️ Macro Events on the Radar:
Key upcoming news:
U.S. CPI Data
FOMC Rate Decision – Wednesday next week
Until then, the market may remain range-bound as it awaits clarity
Recommendation: lower risk exposure, reduce position size, and stay selective with trades
---
⚠️ Altcoin Strategy:
If you're already in altcoin long positions, consider partial profit-taking
Watch Bitcoin dominance closely: continued downside could fuel a broader altseason
Keep an eye on BTC’s $107K support and its reaction near $111.7K resistance
---
📈 Summary:
Critical Resistance Zone: $110,264 – $111,782
Key Support: $107,000
Market Bias: Cautiously bullish
FOMC Outlook: Sideways movement likely until Wednesday
Differences Between Trading Stock Market and Coin Market
Hello, traders.
If you "Follow", you can always get new information quickly.
Have a nice day today.
-------------------------------------
Please read with a light heart.
-
Trading stock market and coin market seem similar, but they are very different.
In stock market, you have to buy and sell 1 share at a time, but in coin market, you can buy and sell in decimals.
This difference makes a big difference in buying and selling.
In the stock market, you should buy when the price is rising from a low price if possible.
The reason is that since you buy in units of 1 week, you have to invest more money when you sell and then buy to buy 1 week.
I think the same goes for the coin market, but since you can buy in decimal units, you have the advantage of being able to buy at a higher price than when you buy in the stock market.
For example, if you sell and then buy again at the same price, the number of coins (tokens) will decrease, but there will be no cases where you can't buy at all.
Therefore, the coin market is an investment market where you can trade at virtually any price range.
-
In terms of profit realization, the stock market can only be traded in a way that earns cash profits.
The reason is that, as I mentioned earlier, since you have to trade in units of 1 week, there are restrictions on trading.
However, in the coin market, in addition to the method of earning cash profits, you can also increase the number of coins (tokens) corresponding to the profits.
The biggest advantage of increasing the number of coins (tokens) corresponding to profit is that you can get a large profit in the long term, and the burden of the average purchase price when conducting a transaction is reduced.
When the price rises by purchase price, if you sell the purchase amount (+ including the transaction fee), the coins (tokens) corresponding to profit will remain.
Since these coins (tokens) have an average purchase price of 0, they always correspond to profit even if there is volatility.
In addition, even if the price falls and you buy again, the average purchase price is set low, so it plays a good role in finding the right time to buy and starting a transaction.
Of course, when the number of coins (tokens) corresponding to profit is small, it does not have a big effect on the average purchase price, but as the number increases, you will realize its true value.
You can also get some cash when you increase the number of coins (tokens) corresponding to profit.
When selling, if you add up the purchase price + transaction fee X 2~3, you can also get some cash profit.
If you get cash profit, the number of coins (tokens) remaining will decrease, so you can adjust it well according to the situation.
When the profit is large, increase the cash profit slightly, and when you think the profit is small, decrease the cash profit.
-
Therefore, when you first move from the stock market to the coin market and start trading, you will experience that the trading is not going well for some reason.
In the stock market, there are some restrictions on the rise and fall, but in the coin market, there are no restrictions, so it is not easy to respond.
However, as I mentioned earlier, the biggest problem is the difference in the transaction unit.
When trading in the stock market, you need to check various announcements and issues in addition to the chart and determine how this information affects the stock or theme you want to trade.
This is because trading is not conducted 24 hours a day, 365 days a year like the coin market.
This is because if an announcement or issue occurs during a non-trading period, the stock market may rise or fall significantly when trading begins.
-
When using my chart on a stock chart, the basic trading strategy is to buy near the HA-Low indicator and sell near the HA-High indicator.
However, if you want to buy more, you can buy more when the M-Signal of the 1D chart > M-Signal of the 1W chart, and it shows support near the M-Signal indicator of the 1W chart.
In the stock chart, it is recommended to trade when the M-Signal indicators of the 1D, 1W, and 1M charts are aligned.
The reason is that, as I mentioned earlier, trading must be done in 1-week units, so the timing of the purchase is important.
In the coin chart, you can actually trade when it shows support at the support and resistance points.
However, since trading is possible 24 hours a day, 365 days a year, even if it shows support at the support and resistance points, psychological anxiety due to volatility increases, so it is recommended to proceed with trading according to the basic trading strategy.
The creation of the HA-Low indicator means that it has risen from the low range, and the creation of the HA-High indicator means that it has fallen from the high range.
Therefore, if it shows support near the HA-Low indicator, it is likely to rise, and if it shows resistance near the HA-High indicator, it is likely to fall.
However, on the contrary, if it is supported and rises at the HA-High indicator, it is likely to show a stepwise rise, and if it is resisted and falls at the HA-Low indicator, it is likely to show a stepwise fall.
In order to confirm this movement, you need to invest a lot of time and check the situation in real time.
-
Thank you for reading to the end.
I hope you have a successful transaction.
--------------------------------------------------
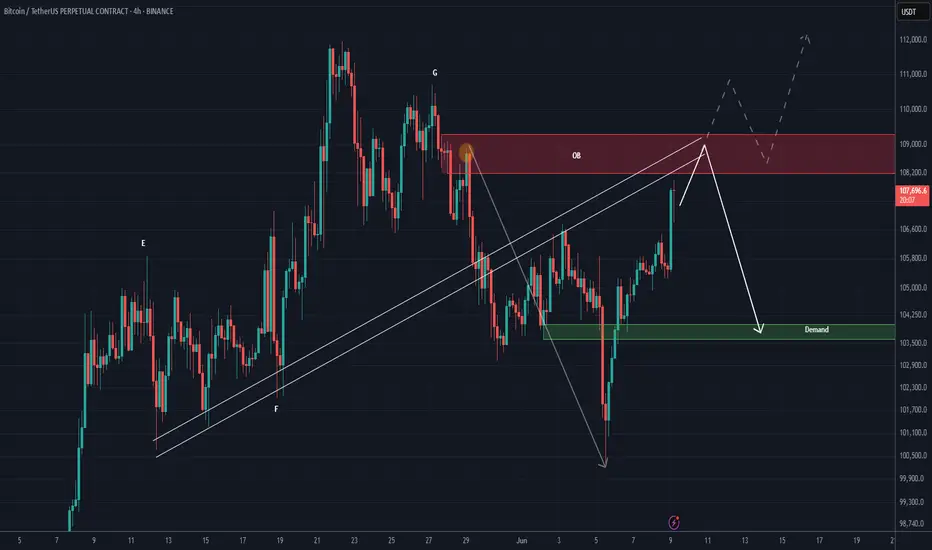
BTC NEW UPDATE (4H)This analysis is an update of the analysis you see in the "Related publications" section
These days, Bitcoin's movement is mostly driven by liquidity hunting and is caught in complex and risky corrections.
The resistance zone currently in front of Bitcoin is marked in red. If the price is going to get rejected, it should happen from this zone. However, if this zone is broken and price stabilizes above it, Bitcoin could turn bullish again.
Considering today is Monday, volumes are still low, and the price is near a strong order block | you should be careful with your positions.
For risk management, please don't forget stop loss and capital management
Comment if you have any questions
Thank You
BTCUSDT Trend Analysis and Trading RecommendationsToday's overall BTC market rebounded after hitting a low of 102,614 in the early trading session, with Bitcoin's price maintaining a slow upward trend throughout the day. The intraday high reached 105,912 but encountered resistance. As the weekend approaches, historical market data shows limited volatility during weekends, so range-bound fluctuations are expected for the weekend.
From the current overall market rhythm, the price has rebounded slightly today after the previous decline. The hourly chart shows consecutive upward candles, though the price movement remains relatively slow. As time progresses, the price is expected to sustain an upward trend after pullbacks, and breaking through the short-term resistance level is only a matter of time. In terms of short-term structure and pattern, despite slight resistance and minor pullbacks, the downward momentum has weakened. We can still focus on long positions at lower levels, paying attention to the 106,000 resistance level.
BTCUSD
buy@104000-104500
tp:106000-107000
Investment itself is not the source of risk; it is only when investment behavior escapes rational control that risks lie in wait. In the trading process, always bear in mind that restraining impulsiveness is the primary criterion for success. I share trading signals daily, and all signals have been accurate without error for a full month. Regardless of your past profits or losses, with my assistance, you have the hope to achieve a breakthrough in your investment.
BITCOINThe Federal Reserve is likely to interpret the June 2025 University of Michigan (UoM) consumer sentiment and inflation expectations data as mixed but cautiously encouraging, with implications for monetary policy:
Key Data Points
Consumer Sentiment: 60.5 (vs. 53.5 forecast, prior 52.2) – a sharp rebound to the highest level since mid-2023.
1-Year Inflation Expectations: 5.1% (vs. 6.6% prior) – a significant decline, nearing pre-tariff levels.
Fed Interpretation
Improved Consumer Sentiment:
The jump to 60.5 signals renewed optimism about the economy, likely driven by reduced trade tensions (e.g., tariff pauses) and stable labor markets. This aligns with recent upward revisions to April and May sentiment data.
The Fed will view this as a sign of economic resilience, reducing urgency for near-term rate cuts to stimulate growth.
Sharply Lower Inflation Expectations:
The drop to 5.1% (from 6.6%) aligns with the New York Fed’s May 2025 survey showing declining inflation expectations across all horizons.
This suggests consumers are growing more confident that the Fed’s policies (and tariff adjustments) are curbing price pressures, easing fears of a wage-price spiral.
Policy Implications:
Dovish Tilt Supported: Lower inflation expectations reduce the risk of entrenched price pressures, giving the Fed flexibility to cut rates later in 2025 if growth slows.
No Immediate Cuts Likely: Strong sentiment and a resilient labor market (unemployment at 4.2%) justify maintaining rates at 4.25–4.50% in July.
Focus on Tariff Risks: The Fed will remain cautious about potential inflation rebounds from Trump’s tariffs, which could add 1.5% to prices by late 2025.
Market Reactions
DXY (Dollar Index): Likely to dip modestly as lower inflation expectations boost rate-cut bets, but sentiment-driven growth optimism may limit losses. Key support at 98.00–98.20.
Bonds: 10-year yields may edge lower (toward 4.00%) on reduced inflation fears, though strong sentiment could cap declines.
Equities: Stocks (especially consumer-discretionary sectors) may rally on improved economic outlook.
Conclusion
The Fed will likely view this data as validating its cautious stance: inflation expectations are cooling, but strong sentiment and labor markets argue against premature easing. A September rate cut remains the base case, contingent on continued disinflation and no tariff-driven price spikes. Traders should watch for June CPI (July 11) and Q2 GDP to confirm trends.
#bitcoin #dollar

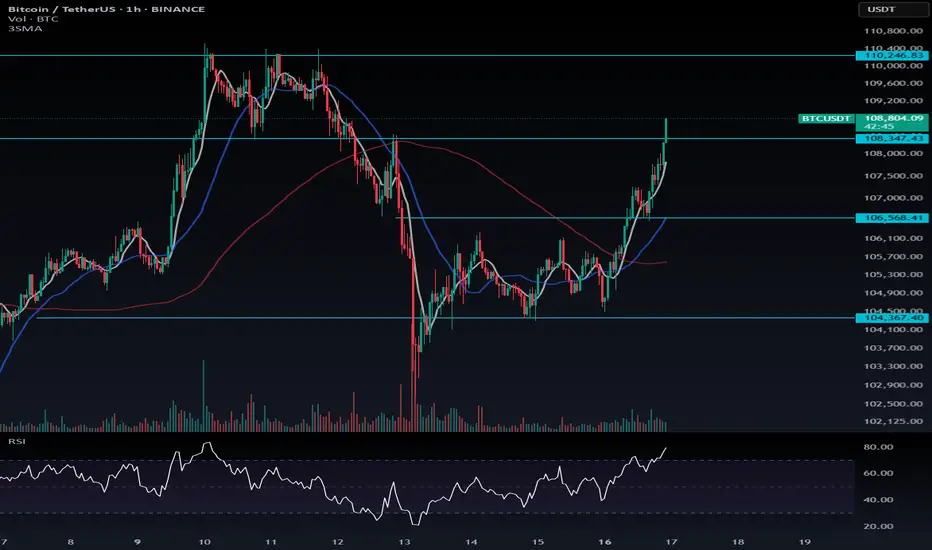
BTC Rally in Play — Time to Lock In Profits and Wait for FOMC?📈 Bitcoin Rally in Play — Time to Lock In Profits and Wait for FOMC?
After the expected upward move, I believe now is a good time to either close your positions or secure partial profits, whether you're in Bitcoin or altcoins. The market will offer new opportunities, so there’s no rush.
With the upcoming FOMC meeting on Wednesday, I suggest holding off on new entries until the news is out and volatility settles.
Currently, the resistance at $108,347 isn’t confirmed as valid yet — but if we see a rejection from that level, it could become a short-term barrier. On the downside, to maintain this recent bullish momentum, the support at $106,568 must hold.
---
💬 How are you managing your trades ahead of the FOMC? Took profits already or still holding? Drop a comment below — always good to hear your plan!