BITCOINThe Federal Reserve is likely to interpret the June 2025 University of Michigan (UoM) consumer sentiment and inflation expectations data as mixed but cautiously encouraging, with implications for monetary policy:
Key Data Points
Consumer Sentiment: 60.5 (vs. 53.5 forecast, prior 52.2) – a sharp rebound to the highest level since mid-2023.
1-Year Inflation Expectations: 5.1% (vs. 6.6% prior) – a significant decline, nearing pre-tariff levels.
Fed Interpretation
Improved Consumer Sentiment:
The jump to 60.5 signals renewed optimism about the economy, likely driven by reduced trade tensions (e.g., tariff pauses) and stable labor markets. This aligns with recent upward revisions to April and May sentiment data.
The Fed will view this as a sign of economic resilience, reducing urgency for near-term rate cuts to stimulate growth.
Sharply Lower Inflation Expectations:
The drop to 5.1% (from 6.6%) aligns with the New York Fed’s May 2025 survey showing declining inflation expectations across all horizons.
This suggests consumers are growing more confident that the Fed’s policies (and tariff adjustments) are curbing price pressures, easing fears of a wage-price spiral.
Policy Implications:
Dovish Tilt Supported: Lower inflation expectations reduce the risk of entrenched price pressures, giving the Fed flexibility to cut rates later in 2025 if growth slows.
No Immediate Cuts Likely: Strong sentiment and a resilient labor market (unemployment at 4.2%) justify maintaining rates at 4.25–4.50% in July.
Focus on Tariff Risks: The Fed will remain cautious about potential inflation rebounds from Trump’s tariffs, which could add 1.5% to prices by late 2025.
Market Reactions
DXY (Dollar Index): Likely to dip modestly as lower inflation expectations boost rate-cut bets, but sentiment-driven growth optimism may limit losses. Key support at 98.00–98.20.
Bonds: 10-year yields may edge lower (toward 4.00%) on reduced inflation fears, though strong sentiment could cap declines.
Equities: Stocks (especially consumer-discretionary sectors) may rally on improved economic outlook.
Conclusion
The Fed will likely view this data as validating its cautious stance: inflation expectations are cooling, but strong sentiment and labor markets argue against premature easing. A September rate cut remains the base case, contingent on continued disinflation and no tariff-driven price spikes. Traders should watch for June CPI (July 11) and Q2 GDP to confirm trends.
#bitcoin #dollar
BTCUSDT.P trade ideas

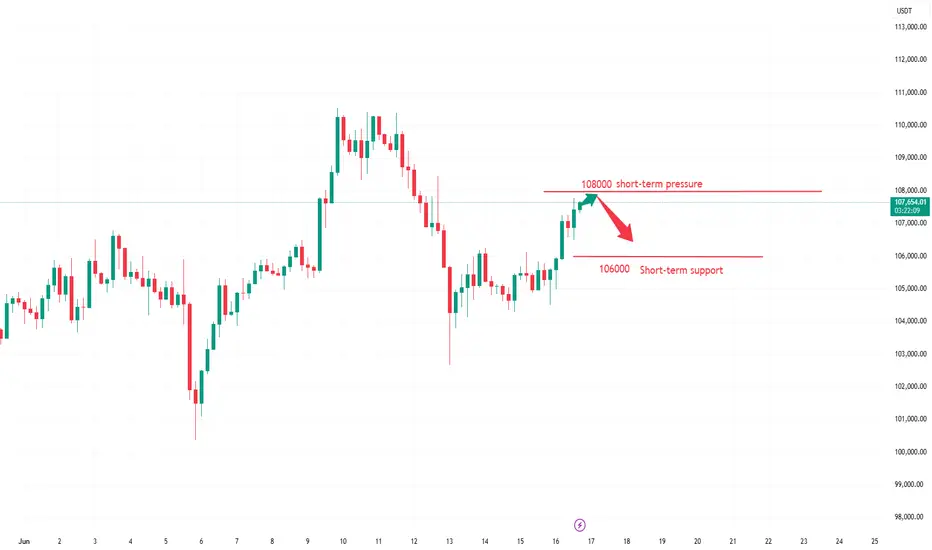
BTC Rally in Play — Time to Lock In Profits and Wait for FOMC?📈 Bitcoin Rally in Play — Time to Lock In Profits and Wait for FOMC?
After the expected upward move, I believe now is a good time to either close your positions or secure partial profits, whether you're in Bitcoin or altcoins. The market will offer new opportunities, so there’s no rush.
With the upcoming FOMC meeting on Wednesday, I suggest holding off on new entries until the news is out and volatility settles.
Currently, the resistance at $108,347 isn’t confirmed as valid yet — but if we see a rejection from that level, it could become a short-term barrier. On the downside, to maintain this recent bullish momentum, the support at $106,568 must hold.
---
💬 How are you managing your trades ahead of the FOMC? Took profits already or still holding? Drop a comment below — always good to hear your plan!
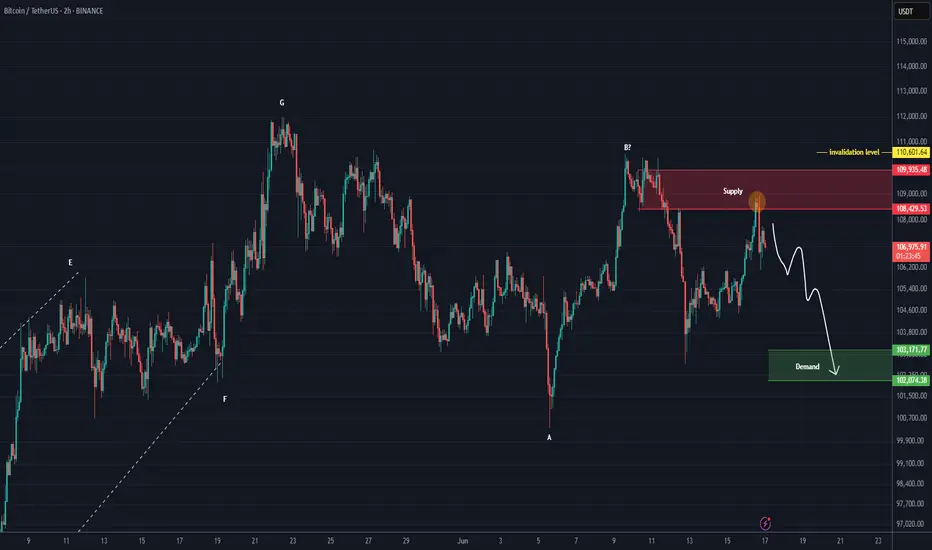
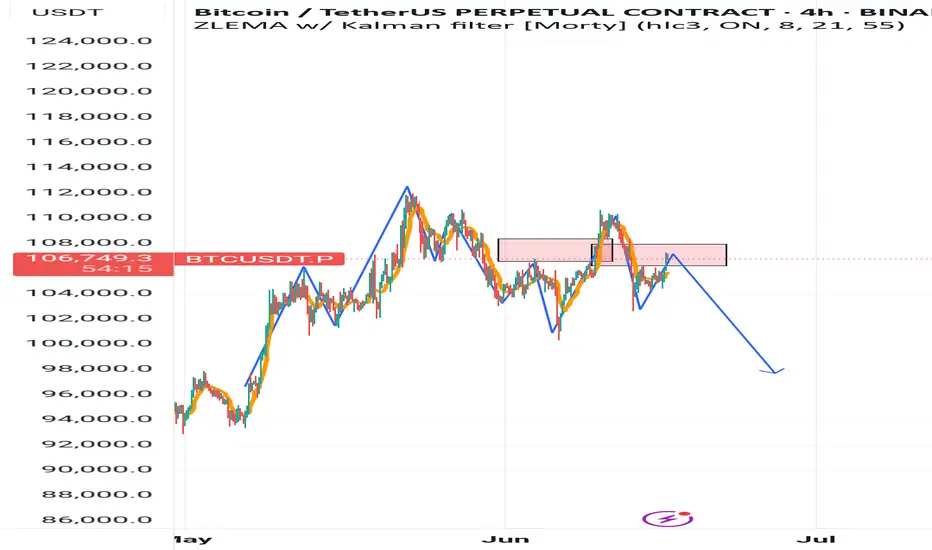
BTC is still bearish (2H)This analysis is an update of the analysis you see in the "Related publications" section
The red zone seems to have had enough orders to reject the price downward. It is expected that the price will drop at least to the green zone below.
There will be some fluctuations along the way.
A daily candle closing above the invalidation level would invalidate this analysis.
For risk management, please don't forget stop loss and capital management
Comment if you have any questions
Thank You
Bitcoin Market Analysis and Future Trend ForecastThe Bitcoin market has once again become the focus of investors. The price of Bitcoin has shown a significant upward trend, successfully breaking through the key resistance level of $106,000 per coin with an intraday increase of over 2%, demonstrating the strong vitality of the market. This price movement not only reflects the warming of positive sentiment in the cryptocurrency market but also indicates the gradual recovery of investor confidence, which has become the core driving force behind Bitcoin's current rally.
Currently, the Bitcoin price is at a critical juncture. From a daily chart perspective, after reaching an intraday high of $107,265, Bitcoin failed to effectively break through the key resistance level of $108,000 and has since retracted to fluctuate around $106,940. On the 4-hour timeframe, the MACD indicator shows that the histogram remains in positive territory, but the rate of increase has slowed, suggesting a short-term weakening of bullish momentum. Meanwhile, the RSI indicator stands at around 65, approaching the overbought zone, indicating that the market faces short-term correction pressure.
you are currently struggling with losses,or are unsure which of the numerous trading strategies to follow,You have the option to join our VIP program. I will assist you and provide you with accurate trading signals, enabling you to navigate the financial markets with greater confidence and potentially achieve optimal trading results.
Trading Strategy:
sell@107500-108000
TP:106000-106500
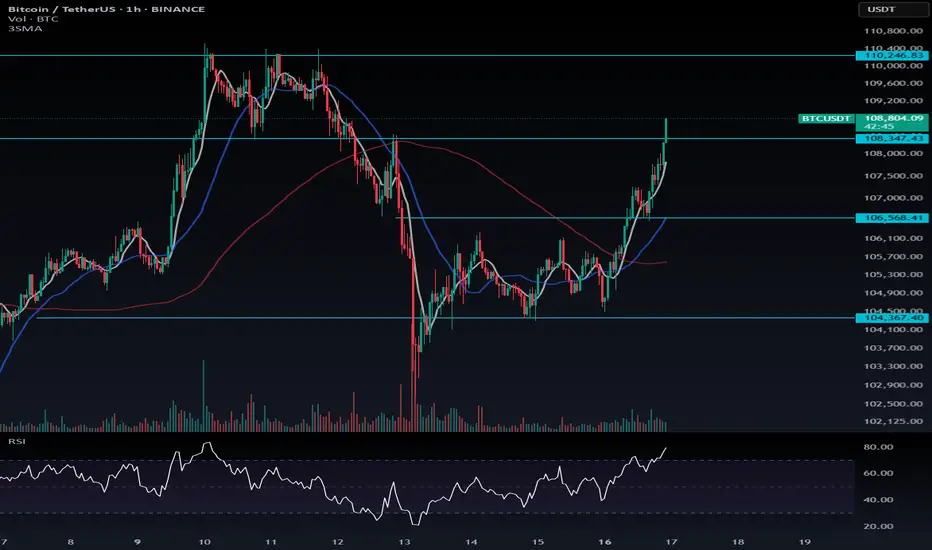
BTC Long Setup (Short-Term)🚀 BTC Long Setup (Short-Term)
Bitcoin is showing bullish momentum and holding key support levels.
I’m eyeing a short-term long position with a target at 108,294.
If momentum continues, this could be a strong push toward the next resistance zone.
📈 Stay sharp and follow the levels!

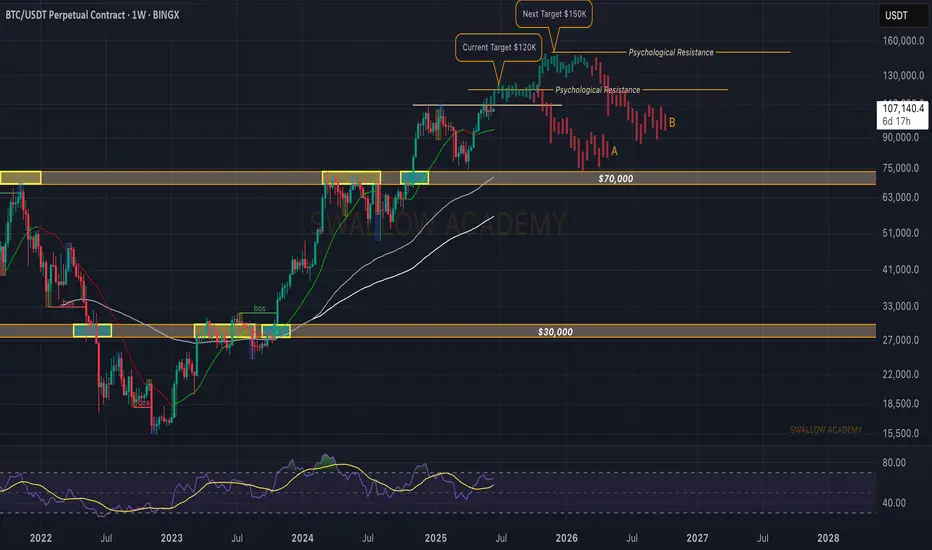
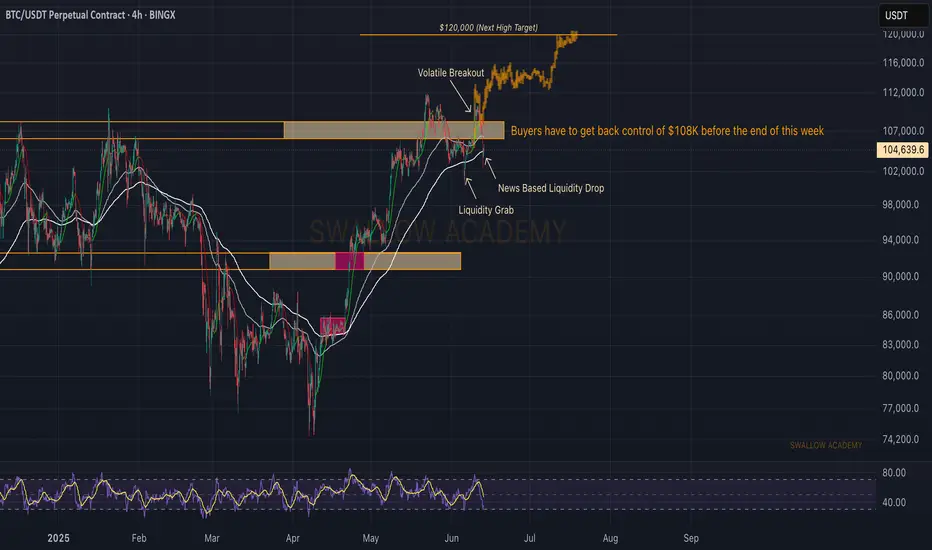
Bitcoin (BTC): Gameplan Remains Same | Bullish Start of WeekBitcoin is showing signs of recovery, where buyers are taking over the Monday lows and pushing prices to upper zones. Now that we see the recovery, we are back in play, expecting the price to reach the ATH area once again, where we will be looking then for $120K.
Swallow Academy
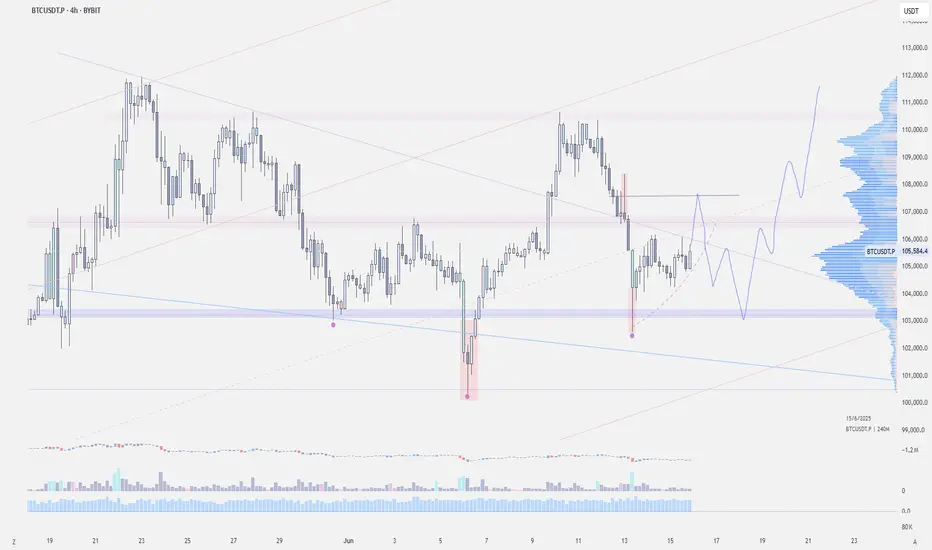
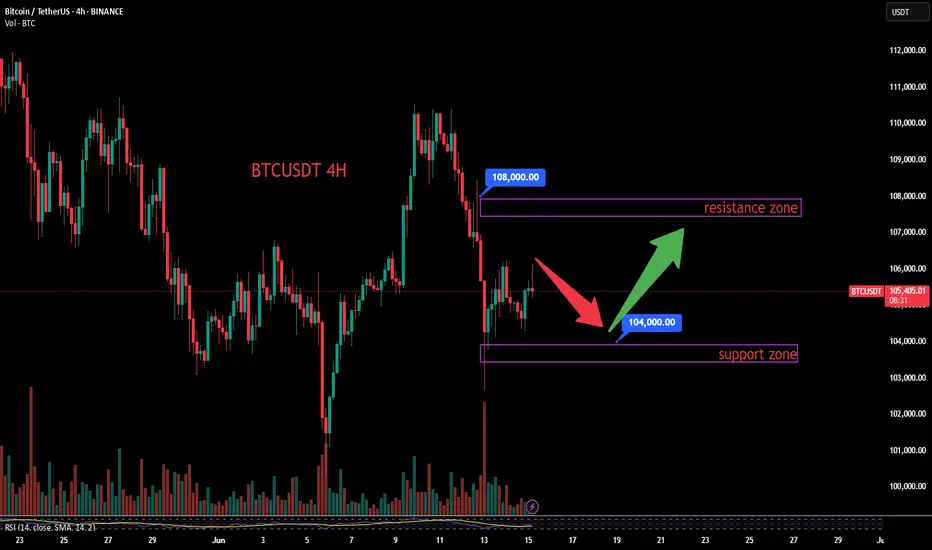
$BTC - Weekend LTF OutlookBINANCE:BTCUSDT | 4H
We've got a swing point retest here on the 4-hour timeframe.
Immediate resistance at 106k, but I'm eyeing the internal liquidity — the wicks on both sides.
Most likely it’ll fill the upper wick first (107.3k–107.8k). If we reject there again, we could sweep the lower wick around 103.5k–103k.
Bitcoin Double Top FormationIf we lose 102k we will dump to 97-93k and alt will rugged
but if we can hold maybe sideway and retest 110k again

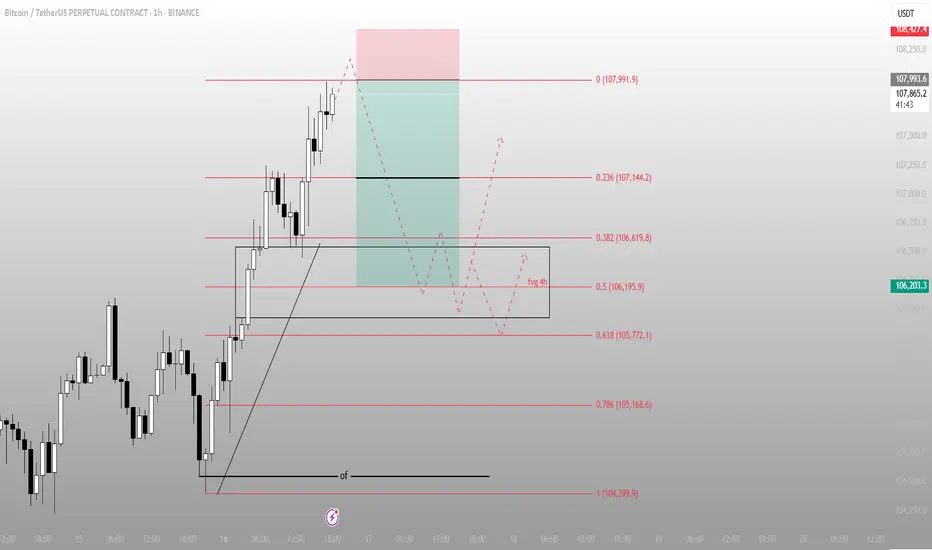
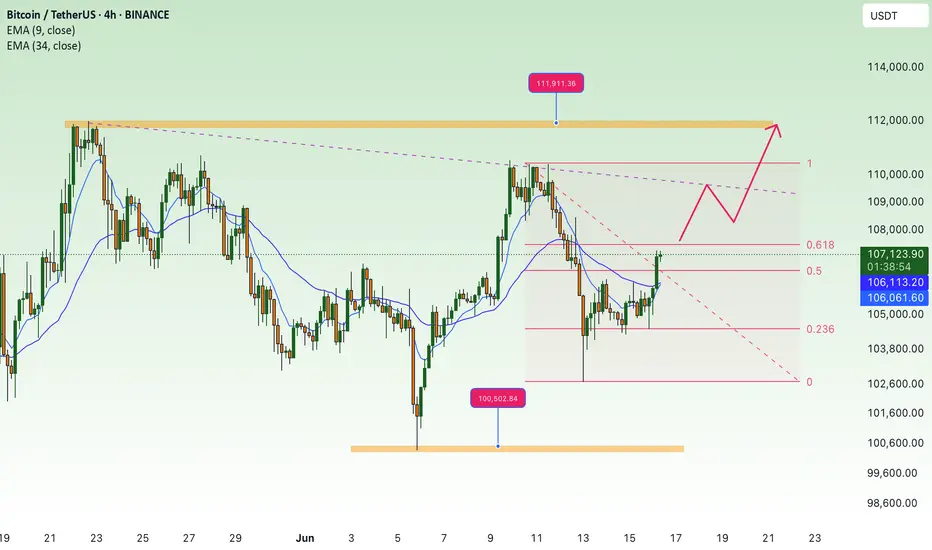
That wasn’t a breakout. That was the stop runBTC swept the high into 107,991 — precision tap of the premium fib. Now the delivery shifts. Price has already done its job: take liquidity, trigger late longs, and set up the real move.
Here’s the execution breakdown:
Price tagged the 0 level of the fib extension — 107,991 — and rejected
A clean 4H FVG sits just below around 106,195.9 (0.5), aligned with 0.382 and 0.618 fib levels (106,619.8 to 105,772.1)
This is the re-entry zone for Smart Money — not the top chasers
Expectations from here:
→ Rebalance into the 106.6–105.7k region
→ If that zone holds and price shifts structure bullish again, we retest 107.1 → 107.9 → break higher
→ If we lose 105.7 cleanly, I’m watching 104,399.9 — the deeper inefficiency magnet
This isn’t about confirmation. It’s about preparation.
More trades like this — clean, controlled, conviction-based — live in the profile description.
BTC to new ATH - 115K? When? OWing to the MP and TPO's
The current market profile indicates that Bitcoin has recently experienced a sharp move up, forming a double distribution structure with value areas clearly separated. Price attempted to hold above the upper distribution’s value area high but failed and is now back inside the lower distribution, suggesting rejection at higher prices. This opens up a potential short opportunity if price retests the 109650 to 110000 zone and shows weakness, with a possible target near 107300 to 107000 where the previous low-volume node and value area low are located. On the other hand, the area around 106600 to 106800 has acted as a strong support zone during the earlier rally. If the price moves down and shows signs of absorption or support near this zone, it may offer a favorable long opportunity back toward 108300 to 108500, where the previous value area high lies. The market is currently in a responsive phase, and directional bias should depend on how price reacts around these key zones.
What i see is what i learned, and i do expect a straight fall down but cant forget the small OB which can pull things up! Sideways momentum to NEW ATH

BTC BITCOIN Bitcoin buy level on the green structure to watch will be on the 100k and my next buy watch zone will be 97-98k .
Growing institutional participation, including the launch and approval of Bitcoin ETFs is increasing liquidity and legitimizing BTC as an investment asset.
Macroeconomic Environment , Persistent low real interest rates by central banks and concerns about inflation support demand for Bitcoin as a store of value.
Geopolitical uncertainties and currency debasement fears boost Bitcoin’s appeal as a digital gold.
Bitcoin’s network security, hash rate, and active addresses remain robust, underpinning confidence in its decentralized infrastructure.
Continued development in scaling solutions and layer-2 technologies enhances usability.
Increasing regulatory clarity worldwide, including clearer frameworks for crypto exchanges and custodians, reduces uncertainty and encourages adoption.
However, regulatory risks remains a factor that can cause short-term volatility.
#bitcoin #btc

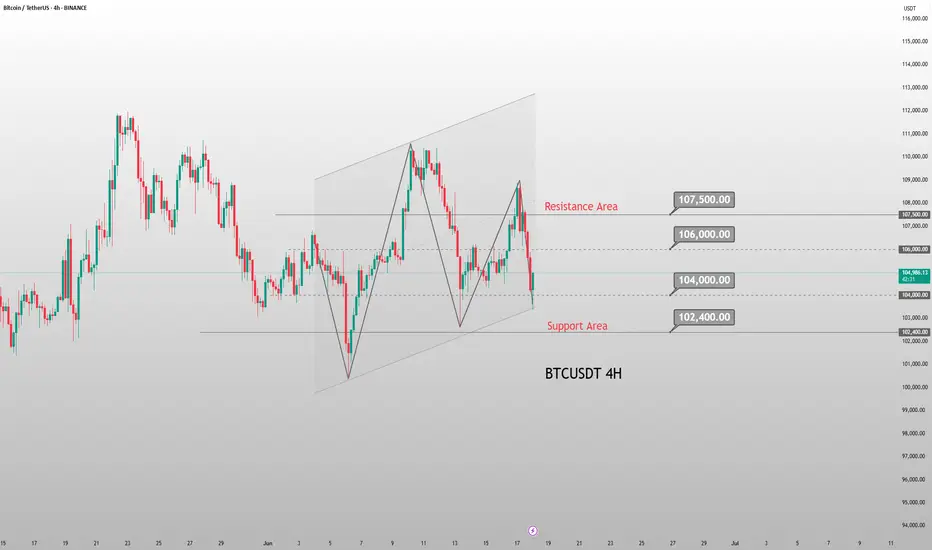
Current BTC Trend Analysis and Trading RecommendationsThe daily candlestick chart of BTC shows a three - day consecutive bearish retracement, having fallen back to the vicinity of the starting point of the previous pinbar rebound and currently remaining in a recent low - level sideways consolidation zone. However, the 4 - hour trend is pressured by the middle band of the Bollinger Bands, staying within a downward channel and forming a rebound - retracement wave pattern.
For short - term strategies, anticipate a further retracement first. Long positions should be initiated only after the support level is confirmed valid. This retracement represents a necessary consolidation phase before the bullish trend continues, and the current adjustment range does not pose a substantial threat of trend reversal to the overall uptrend. With the core upward trend intact and the direction remaining clear, BTC is expected to resume its upward momentum after a brief consolidation. The operational approach remains to go long on retracements.
BTCUSD
buy@103500-104000
tp:105500-106500
Investment itself is not the source of risk; it is only when investment behavior escapes rational control that risks lie in wait. In the trading process, always bear in mind that restraining impulsiveness is the primary criterion for success. I share trading signals daily, and all signals have been accurate without error for a full month. Regardless of your past profits or losses, with my assistance, you have the hope to achieve a breakthrough in your investment.
BTCUSDT: Sharing of the Latest Trading StrategyAll the trading signals today have resulted in profits!!! Check it!!!👉👉👉
Fundamental Analysis:
Expectations of potential regulatory easing by the U.S. Securities and Exchange Commission (SEC) on cryptocurrencies, coupled with rising interest from global institutional investors in crypto-asset allocation, have positively impacted the Bitcoin market.
Sustained net inflows into Bitcoin ETFs in recent days reflect market optimism about its long-term prospects.
Technical Analysis:
On the 4-hour chart, Bitcoin prices have found support multiple times within the $102,000–$104,000 range, forming a strong support level.
The MACD indicator remains above the zero line, with histograms contracting but still positive, indicating lingering bullish momentum. The DIF and DEA lines maintain a bullish configuration.
In the Bollinger Bands, price is trading near the middle band (currently at $104,700), which acts as support. A valid break above the middle band could unlock upward potential, with overhead resistance at $108,000.
Long Strategy:
Aggressive traders may initiate light long positions as price pulls back to the $104,700–$105,000 zone, setting a stop-loss below $104,000 and targeting $108,000.
Trading Strategy:
buy@ 104700–105000
TP:106000-108000
Share accurate trading signals daily—transform your life starting now!
👇 👇 👇 Obtain signals👉👉👉
Accumulate, BTC back above 110K💎 BTC PLAN UPDATE (June 16)
NOTABLE BITCOIN (BTC) NEWS:
Bitcoin (BTC), Ethereum (ETH), and Ripple (XRP) are showing signs of stabilization around key support levels following last week’s correction. BTC is attempting to regain momentum after closing below a critical support zone, while ETH and XRP are hovering near technical thresholds that could determine their next directional move.
TECHNICAL ANALYSIS OUTLOOK:
Bitcoin could decline further if it closes below the 50-day EMA
Bitcoin closed below its daily support at $106,406 on Thursday, then bounced back after retesting the 50-day Exponential Moving Average (EMA) at $102,893 on Friday. BTC has since stabilized around the $105,000 level over the weekend. As of Monday, it continues to consolidate, trading near $105,788.
If BTC fails to close above the $106,406 resistance level and heads lower, it may extend its decline toward the psychologically significant $100,000 level.
The Relative Strength Index (RSI) on the daily chart is hovering around the neutral 50 mark, signaling indecision among traders. Meanwhile, the Moving Average Convergence Divergence (MACD) indicator shows a bearish crossover on the daily chart, indicating selling pressure and a possible downtrend continuation.
At this stage, whether you're new or experienced, it's wise to spend more time practicing, deepening your technical analysis knowledge, and exploring educational content shared on the channel. Strengthening your foundation will help you protect your capital in this volatile environment.
==> This analysis is for trend reference only. Wishing all investors successful trades!
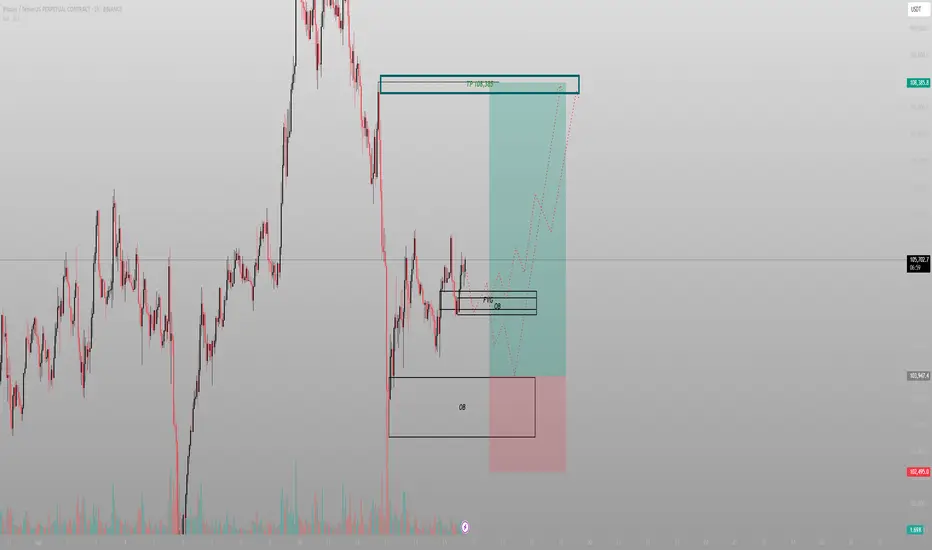
The FVG was the invitation. The OB was the entryBTC delivered exactly where it needed to. It didn’t break down. It rebalanced. The chart isn’t noisy — it’s speaking. And it’s pointing to 108.3k.
The logic:
Price printed clean displacement, returned to mitigate a 1H FVG stacked on top of a refined Order Block, then paused. That pause is structure — not indecision. Volume compression confirms it: absorption, not rejection.
A deeper OB sits below at 102.5k. If we tap it, it’s not invalidation — it’s refinement. But the primary play is already in motion.
The path:
Reclaim 105.7k range high
Break above intraday liquidity
Deliver to 108.3k inefficiency fill
Execution:
Entry: 104.8k–105.1k (current OB zone)
SL: Below 103.9k
TP: 108.3k
Don’t react to the candles. React to what they represent — engineered displacement followed by precision mitigation.
Final thought:
“This isn’t a trade setup. It’s a delivery route — and I’m already onboard.”
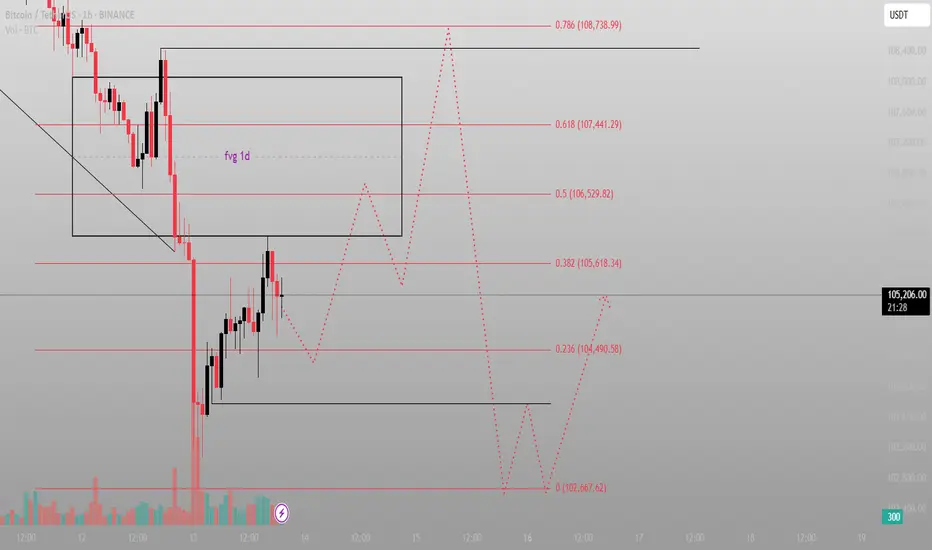
The FVG above isn’t the target. It’s the bait.This is a classic Smart Money sequence. Most are watching the imbalance at 106.5k–108.7k and expecting immediate delivery. But that’s not how this game works.
The setup:
Price broke down violently, then reversed with momentum — stopping right beneath the daily FVG block. That alone tells me it’s not ready. It’s gathering.
Below? Multiple fib levels that haven’t been tested — 104.4k (0.236), 102.6k (0.0), and a volume-backed rejection wick that still holds weight.
The market is likely to dip again — pull into deeper discount, reset the low timeframe narrative — and only then attack the FVG and upper sweep zones.
What I expect:
Sweep of 102.6k (final liquidity run)
Reaction → reclaim 104.4k
Push into the FVG toward 106.5k (0.5) and possibly 107.4k (0.618)
No emotional reaction to the red candles — this is structure playing out, not weakness unfolding.
Plan:
Ideal Entry: 102.8k–103.2k range
SL: Below 102.6k
TP1: 105.6k
TP2: 107.4k
Final: 108.7k clean inefficiency fill
Let it dip. Let it breathe. That’s where conviction is built.
Final thought:
“The real move starts when they convince you it’s done.”
Bitcoin (BTC): Strong Selloff | Sellers Taking OverBitcoin is bleeding due to the economic news. Escalating tensions between Iran and Israel, with reports of Israel possibly preparing military action against Iran, have triggered a strong selloff on BTC, which might send the price back below the 100K area if buyers do not manage to take back control over the $108K area.
We are in a big tension zones currently so we will be waiting to see how everything escalates. If buyers fail to show dominance anytime this week, we will be switching our view to bearish.
Swallow Academy
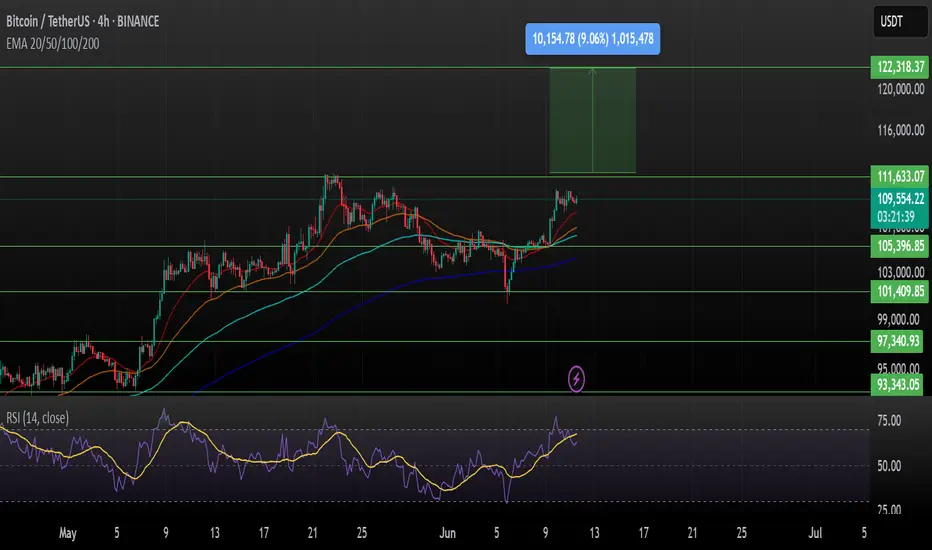
BTCUSDT – Bullish Continuation Setup (4H Chart)Bitcoin shows a strong bullish structure on the 4H timeframe after breaking and holding above key EMAs (20/50/100/200). Price is consolidating just above the breakout zone, suggesting potential continuation.
Support Levels:
$105,396
$101,409
$97,340
$93,343
Resistance Levels:
Immediate: $111,633
Major Target: $122,318 (+9.06% potential upside)
Indicators:
RSI: Holding at ~63.7, still below overbought — suggests room for momentum.
EMA Confluence: All major EMAs are aligned below price, acting as dynamic support.
If BTC holds above $109K, a move toward $122K looks likely. A clean breakout above $111.6K could ignite the next leg up.
Bullish bias intact
Target: $122,318
Risk Management: Watch for invalidation if price breaks below $105K.
This is not financial advice, please do your research before investing, as we are not responsible for any of your losses or profits.
Please like, share, and comment on this idea if you liked it.
#BTCUSDT #Bitcoin #Crypto #TradingView
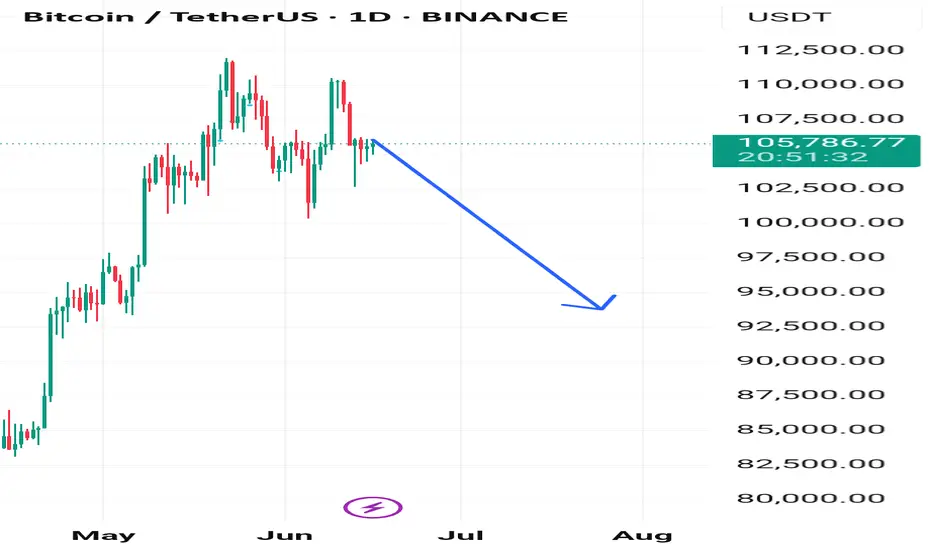
Crypto Crash Is Coming! Time to sell everythingThe war is escalating every day, major hits in Tel Aviv , Haifa and big cities. US will get involved wether they want it or not, since Israel doesnt want to stop the war without fully destroying all threats and leaders, and it can't finish the war alone.
Btc have to fill the monthly gap, crash is coming.
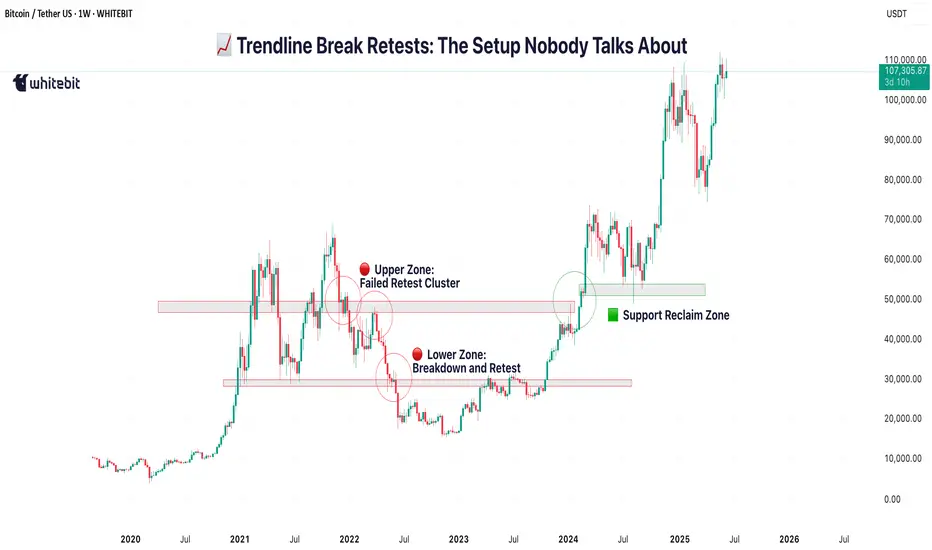
Trendline Break Retests: The Setup Nobody Talks AboutHello, Traders! 😎
It’s one of crypto's most overlooked yet commonly recurring structures: the trendline break and retest.
You’ve probably seen it without even realizing it. A clean trendline gets broken, price pulls away, and then, quietly, almost politely, comes back to “kiss” the line before taking off again. Or dropping.
That’s the retest. And in the chaotic crypto world, where hype often drowns out structure, this simple behavior deserves more attention.
🔍 First, What Is a Trendline Really?
A crypto trendline connects key highs or lows on a chart, not to predict the future, but to help visualize the mean price trendline: the market's directional bias. In rising markets, we draw support lines connecting higher lows. In falling markets, resistance lines link lower highs.
Learning how to draw trendlines in crypto properly is a skill in itself. Use wicks or closes? Log scale or linear? Everyone has a method, but consistency is key. If you’re unsure, zoom out and let the chart speak first. But once that line is broken, something changes.
🧠 Why Breaks (Alone) Are Not Enough
In theory, a break of the trendline means momentum has shifted. But in practice? Breaks happen all the time in crypto; many are fakeouts or short-lived. That’s where the trendline break and retest come in. It’s the market asking: “Are we done with this trend?”
Retests often create the cleanest entries for trend continuation, not because they guarantee success, but because they offer structure. They provide a technical “moment of truth” when buyers or sellers show their true strength. And if the retest holds? The move that follows tends to be more confident and less noisy.
📐 Trendline Break & Retest: Mapping the Larger Structure
Looking across the full BTC/USDT weekly chart, several major shifts can be framed through the lens of trendline crypto behavior, particularly the classic sequence of break → retest → continuation.
🔻 2021–2022: Macro Breakdown
After the bull run to ~$69K in 2021, Bitcoin started forming a descending series of lower highs, which gave rise to a macro-level downward trendline — a key reference point for many traders at the time.
🔴 Upper Zone: Failed Retest Cluster
The upper horizontal band (~$47K–$52K) highlights a zone where BTC repeatedly attempted to reclaim the broken structure. Each time the price rallied into this region, sellers stepped in, forming local highs and multiple failed retests (marked with red circles). This wasn’t just resistance — it was a battleground where buyers tried to flip the trend… and couldn’t. This behavior often signals a trendline break rejection, where the market tests the underside of prior structure, then resumes the existing trend.
🔴 Lower Zone: Breakdown and Retest That Held
The lower zone (~$28K–$32K) was formerly a strong support area during mid-2021. Once it was broken in early 2022, the price returned to retest from below, failing to reclaim it, confirming it had turned into resistance. This is a textbook example of trendline retest turned supply, and after the failed reclaim, BTC slid further into the ~$16K range.
✂️ Late 2023: The Breakout
In late 2023, BTC finally broke above the descending trendline, confirming a long-term shift in momentum. Importantly, this wasn’t just a clean breakout. The market returned shortly after to retest the broken trendline, around the $42K–46K range, forming a consolidation zone.
🟩 And Then Came the Retest from Above
Let’s fast-forward to early 2024. After months of chop, Bitcoin finally breaks through that upper red zone (the same one that previously acted as resistance and rejection city). But here’s the part many miss:
It didn’t just moon.
It came back.
Look closely at the green zone around ~$46K–$48K, the same area where BTC got rejected multiple times in 2021–2022. And now? Price pulls back, taps that level from above, and holds.
That makes this zone so interesting: 👉 It’s a classic “retest from the other side”, where former resistance becomes support. The market is saying: “This level matters. Let’s make sure it holds before we go further.” It’s a quiet confirmation and a great example of how crypto trendlines and price memory shape behavior, even months or years later.
🪞 It’s Not Just About Lines — It’s About Psychology
Why does this pattern repeat?
Because breakouts are emotional.
They create FOMO. Traders rush in. Then the market pauses, tests your conviction, and shakes out the impatient.
Retests act like a filter.
They flush out the noise — and confirm who’s really in control.
That’s why drawing trendlines in crypto isn’t just about geometry. It’s about crowd behavior. When enough traders see the same line, and price respects it after the break, it becomes a self-fulfilling zone of interest.
🧭 A Word of Caution
This isn’t a secret formula. Not every trendline crypto setup will play out cleanly.
SOME BREAKS NEVER RETEST.
SOME RETESTS FAKE YOU OUT.
AND SOMETIMES, THE LINE YOU DREW ISN’T THE ONE THE MARKET IS ACTUALLY WATCHING.
But if you learn to draw trendlines in crypto clearly, stay patient, and observe the trendline break retest behavior, you’ll begin to see this pattern appear again and again. Quietly. Consistently.
It won’t make the headlines like “BTC Hits 100K,” but it might just tell the story behind that move. This is just one example. In reality, charts are full of these zones. Each one tells a part of the story. And honestly, why not listen?
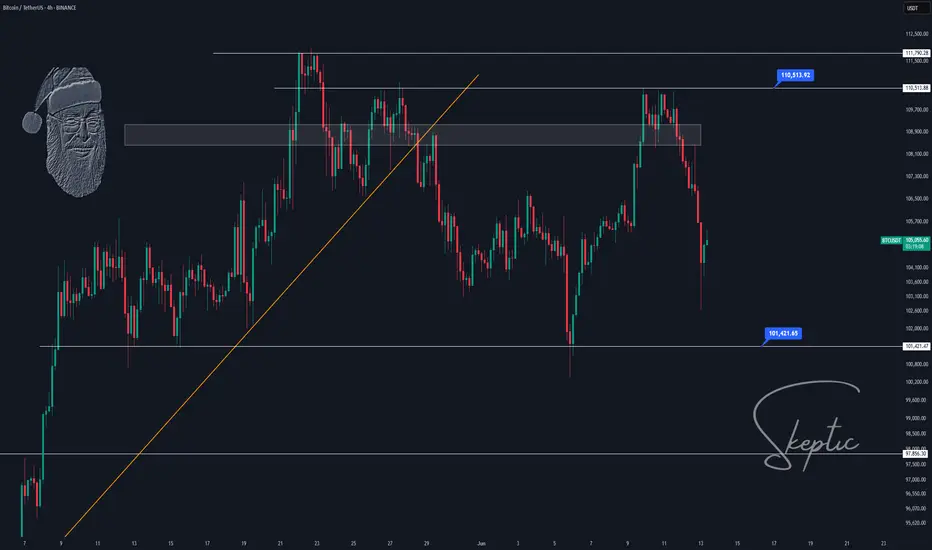
BTC - On its way down from these trendlines How low can we go? We will find out.
Three bearish intersecting trendlines above.
Short began initiating from above as per my previous post.
I personally am not ruling out a flash crash to 10,000.
DXY is breaking down a major bearish trendline on the weekly / monthly - Market has a prime opportunity to manipulate Bitcoin into all of these long stop losses and trigger a massive liquidation event.
Stay alert and safe!

Markets Crash: Gold Soars, Crypto Dips!Israel’s strikes on Iran shook markets—Bitcoin and stocks tanked, gold soared. What’s next? Let’s unpack the best trading moves for this chaos!
Hey traders, Skeptic here!👋 Yesterday’s Israeli strikes on Iran’s military and nuclear sites, plus high-profile casualties, sent markets into a tailspin. If your positions got stopped out today, don’t sweat it—that’s normal in this mess. Today, I’m breaking down the most likely scenarios for financial markets, especially stocks and crypto, with no FOMO, no hype, just reason. Stick with me to navigate this storm!
📉Right now, markets are screaming risk-off . Stocks like the S&P 500, indices, and crypto like Bitcoin are bleeding as buyers have zero confidence. Everyone’s piling into safe-haven assets like gold, the Japanese yen, and the Swiss franc. Last night’s news triggered sharp drops in Bitcoin and SPX500, while gold’s rallying hard. This is classic flight-to-safety behavior, and it’s why your stops might’ve been hit. Let’s dive into the geopolitical scenarios driving this and then get to the charts.
📍First, the big picture.
Scenario one: Iran retaliates for Israel’s strikes, and we’re stuck in a tit-for-tat escalation for weeks. Markets stay risk-off, stocks and crypto keep sliding, and safe havens like gold thrive.
Scenario two: The US-Iran nuclear talks on Sunday, June 15th, lead to a deal, tensions cool, and markets stabilize. If those talks fail, I’m not optimistic— recent US inflation relief, might’ve pushed the Federal Reserve toward rate cuts to boost markets. Without de-escalation, rate cuts won’t save risky assets, and we’re looking at muted growth for crypto and stocks.
But if a deal happens, markets could rip—Bitcoin might hit $130K short-term and even $170K as the bull run’s ceiling. For now, uncertainty rules, so let’s see what the charts say.
👀 Let’s start with Bitcoin on the daily.
The first major support is $100K-$101K. If we lose that, we’re looking at a 3-4 month time-based correction . I know some of you see Bitcoin’s dip and think it’s a bargain, but hold up—if tensions escalate, breaking $100K-$101K is almost guaranteed. We could slide to $95K (0.382 Fibonacci retracement) or even $86K (0.618 retracement). No buying until Tuesday’s clarity—too risky. Shorting? Also a bad idea. After this sharp drop, where do you put your stop-loss? An 8% stop is the minimum, which trashes your risk-reward ratio. Best move? Sit tight, no positions, and wait for the dust to settle.
📈 Gold’s the star in this risk-off market.
On the 4-hour, as we said in last week’s watchlist, it broke the descending channel’s ceiling at 3333.86 and pulled back. Using our trick of cloning the prior channel and placing it above, it’s reacting perfectly at the new channel’s midline. A break above 3434.35 could push us to the channel ceiling at 3550.13 . Personally, I’d wait for more ranging here before going long—stops are too wide right now for a clean entry. If you caught our 3340 long trigger from the watchlist, you’re sitting pretty— just hold . Gold’s got more upside potential, but if you’re not in, don’t FOMO. Wait for a better setup.
🎯 Our EUR/USD long trigger from last week’s watchlist at 1.14555 was a winner
if you took it, you hit your risk-reward target and likely locked in profits. Nice work! The new long trigger is a break above 1.16142 resistance. No short triggers here, just like gold. With both major and secondary trends screaming uptrend, shorting against the flow is nonsense. I’d wait for key levels to break and confirm a bearish shift before even thinking about shorts. Trade with the trend, always.
📝our plan: Gold longs above 3434.35 target 3550.13; hold 3340 entries or wait for a range. EUR/USD longs above 1.16142, no shorts. Risk max 1% per trade, set alerts, and stay patient—geopolitical chaos means no FOMO moves.
I hope for a day with no wars, where we can focus on what matters—building value and humanity.🤍
That’s today’s breakdown, traders!
If this helped, smash that Boost button and Follow for more no-hype analysis. Drop a comment—what’s your next move? Want a coin or market analyzed? This is Skeptic, stay safe, protect your capital, and see you next time! <3