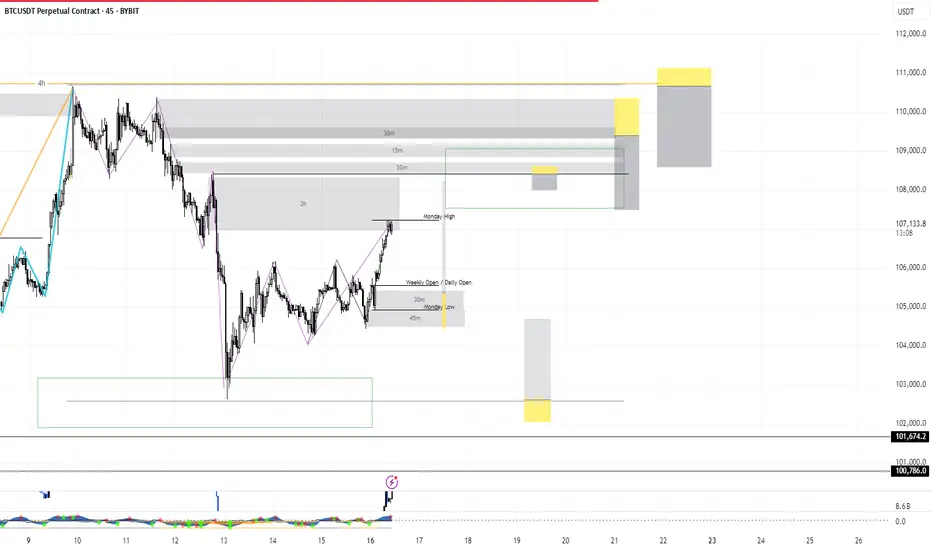
Monday trades of the day🔥 These are the scalps I’ve got my eye on today. 🔥
Mostly looking at continuation longs — unless structure tells a different story.
💡 Key Plan:
For each long setup, I’ll wait for an internal market structure (MS) flip before pulling the trigger. No confirmation, no entry. Precision is the priority.
📅 Class Schedule:
Monddaday | After 6 PM
BTCUSDT.P trade ideas
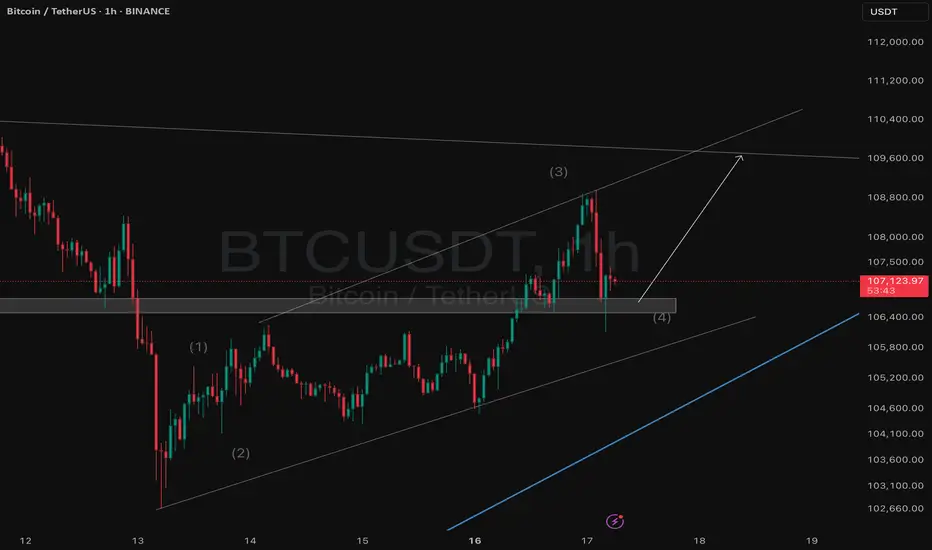
BTC bullish rally before the fall?I am expecting a bullish Rally to the previous high since it's a third wave of current impulse I'm expecting BUY from here to the target mentioned. Will be exciting if any reversal signs occur. (BTC should touch 140,000+ in 2 months.)
entering buy from 107400
*A fall still pending* BITSTAMP:BTCUSD
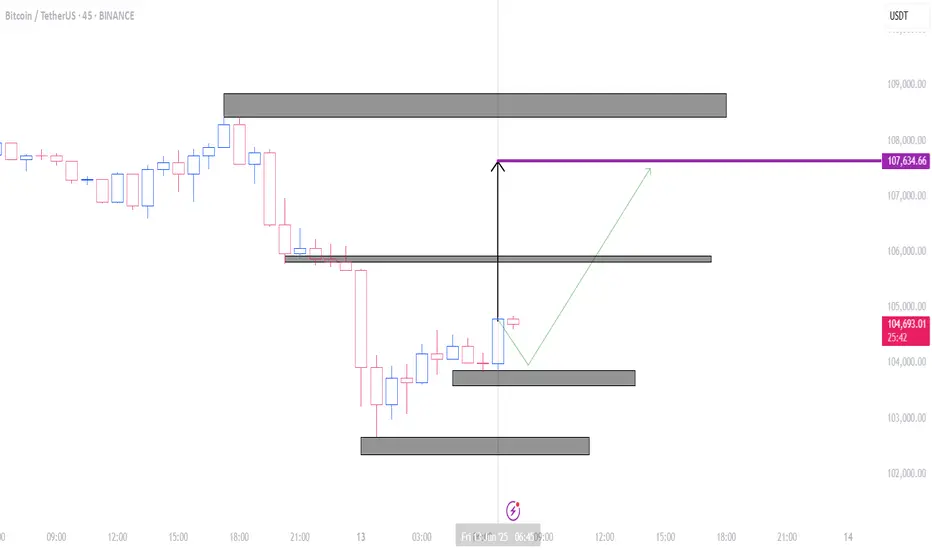
btc movement in 45minAfter the formation of strong bullish candles, in my opinion, an upward movement can be expected. The targets are shown on the chart.
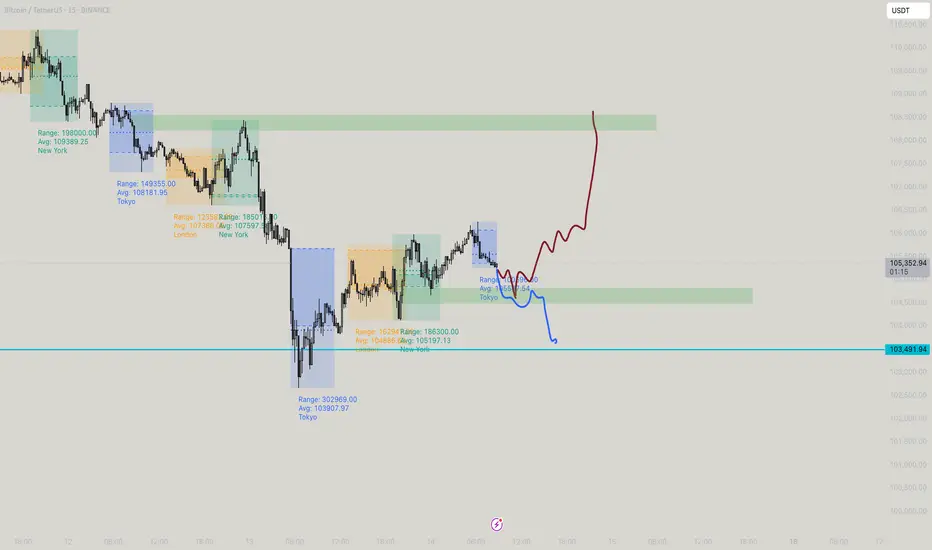
BTC - Where it is heading to? Owing to the recent war scenario's the market has taken a slump, seeing pattern its a bearish stance where a pull back down is emminent (means to fall down as drawn in blue) but as its retracing all the move after its fall, expecting a sweep moves to the top as mentioned. till 108k
DeGRAM | BTCUSD correction from the 110k level📊 Technical Analysis
● Price has reclaimed the rising-channel median at ≈106.8 k and immediately made a higher-high on expanding volume; hourly RSI also pierced its two-week bear trend, flagging fresh upside energy.
● An ascending triangle is forming between 107 k support and a 109.5 k ceiling; its measured move coincides with the red supply/upper rail at 111.6-112 k.
💡 Fundamental Analysis
● Softer US PPI (-0.1 % m/m) dragged real 2-yr yields to one-month lows, easing dollar pressure, while spot-ETF desks soaked up another ≈4 600 BTC this week, signalling renewed institutional demand.
✨ Summary
Stay long above 107 k; triangle break over 109.5 k unlocks 111.6 k then 115 k. Long view invalidated on a 4 h close beneath 103 k.
-------------------
Share your opinion in the comments and support the idea with a like. Thanks for your support!

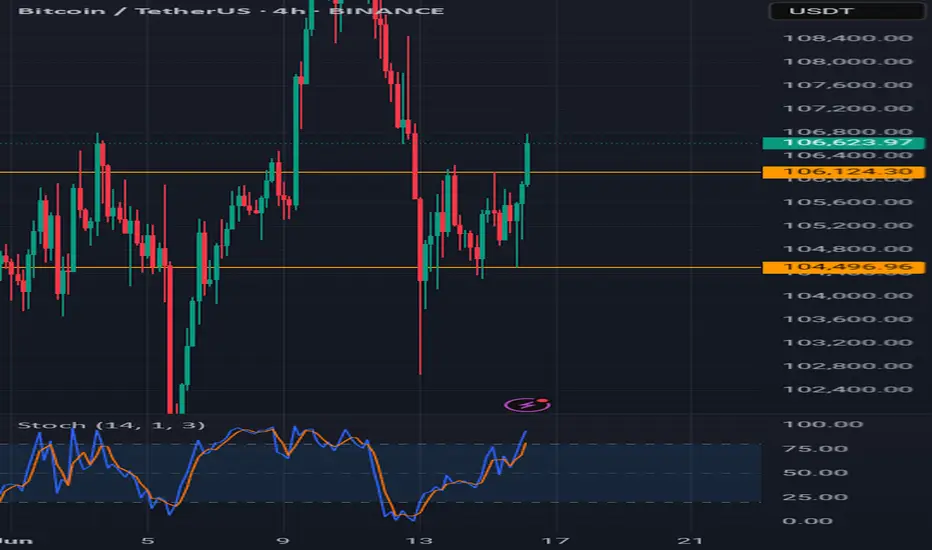
Bitcoin bullish It broke resistance 106,124.30 same will happen with Nas and Us30 as they follow Bitcoin movements
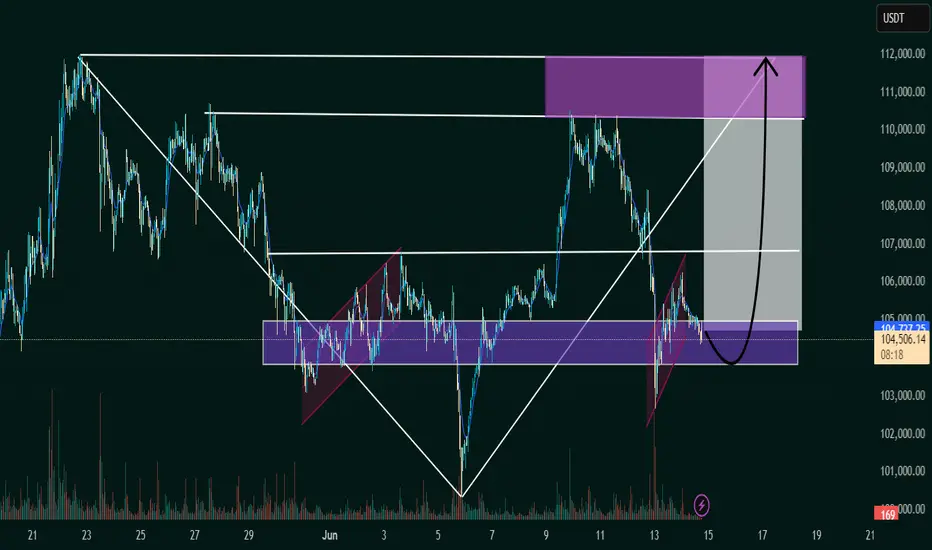
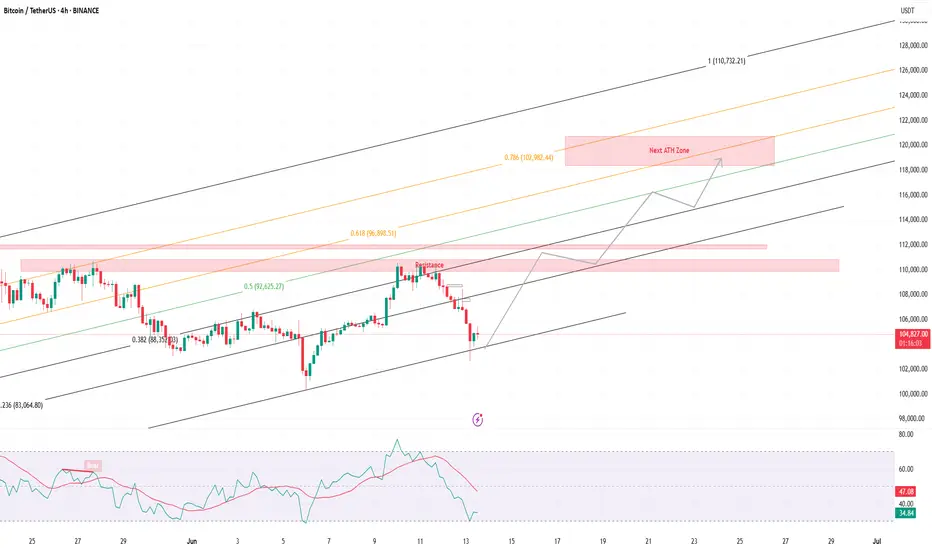
BTC/USDT Bullish Reversal Zone AnalysisSupport Zone:
The horizontal purple box (~104,000 USDT area) has acted as a strong support/resistance flip zone multiple times.
Falling Wedge Breakout:
The price action broke out of a falling wedge pattern earlier, confirming bullish momentum.
Flag Formation (Current):
A smaller bullish flag/pennant appears to be forming, and a breakout above could trigger a strong upward move.
Projected Move:
The black arrow indicates a potential bounce from this support zone, with the price targeting the 111,000–112,000 USDT zone (highlighted in the top purple box).
Volume Spike:
Notable volume spike near the bottom supports the idea of accumulation and possible reversal.
📈 Conclusion:
If the support zone holds and price breaks above the minor flag, a bullish continuation is likely toward the 111,000–112,000 resistance area. Traders should watch for confirmation of a breakout and volume increase for validation.
BITCOIN 2.5% Potential DropIt seems like BINANCE:BTCUSDT has lowered its trading volume and is potentially looking to make a correction in the upcoming days.

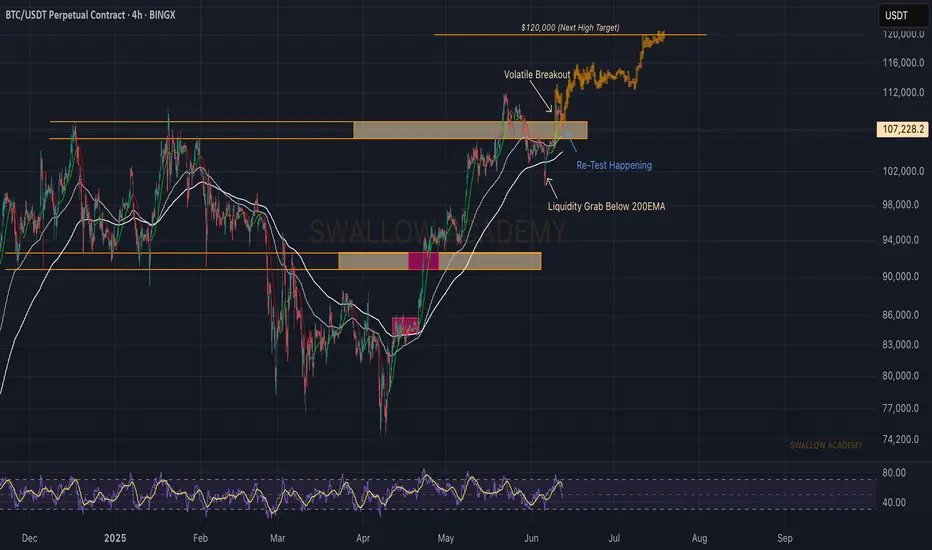
Bitcoin (BTC): Sellers Taking Over | Re-Test of Important ZoneWe are dropping hard, where after a clean breakout price is heading now back to the retest area, which will determine the next major movement from here on.
What we are seeking is a successful re-test (which then would trigger our buyside scenario), but if we see that sellers will keep the pressure and take over the control near current region, then we might be looking for slight dip towards the 200EMA line ($104,500)
Swallow Academy

Its shopping time broToday is Blessed-Friday-sell on BTC. Buy it or miss it.
Now I do not want to listen,
"Oh, Abdul, we missed it. Next time, I will follow you for sure."
:)
TradeCityPro | Bitcoin Daily Analysis #110👋 Welcome to TradeCity Pro!
Let’s dive into the Bitcoin analysis and major crypto indexes. In this review, as usual, I’ll cover the key futures triggers for the New York session.
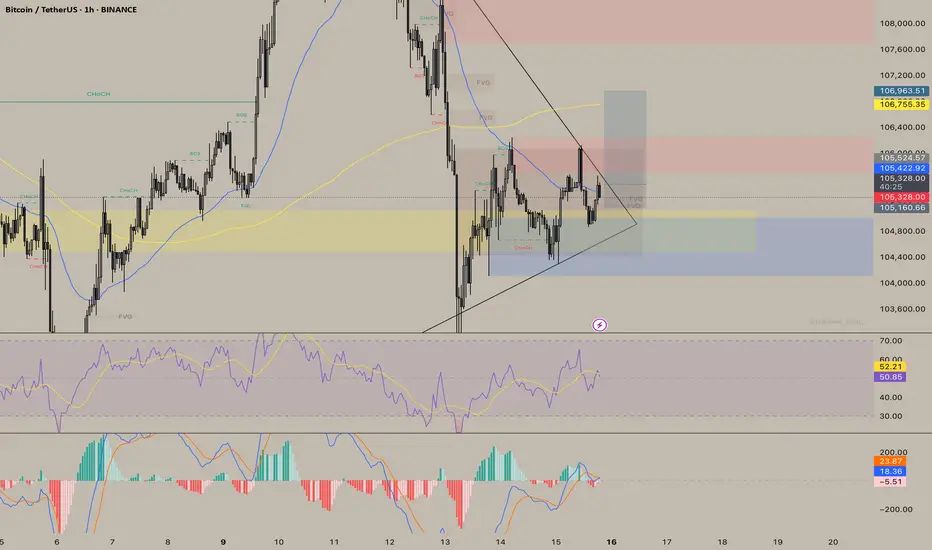
⏳ 1-Hour Timeframe
As you can see in the 1-hour timeframe, Bitcoin formed a higher low yesterday and has now reached the 105087 resistance. It seems likely that this level will be broken soon.
✨ Currently, a candle has closed above 105087, but price hasn’t yet confirmed a breakout, and the move hasn’t taken off.
📈 For a long position, we can enter once the price confirms a breakout above this level. If 105087 breaks, price could target 106586. The main long position will be opened upon breaking 106586.
🛒 Strong buying volume is a very good trigger for this setup. RSI entering the Overbought zone would also provide a powerful momentum confirmation, and price could rise accordingly.
💥 If the current upward move fails and price falls below the recent low, we can open a short position upon breaking 103899, targeting 101750.
⚡️ The 53.49 level on RSI is critical — its break would serve as a strong confirmation for the short position.
👑 BTC.D Analysis
Looking at Bitcoin Dominance, yesterday it once again moved toward 64.67, but failed to break it and is now heading downward after being rejected from that resistance.
🔑 The trigger for bullish continuation remains 64.67, while 64.49 serves as the trigger for a bearish move.
📅 Total2 Analysis
This index formed a higher low at 1.13 yesterday and is now testing the 1.15 resistance. If this level breaks, the price could head toward 1.17 and 1.18.
📊 A break above 1.15 would be a valid long trigger. However, if price is rejected and moves downward, breaking 1.13 could send it back toward 1.1.
📅 USDT.D Analysis
USDT Dominance closed below the 4.79 level yesterday and is now moving toward 4.70. If this continues, the crypto market could see bullish momentum.
🧩 However, if dominance moves back above 4.9, the next bullish leg in USDT.D could begin.
❌ Disclaimer ❌
Trading futures is highly risky and dangerous. If you're not an expert, these triggers may not be suitable for you. You should first learn risk and capital management. You can also use the educational content from this channel.
Finally, these triggers reflect my personal opinions on price action, and the market may move completely against this analysis. So, do your own research before opening any position.

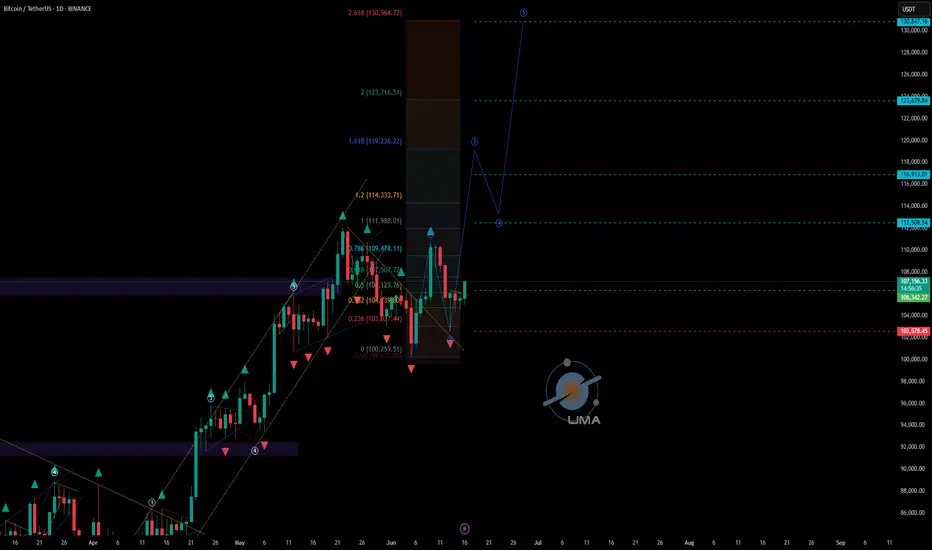
BTCUSDT - UniverseMetta - Signal#BTCUSDT - UniverseMetta - Signal
D1 - Retest of the trend line + formation of a potential 3rd wave in continuation of the uptrend. Stop behind the minimum of the 2nd wave.
Entry: 106342.27
TP: 112508.54 - 116913.01 - 123639.84 - 130847.16
Stop: 102578.45
BTC/USDT – Rising Wedge Breakdown Looms Near $110K
Idea Summary:
Bitcoin is compressing in a rising wedge on 1D/4H timeframes, approaching resistance around $ 110K–$ 112K. We’re seeing bearish divergence on RSI and MACD, declining volume, and sentiment cooling—signaling a potential breakdown.
Key Confluences:
• Rising wedge pattern (bearish reversal during uptrend) with converging trendlines and falling volume
• RSI divergence: price rising, RSI flattening/declining
• Volume behavior: weaker rallies, distribution-style setup near highs
• Sentiment neutralizing: Fear & Greed Index slipped from ~74 to ~55–60
• Macro backdrop: U.S. inflation cooling, Fed pause in rate hikes → but upcoming FOMC brings volatility risk
Conclusion:
BTC is near a wedge apex with short-term bearish structure forming. A breakdown could test $ 90K–$ 75K, whereas a break above $ 112K invalidates the setup. 📉
Trigger zones:
• Breakdown < $ 105K → triggers short
• Breakout > $ 112K → stop out & pause
💬 Thoughts? Breakdown or breakout next?
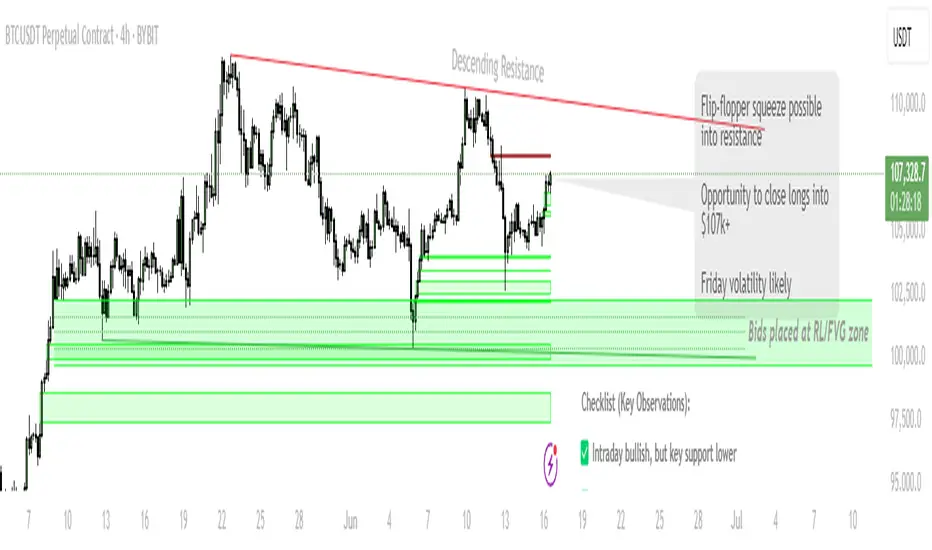
BTC Setup: Watching for a Trap — Bids Below, Flip Above!Scenario 1 (Fakeout & Reversal):
Watch for push to $107,000–$108,000 (potential bull trap)
Close longs on move into resistance zone
Look for reversal signals (SFP, strong rejection) to re-enter lower
Scenario 2 (Sweep and Bounce):
Place bids at/just below $100,272 (1D Support) and within $98,000–$100,000 (FVG)
Target: Move back toward trendline resistance ($107k+)
Stop: Below $97,200
Invalidation:
Structure flips bearish on a clean break/close below $97,200
🔔 Triggers & Confirmations:
Enter longs only on SFP or strong bounce confirmation in FVG zone
Avoid chasing if price is between $102k–$106k (“no-trade chop”)
📝 Order Placement & Management:
🔼 Buy Limits: $100,300 / $99,000 / $98,000 (staggered bids in FVG)
🛡️ Long Stop: $97,200
🎯 Target: $107,000–$109,000 (trendline resistance)
📝 Take profits on spike to $107k+
🚨 Risk Warning:
Friday volatility, news risk
Avoid new longs above $107k — watch for failed breakout/fakeout
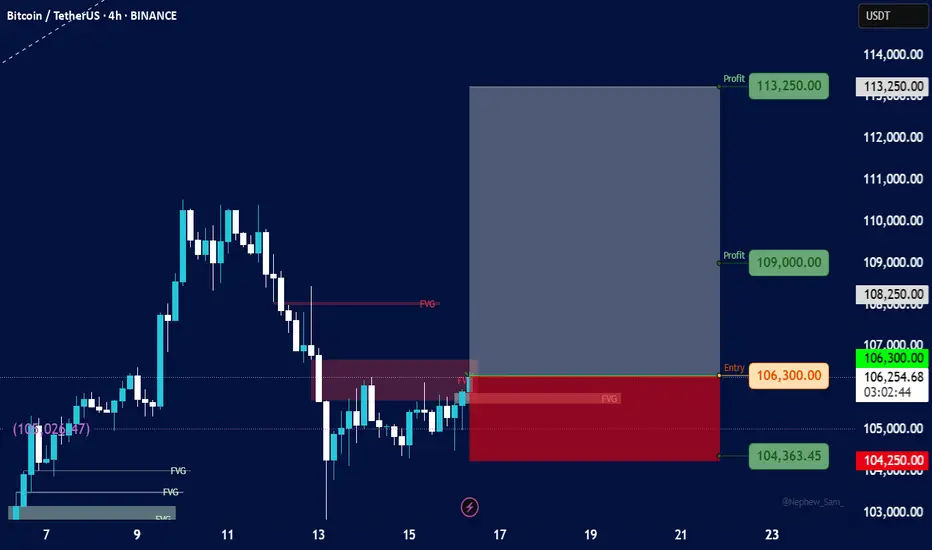
BitcoinEntry Point:
Entry Level: 106,300 USDT
Price is currently slightly below entry (106,254.67), so the trade setup is still valid and could trigger soon.
Stop-Loss (SL):
Stop Level: 104,250 USDT
Defined just below the lower FVG zone, indicating where invalidation would occur.
Take-Profit Targets (TP):
TP1: 109,000 USDT (near minor resistance)
TP2: 113,250 USDT (major target)
The Risk-to-Reward Ratio (RRR) looks favorable — possibly over 3:1, which is strong.
Shift stop to entry after reaching TP1
BTC is going to brake this lines and I it will go even higher BTC is going to brake this lines and I it will go even higher Then previous higher high . Watch closely for opening market on Monday . Anyways it will be big move long or short . Once it brake this two line .
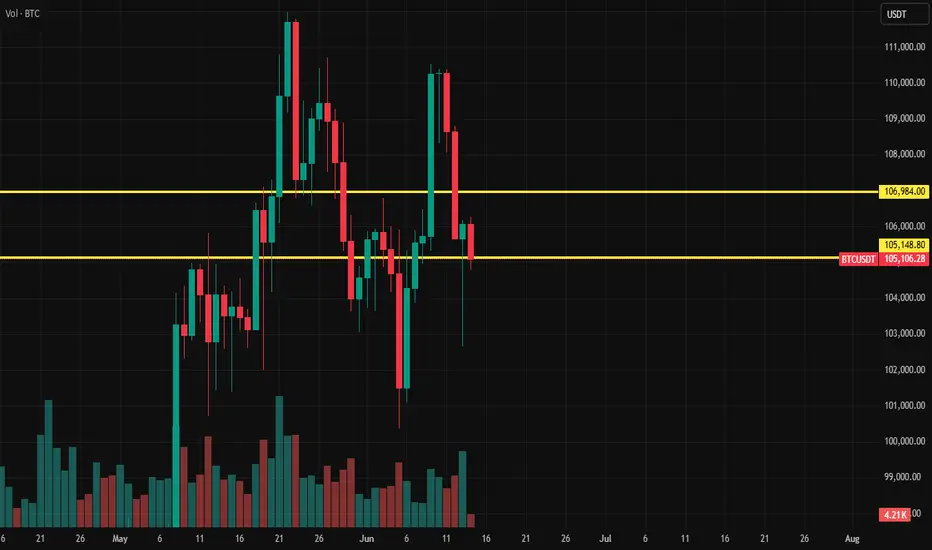
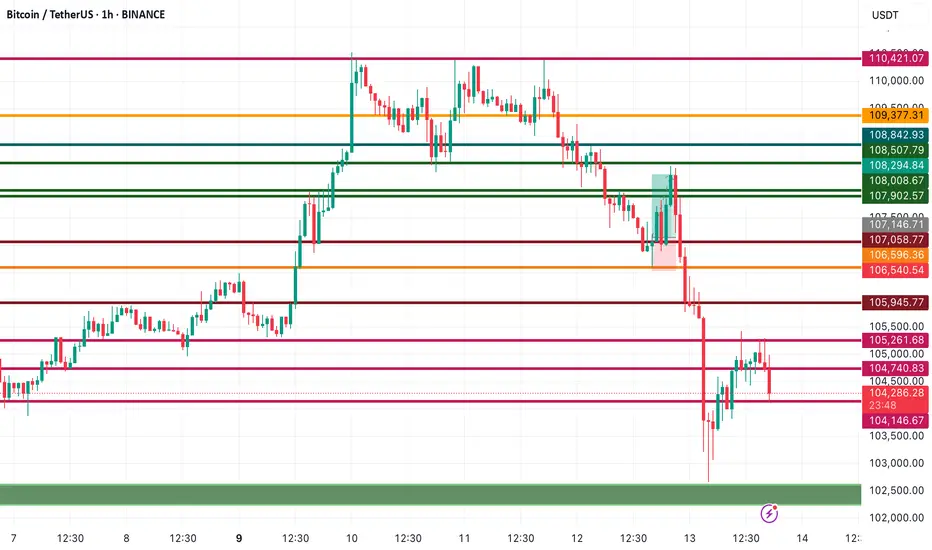
Bitcoin Analysis | Key Support Retest in Progress📉 Bitcoin Analysis | Key Support Retest in Progress
As shown in the chart, BTC has dropped precisely to the main support zone previously highlighted in our earlier analyses. So far, we haven’t seen a strong bullish reaction, which increases the likelihood of a retest of the major green support area.
🔻 If price breaks below the $104,120 level, the next key support to watch lies between $103,570 – $103,300.
🔼 However, if BTC starts to bounce from this zone, the key resistance levels and upside targets will be:
$104,740
$105,900
$106,800
and potentially $107,900
📌 All these zones have acted as key turning points in the past, so mark them on your chart and trade accordingly.
👉 Follow for more sharp entries, accurate technical zones, and daily trading insights!
A possible 100k scenario?Good day!
Its been a while since a bloodbath. And there is another possible cycle down to 100k. Will this continue?
#NFA
#TYOR

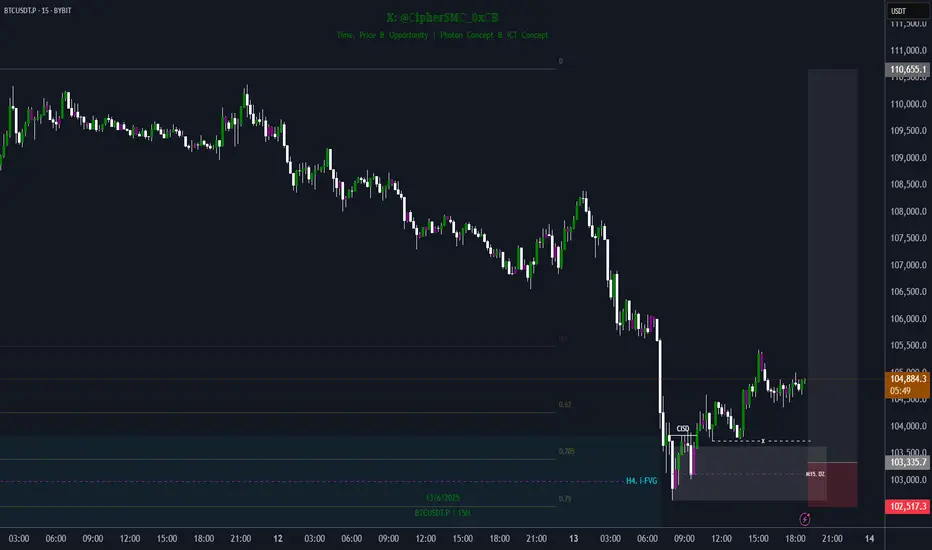
BTC Long Trade Setup IdeaWhy go long here?
1. Fill H4 i-FVG
2. OTE Zone
3. Bullish CISD
Trade Setup Idea:
- Entry Range: 103734.2 - 103020.2
- Stop Loss (SL): 102517.3
- Target Level: 100350.0
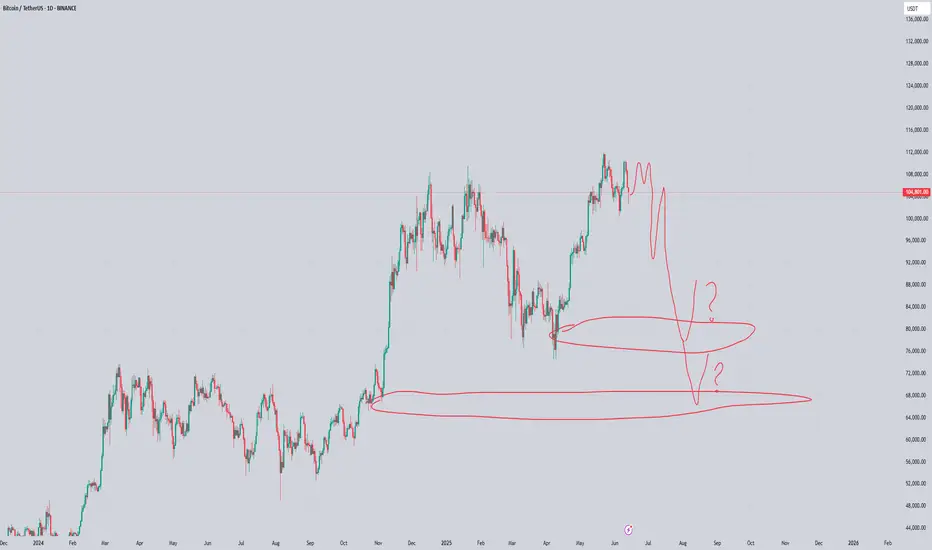
BTC will be 74k soon/i sell all my altcoins I found fractals that confirm my idea, let's call this pattern “dragon wings.” I think the price will fall to $74k at best, and from there I will consider buying.
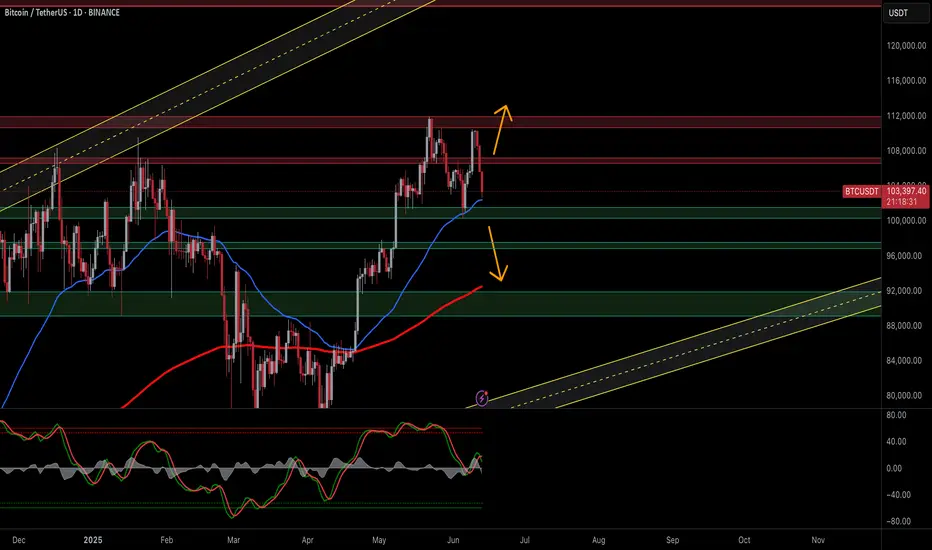
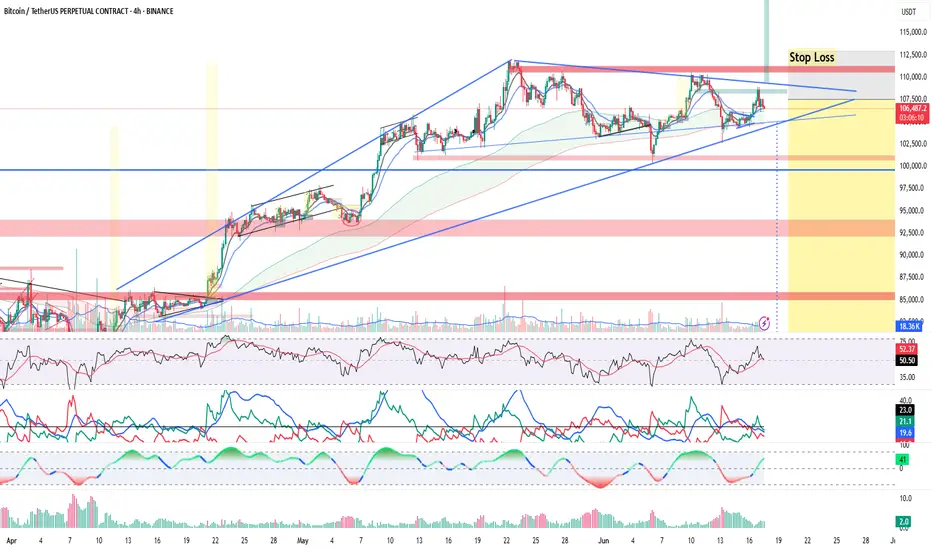
BTC Reacts to Iran–Israel Escalation: Risk-Off Sentiment GrowsBitcoin (BTC/USDT) — Caught Between Fear & Fundamentals
Technical Outlook — 13 June, 2025
Current Market Condition:
Bitcoin has dropped to $103,818 after facing rejection from the $106.8K–$108K resistance zone, coinciding with heightened geopolitical stress following renewed military escalation between Iran and Israel. Traditional markets are showing signs of risk aversion, and while Bitcoin is often seen as a hedge, the current flight to USD liquidity and defensive assets is putting pressure on high-beta instruments like crypto.
The psychological $100K support zone, which aligns with the EMA 50 and a key Fib level, is the immediate area to watch. A failure here could expose Bitcoin to deeper retracement toward $96,800 and potentially $92K, especially if global tensions worsen or investors rotate further into cash and gold.
Key Technical Highlights:
Rejection at supply zone near $106,888–$108,000.
Support at $100K holds structural and psychological importance.
Stochastic shows bearish momentum crossover, increasing downside probability.
EMA 200 at $92K could act as ultimate cushion in a full-blown correction.
Volatility likely to remain elevated amid Middle East conflict and global uncertainty.
Trade Plan:
🔼 Bullish Relief Bounce (Long Bias):
Trigger: Reclaim and hold above $106,888 with rising volume
Target: $108K → $112K → $116K
Stop Loss: Below $103,500
🔻 Geopolitical Risk Sell-Off (Short Bias):
Trigger: Break and close below $100,000
Target: $96,816 → $92,000 → $88,000
Stop Loss: Above $102,500
📉 Dip Buy Strategy:
Trigger: Price stabilizes at $96.8K with divergence and calming geopolitical headlines
Target: $103K → $106K
Stop Loss: Below $95K
🛡️ Risk Management Note:
With geopolitical risk driving short-term sentiment, expect volatility spikes, whipsaws, and fake breakouts. Remain nimble and manage exposure carefully — especially during weekend sessions when crypto trades unhedged and news developments can occur without warning.
📢 If you found this analysis valuable, kindly consider boosting and following for more updates.
⚠️ Disclaimer: This content is intended for educational purposes only and does not constitute financial advice.