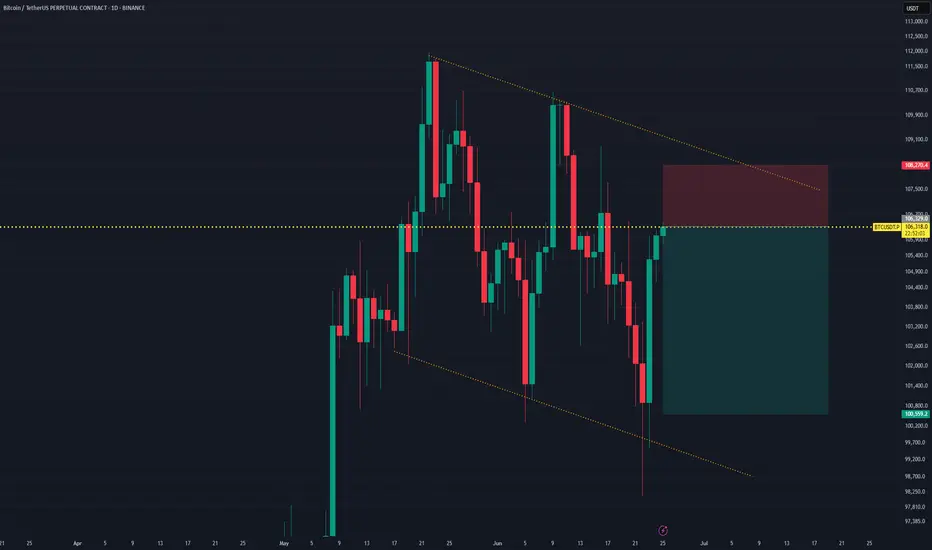
BTCUSDT Short Setup Below Major Trendline ResistanceBTCUSDT is currently testing the upper boundary of a descending trendline, which has acted as strong resistance over multiple touches. Price is now at $106,300, a key area aligned with previous rejections and now forming a potential lower high within the structure.
This setup presents a short opportunity, with:
- A clear rejection level at the descending trendline.
- A defined Stop Loss at $108,270, just above recent swing highs and the upper trendline.
- A Take Profit target at $100,559, a level near the bottom channel and prior support.
Trade Parameters:
- Entry: ~$106,300
- Stop Loss: $108,270
- Take Profit: $100,559
- Risk:Reward Ratio: ~1:2.91
A breakdown from this level could trigger continuation to the downside, while a close above the trendline with momentum would invalidate the setup.
Bias: Bearish Rejection from Trendline
Confirmation: Strong wick or bearish engulfing candle near the resistance zone
BTCUSDT.PS trade ideas
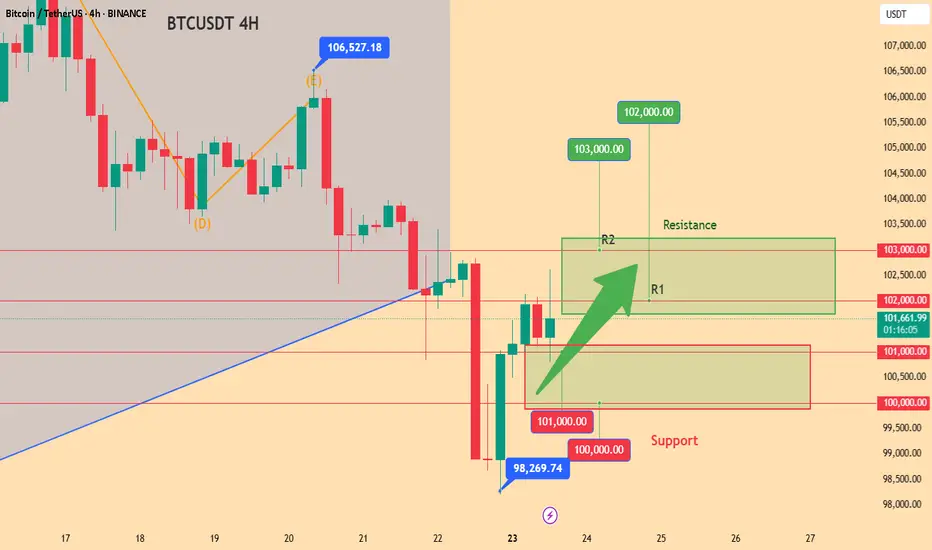
Today's BTC trading strategy, I hope it will be helpful to youBitcoin is fluctuating around $101,000, like driving to a crossroads. Looking down, the average price over the past month is supported at around $100,000. Looking up, $105,000 seems like a hurdle. In the United States, although the possibility of a rate cut in July is low (only 10%), some Fed officials have said they support rate cuts if inflation is under control, which has made the market expect easing in the second half of the year. More importantly, the United States and Hong Kong, China, are issuing "legal IDs" for stablecoins. Large companies like JD.com are applying for licenses, which may make Bitcoin transactions more convenient in the future, equivalent to adding fuel to the market. Large companies are also voting with their actions. For example, MicroStrategy continues to buy Bitcoin, indicating that long-term optimists have not wavered.
Today's BTC trading strategy, I hope it will be helpful to you
BTCUSDT BUY@100000~101000
SL:98000
TP:102000~103000
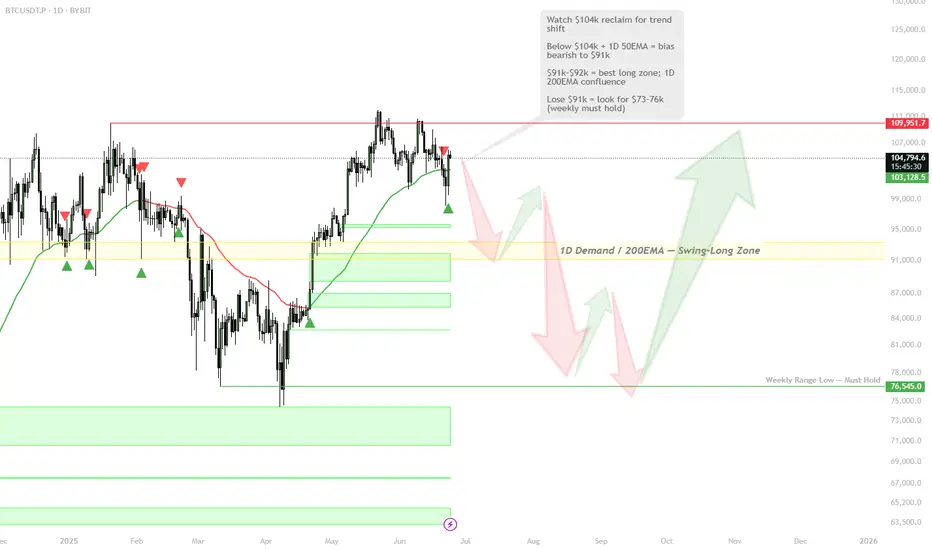
BTC at the Crossroads — $91k Demand or Deeper Flush to $76k?🎯 BINANCE:BTCUSDT Trading Plan:
Scenario 1 — Bullish Reclaim:
If price reclaims 1D 50EMA and $104k, bias flips bullish; look for continuation toward ATHs
Scenario 2 — Base Case (Favored):
Remain patient for a move to $91k–$92k; swing-long setup on signs of strength or iH&S formation
If $91k–$92k holds, expect a summer rally and new ATHs later in 2025
Scenario 3 — Breakdown:
If $91k fails, prepare for deeper move to $73k–$76k; this is the “max long” zone if tested
Must hold here; below $73k–$76k, next support is $55k
🔔 Triggers & Confirmations:
Long only above $104k + 1D 50EMA, or after bullish structure at $91k–$92k
Major long only on strong support at $76k, with clear confirmation
📝 Order Placement & Management:
Buy: On reclaim of $104k (trend confirmation) or at $91k–$92k with iH&S/reversal pattern
Backup Buy: If $76k is tagged with confirmation
Stops: Under $91k or $73k (based on entry)
Targets: New ATHs for late 2025
🚨 Risk Warning:
Losing $91k opens path to $76k; losing $76k is a major structure break
Don’t knife-catch — wait for confirmation at each level
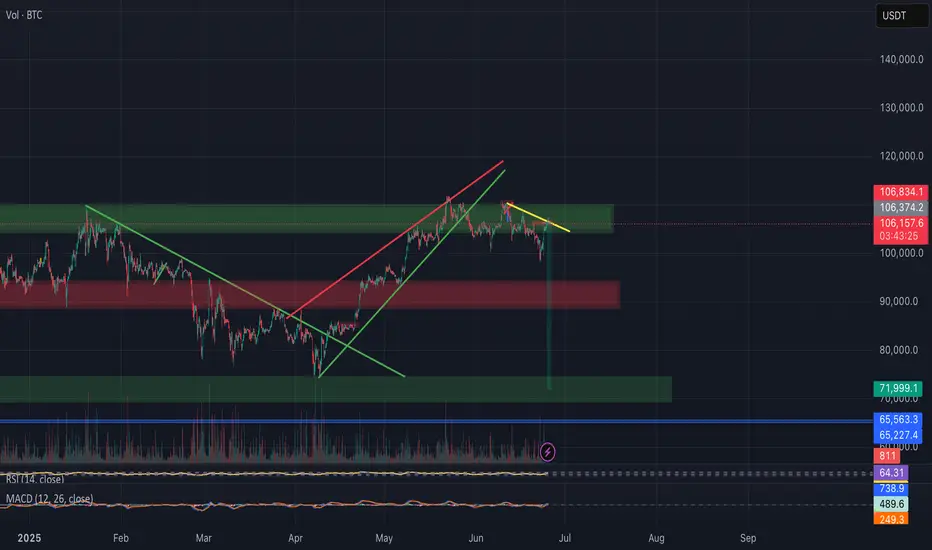
Once again a perfect time to enter a short
As we are closing in to key resistance area we can see that we are getting a lot of smaller bodied 4H candlesticks. This is indicating a weak buy side and that we are looking to top out!
We also got overbought on the hourly RSI and the MACD has flipped bearish
Combining a crocodile tooth shaped formation taking form on the 15min, a rejection from the downward sloping trend line (third rejection indicates strong trend line) and that we are looking to reverse at key resistance. I entered a 100x short at 106375.
As I am writing we also got in another confirmation on the hourly timeframe. As we can see we got a nice bearish engulfing candlestick.
I think the chart speak for itself. We are about to go down big time!
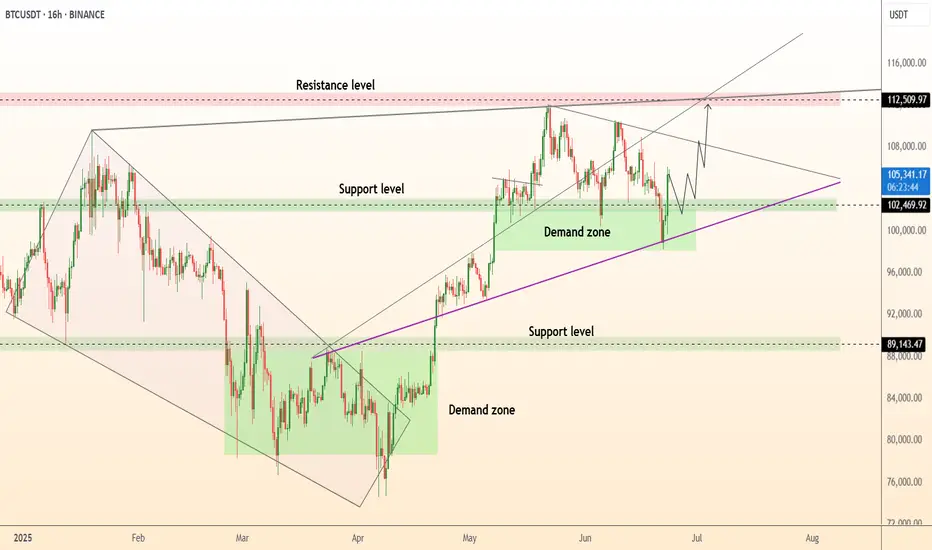
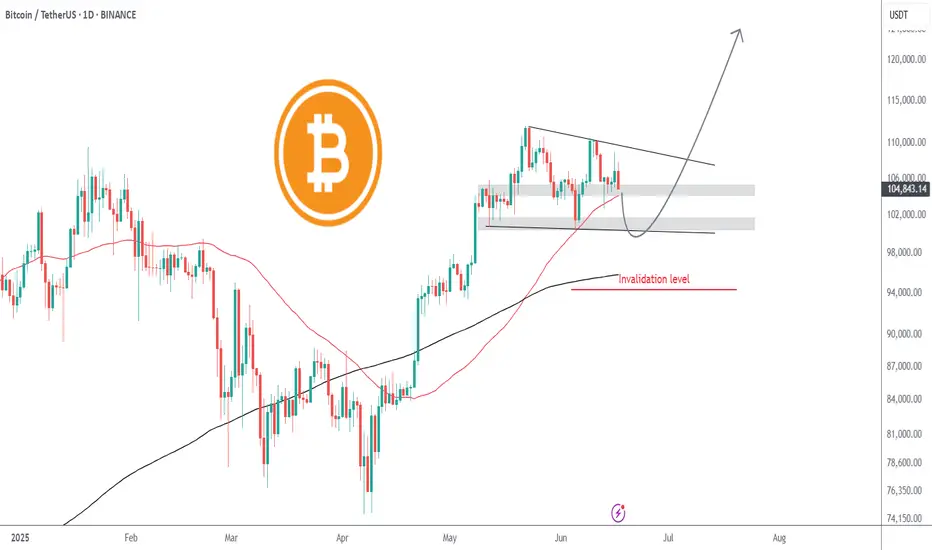
DeGRAM | BTCUSD once again trading above $105k📊 Technical Analysis
● Fresh bounce off the confluence of the 8-month up-sloping purple trend-line and 102-103 k green demand box prints a higher-low inside the rising wedge, keeping bulls in control despite June’s pull-back.
● Price is reclaiming the minor down-trend line from the 12 Jun high; a daily close above 106 k confirms a bear-trap and unlocks the 111.8-112.5 k supply at the wedge cap.
💡 Fundamental Analysis
● Spot-ETF desks absorbed >5 400 BTC in the last three sessions while exchange reserves fell to a four-year low, signalling supply drain.
● Cooling US PCE expectations trimmed real yields, and Mt Gox repayment delays ease overhang fears—both supportive for risk assets.
✨ Summary
Long 102–104 k; hold above 106 k targets 111.8 k → 115 k. Bull thesis void on a 16 h close below 99 k.
-------------------
Share your opinion in the comments and support the idea with a like. Thanks for your support!
The Nature of Zones — Reversals, Continuations, and the FlowWe’ve all heard trading terms like Major Trend and Major Counter-Trend levels. These are zones where price either breaks through and continues (Trend Levels) or sharply reverses (Counter-Trend Levels). In the crypto world, these levels are often separated by enormous gaps, due to the nature of the space — as I’ve mentioned in a previous idea: Crypto Charts Whisper—Are You Listening?
Let’s get one thing clear from the start. These levels are not just thin lines that traders casually draw across a chart. They are zones. So, as a skilled trader, anytime someone mentions support or resistance, keep in mind: interact with these as zones, not levels.
Why? The answer lies in the nature of the candlestick itself. Most support and resistance areas — 99% of the time — are defined by candlesticks such as inverted hammers, shooting stars, etc. For instance, in an uptrend near its peak, you’ll often spot an inverted hammer with a rejection wick that’s at least 25–50% of the candle’s body. The longer the wick, the stronger the rejection. In that sense, the high and the close of that candle form the zone. And what better tool to use for this than the rectangle?
Now, to slowly return to our main point — many of you might’ve noticed that zones often change their nature, especially resistance zones. If you’re experienced, you already know: price tends to go higher by nature. So when a counter-trend zone gets broken and price pushes above it, it shifts — it becomes a trend zone. Later, if price retests it from above, it often turns into support, and with another reversal, it can shift again — becoming a counter-trend zone once more.
But my point goes deeper than what you’ll hear in lessons or YouTube videos. Like I said in another post — A Follow-up to “Adjustments for Better Readings & VSA vs BTC” — if it’s already out there, it’s probably old news.
A skilled trader keeps an open mind — merging everything into one system. And it's part of this oneness mindset that elite traders follow, which I want to share now.
So I ask you:
What if the idea of trend and counter-trend zones didn’t just apply to major levels?
What if this concept applied everywhere on the chart?
For me, this isn’t just a question anymore — it’s a fact. A fact that made me a better trader. I won’t lie — before I got good at this, I failed over and over. But I never quit. That’s not the point though. The point is to expand your vision and train yourself to react just like the elite do.
Take double or triple tops/bottoms — standard or rounded. These formations also act exactly like trend and counter-trend zones. And they stay relevant well into the future. Every level is tested at least twice, from both directions. Maybe not immediately, but eventually — across multiple time frames.
And just like that, a level becomes a major zone for future use — especially if you trade across multiple time frames. So be careful: if you’re only looking at the 1-hour chart, you might miss something important that’s playing out on the 3-minute. And that can trigger psychological discomfort... leading to FOMO — and all the mistakes that come with it.
Also remember — double and triple tops/bottoms are zones, not exact lines. Many traders lose trades by a single tick, just because they forget that rule.
Let’s go a bit deeper now.
Think about all the small highs and lows that appear between those tops and bottoms on a 3-minute chart.
How can they help you trade better? The answer goes back to my previous idea: Location, Location, Location — Consistency and Alignment.
I get it — staying observant 24/7 is hard. That’s why institutions and big players work in teams, in shifts. They’re never alone. You shouldn’t be either.
There’s a lot more that could be said about these levels and zones — how they reveal future trend behavior, a flow! even without indicators or VSA. It has to do with how specific highs and lows behave at certain points in time... but let’s leave that for now.
For the outro, remember this:
The real edge isn’t in indicators.
It’s in your ability to catch the flow of price,
And to read strength or weakness through the simple structures within the zones Big Players create — whether visible or hidden.
A chart isn’t a single truth.
It’s a battlefield of conflicting zones and mixed signals.
If this mindset resonates with you and you want to go deeper — whether it’s building confidence or spotting hidden signals early — I work with a small circle of traders, sharing TA privately every day. Feel free to reach out.
Until next time, be well and trade wisely.

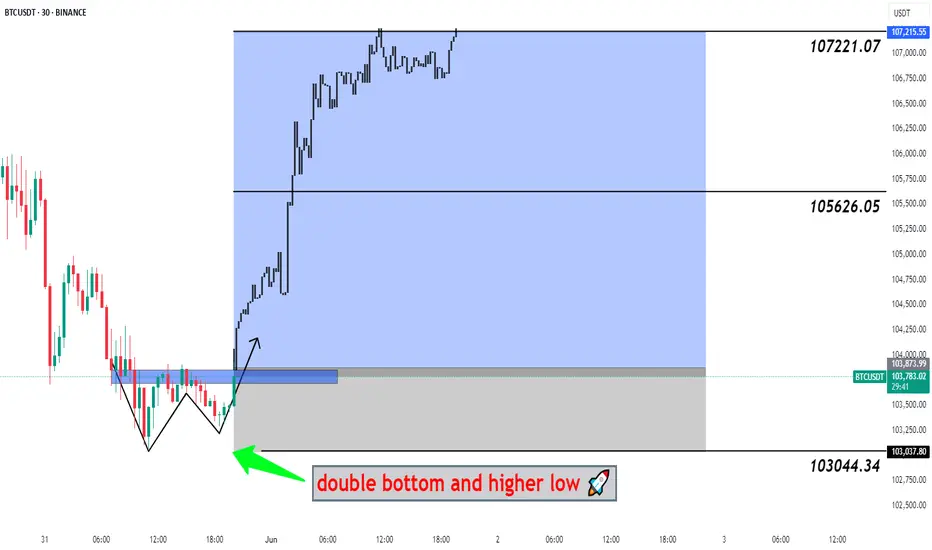
#BTCUSDT Big Pump Next Hour - Bitcoin, BTCUSD, BTCUSDT 📉 Double Bottom Pattern Forming – Potential Reversal Setup
The current price structure is showing signs of a Double Bottom – a classic bullish reversal pattern. After an extended downtrend, this pattern suggests that the market may be preparing for a trend reversal from this key demand zone.
🔹 Trade Setup
Entry, Targets, and Stop Loss (SL) are marked on the chart.
Entry: Upon breakout confirmation above the neckline.
Stop Loss: Just below the recent swing low to manage downside risk.
Targets: Calculated using the measured move method from the bottom to the neckline .
🔹 Risk & Money Management (Professional Approach)
To maintain consistent profitability and protect capital, strict risk management is essential. For this setup:
🔸 Position Sizing: Based on a fixed % of total capital (typically 1–2% of account equity per trade).
🔸 Risk-to-Reward Ratio: Minimum of 1:2, ideally higher.
🔸 Stop Loss Discipline: No arbitrary changes after entry. SL only adjusted for breakeven or trailing stops once price moves favorably.
🔸 Trade Management: Secure partial profits at key levels, trail stops as structure forms.
🔸 Capital Allocation: Avoid overexposure. Trade fits within overall portfolio strategy.
💬 Let the setup come to you. React, don’t predict.
🔁 Like, comment, or share your thoughts below!
BINANCE:BTCUSDT BITSTAMP:BTCUSD COINBASE:BTCUSD BINANCE:BTCUSDT.P INDEX:BTCUSD CRYPTOCAP:BTC.D CRYPTO:BTCUSD BYBIT:BTCUSDT.P BINANCE:BTCUSD
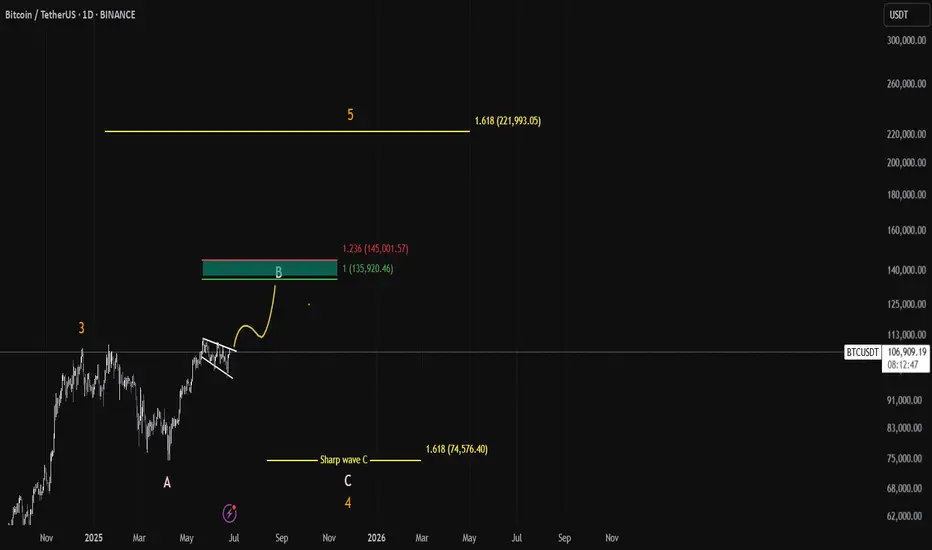
BTC trade plan🚨 BITCOIN – Eyeing $135K Before the Real Drop? 🚨
📆 Timeframe: 1D | Exchange: BINANCE
🧠 Elliott Wave Breakdown:
After completing Wave 3 near the $109K level, BTC entered a classic A-B-C correction.
We're currently breaking out of a bullish flag, hinting at the final leg Wave B rally still to come!
📈 Wave B Target Zone:
🎯 1.0 Extension: $135,920
🔴 1.236 Extension (Max Spike): $145,000
This zone is our “Red Box of Rejection”, where a strong reversal is likely as Wave C kicks in.
A sharp Wave C dump could target the 1.618 Fib extension at $74,576 — a textbook retracement level for deeper Wave 4 corrections.
That area would offer a generational buying opportunity heading into Wave 5, targeting above $220K+!
🚀 Final Wave 5 Target:
💥 1.618 Extension: $221,993+
Bitcoin to revisit $100k | Summer price target = $120kGeopolitical tension is causing fear in the markets. Today, Bitcoin fell from $107.7k to current price $105k with no sign of buyer support whatsoever, printing 11 consecutive H1 red candles intraday. Like a hot knife through butter.
At $105k, there is very little support. Sell volume absolutely overshadowed the tiny buy volume. Bulls have yet to close a green candle. I believe in the next few hours Bitcoin will be trading at $104k, followed by the first stop $102k.
$102k can serve as an entry point, depending on how price reacts. $100k is the optimal entry point for maximum profit, after mass liquidations. Retail traders are confident that the liquidity hunt is over after the initial tap, placing stops and liquidation levels at $100k.
Invalidation level will be beyond the 200SMA. The 200SMA have historically proven itself time and time again as a safe zone during rallies after golden crosses.
The Pattern That Could Launch BitcoinSpotted a long-term inverted head & shoulders pattern forming over a 7–8 month stretch on Bitcoin — much more reliable than short-term setups. If this bullish structure plays out, we could be looking at a breakout that pushes BTC firmly into price discovery.
I’ve included local Fibonacci levels on the chart, though I couldn’t fit the macro one (going from $4k → $69k → $15k — the 1.618 extension of that larger swing lands at $119,800. That could be a key resistance target if we clear the ATH and continue the uptrend. After that, there's the smaller timeframe, but more recent, fib ext 1.618 sitting at $131k.
I'd be very cautious of a failed pattern if $101k doesn't hold. As a last support, 95k and the red 20EMA might hold.
Let’s see how this plays out 🚀

Today's BTC trading strategy, I hope it will be helpful to youToday, Bitcoin's price is like a ball caught between two forces, swaying around $103,300. On one side, the Fed just said "let's wait and see" (latest report states the impact of tariffs is uncertain, so no hurry to cut rates), putting a temporary brake on leveraged crypto speculators. On the other side, Middle East tensions are on a rollercoaster—Israel and Iran alternate between clashes and talks, but Iran's move to accept Bitcoin for oil purchases has put a floor under prices. Right now, the market feels like a spring compressed too far: $103,000 acts as a strong support (like a sofa cushion), while $107,000 looms as a ceiling, likely confining short-term moves to this range.
Recent Price Dynamics
The $103,000 level has emerged as a critical support zone, functioning like an "invisible mattress" for prices. During recent volatility, prices repeatedly rebounded when testing this level, indicating many investors view it as a relative low—willing to absorb selling pressure here. For example, on June 13, when Bitcoin fell due to Middle East tensions, it quickly bounced after hitting a low of $102,614, confirming the support at $103,000.
Today's BTC trading strategy, I hope it will be helpful to you
BTCUSDT BUY@102000~103000
SL:101000
TP:105000~106000
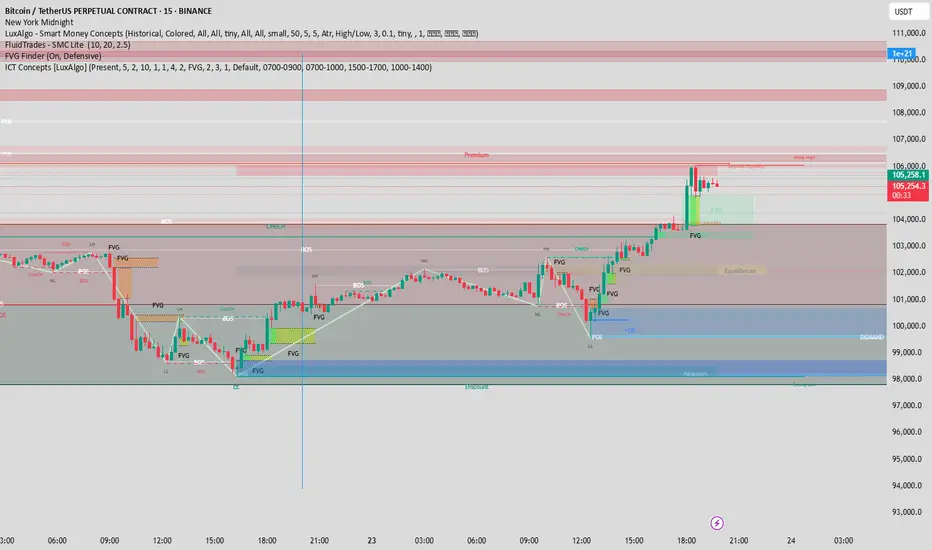
Breakdown: BTC/USDT 15m – Riding the Trend
🔹 Smart Money Confluences:
CHoCH at the bottom with a clear liquidity sweep (LL formed, then reversal)
Multiple FVGs aligned with structure—price keep respecting mitigation blocks
POI + OB near $99,800 gave the final long confirmation
BOS and strong HHs show clean bullish order flow
🟩 Premium/Discount Zones:
You entered at da discount, targeting premium—textbook ICT
Midline equilibrium held nicely before bullish continuation.
💡 Final Push:
Price is consolidating under weak high and buy-side imbalance.
Possible continuation if new FVG near $105k holds
🔔 Watch for:
Higher timeframe liquidity grab above $106k
Rejection near inefficiency = potential partial TP zone
A Disciplined Approach to BTC/USDT - Wait for the Right Set Up!Right now, I’m closely monitoring BTC/USDT — and what immediately jumps out is how aggressively this rally has pushed upward 🚀. We’ve seen price climb into a key external range high, taking out liquidity that was likely sitting just above those prior highs 💧.
This kind of move is often where institutional players step in to offload positions, as the liquidity makes it easier to find counterparts for previous accumulation phases 🏦. The way this price action is unfolding, I wouldn't be surprised to see a correction or retracement soon.
With the market this stretched, I’m not looking to get long here — especially not while BTC is trading at such a clear premium 🎯. No edge in chasing the highs.
Instead, I’ll be sitting back, waiting for a healthy pullback and a confirmed bullish structure shift before considering any entries 🔄📊. There’s no need to force trades in these conditions. Patience protects capital 🛡️.
⚠️ As always, this is not financial advice — just my current market perspective.

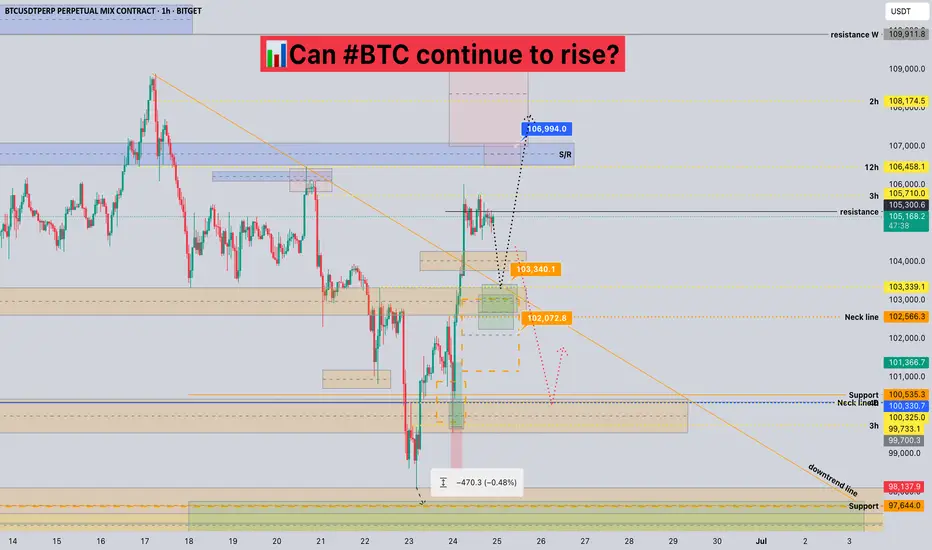
Can #BTC continue to rise?📊Can #BTC continue to rise?
🧠From a structural perspective, we started to rebound after being very close to the ideal target area of the bearish cup-handle structure, and broke through the downward trend line, which means that the correction phase is over.
➡️So next we need to pay attention to the long trading opportunities after the pullback. At present, this position belongs to the contradictory range. It can continue to rise, but it will be very uncomfortable if we chase the rise. So wait patiently for trading opportunities after the pullback. We can pay attention to the neckline support area (102000-103000).
➡️If there is no pullback, but it continues to rise, then the resistance near 106500 is also worth our attention. This is the support-resistance conversion area that has been tested many times.
🤜If you like my analysis, please like 💖 and share 💬
BITGET:BTCUSDT.P
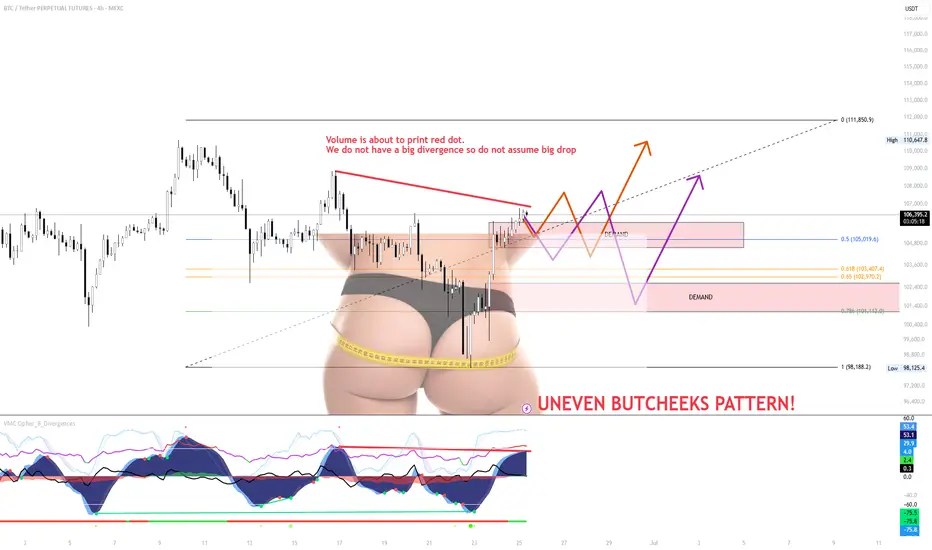
SMALL RETEST on BTC and continuation of BTC TrendThe small range forming just under local resistance is weak and showing signs of exhaustion. Despite a possible red dot printing soon, volume is not confirming a strong bearish divergence, so don’t assume a major drop is guaranteed just yet.
The “Uneven Butcheeks” pattern visually highlights imbalance
A fakeout back into the range, or
A flush to grab liquidity sitting beneath key demand zones.
Key Scenarios
Scenario A (Orange Path)
A breakout through the overhead supply zone could trigger upside continuation toward $111,850.
But unless it’s backed by strong volume and broader BTC strength, I’ll be fading this move.
Right now, this doesn’t look like conviction from bulls — it looks like exhaustion.
Scenario B (Purple Path)
A rejection at current levels or a weak fakeout could break back into the demand zone.
With thin structure below and low buy-side aggression, price could sweep down toward $102.9k–$101.1k, or even lower.
If we get this move, I’ll be watching how buyers behave around the lower demand — that’s where bulls need to prove themselves.
⚠️ Strategy:
Don’t front-run this — let the price confirm or invalidate.
Watch volume. Watch BTC dominance.
Until then, this zone is chop-heavy, and patience = protection.
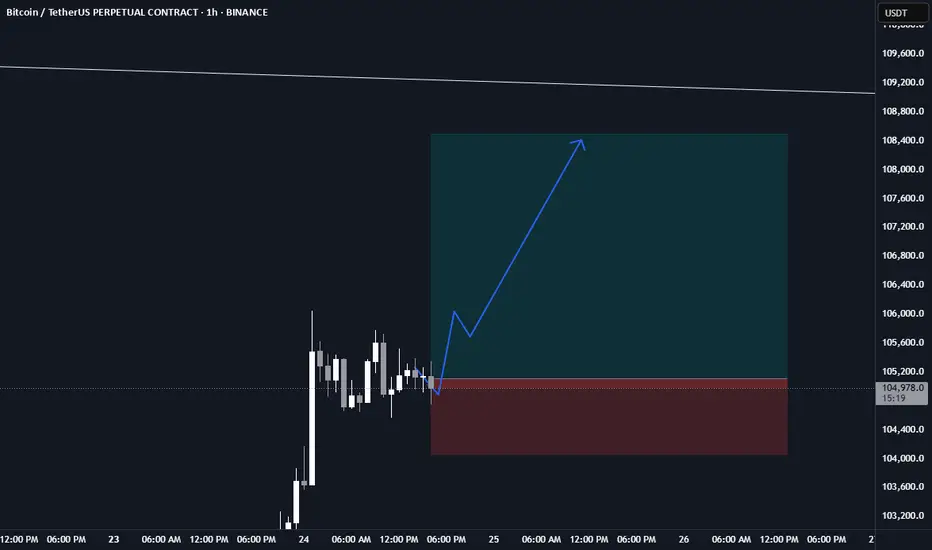
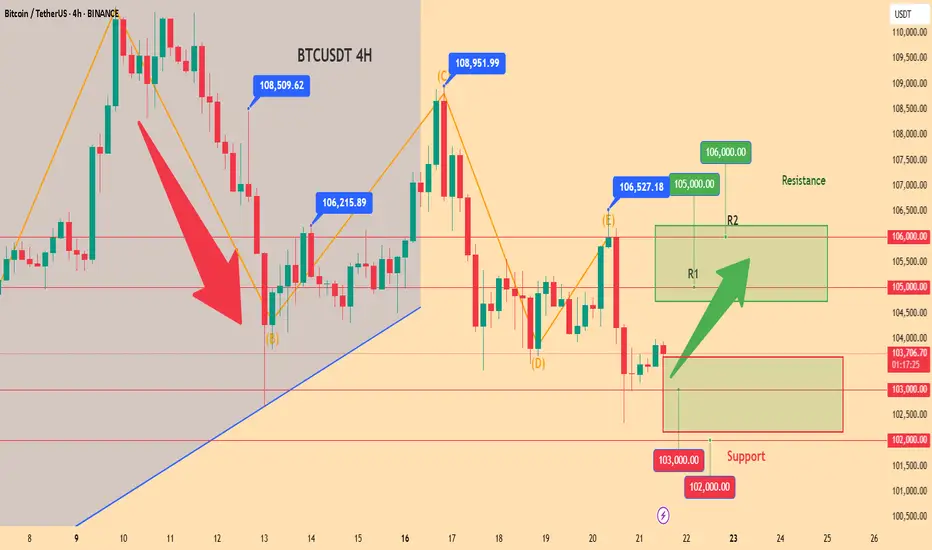
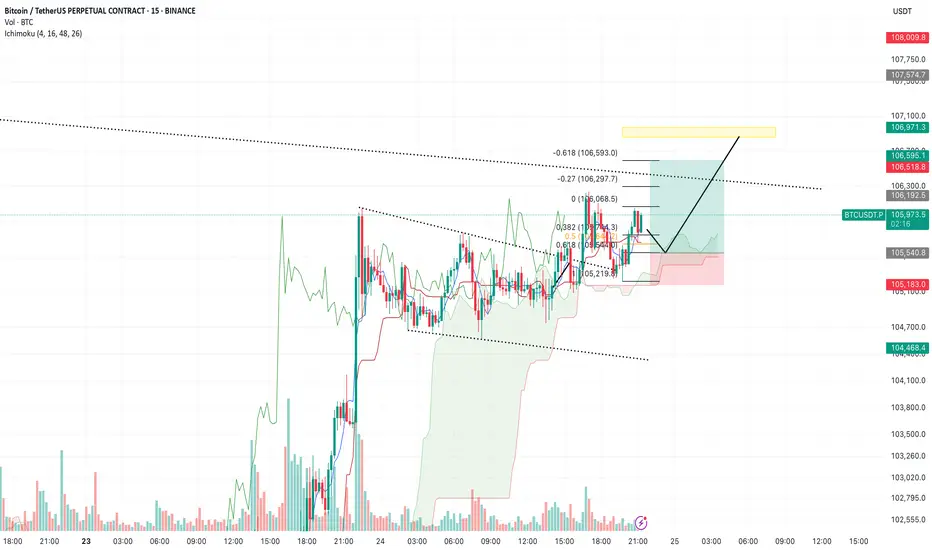
BTC/USDT – Update & New Plan (15m, Ichimoku)Previous idea recap:
Bulls proved stronger than expected — we didn’t get the move down to 104,000 as anticipated. Instead, price rallied directly to the 106,300 block, as outlined earlier, and saw only a brief pullback.
Current outlook:
Buyers remain in control here. My new base case is a move towards 106,900 (yellow liquidity block). Ideally, I’d like to see a quick dip to the 105,550 area first, which would set up a strong launch for the next leg higher into the key liquidity zone.
Watching how price reacts on minor pullbacks — still expecting buyers to step in and push us to 106,900 where significant liquidity is stacked.
Key levels:
Minor support: 105,550
Main target: 106,900 (yellow block)
Bulls remain in control above 105,550
Will update if conditions change.
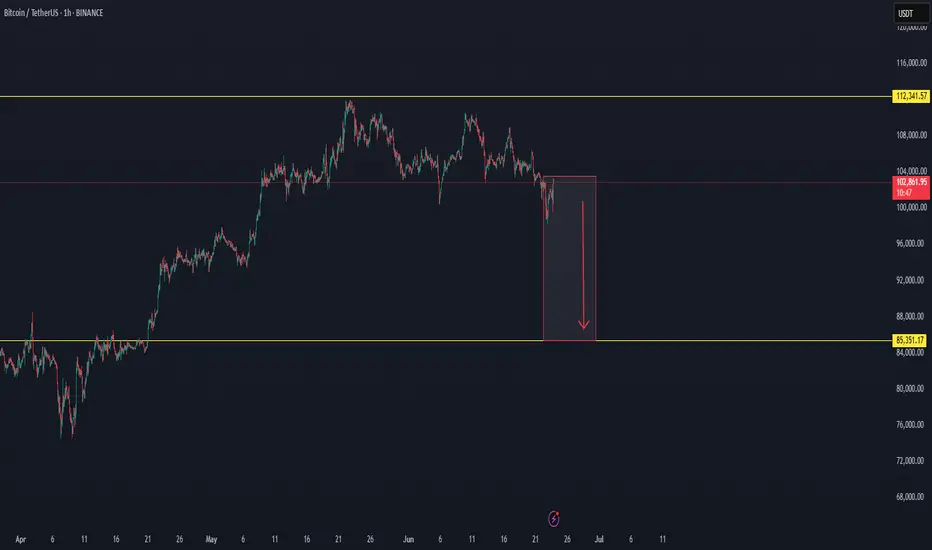
Market SIGNALS SHOW THAT BTC CAN FALL TO 85K USDMarket follow-up study shows that there is a good chance BTC can fall to 85K in the coming time period. The market cycle seems to end the green trend and to enter a new red zone.
Time will show what really can happen with BTC.
The market can make a fake trend, with a trend fall on a high time frame.
The crash can also happen on the main markets.
This is not trading advice, trade always only depending on your plan.
BTCUSD next target releasedNo comment needed. All information is in the chart analysis.
Steps to follow:
Analyze yourself.
Take the position with SL and Take Profits.
Wait, it may take a couple of days, so take a break and step away from the screen from time to time, just like I do :)
Get the result.
I will update the trade every day.
Like, comment with your good mood or viewpoint, share with your circle. It’s together that we get stronger!
Good trades, Traders!
The golden bear
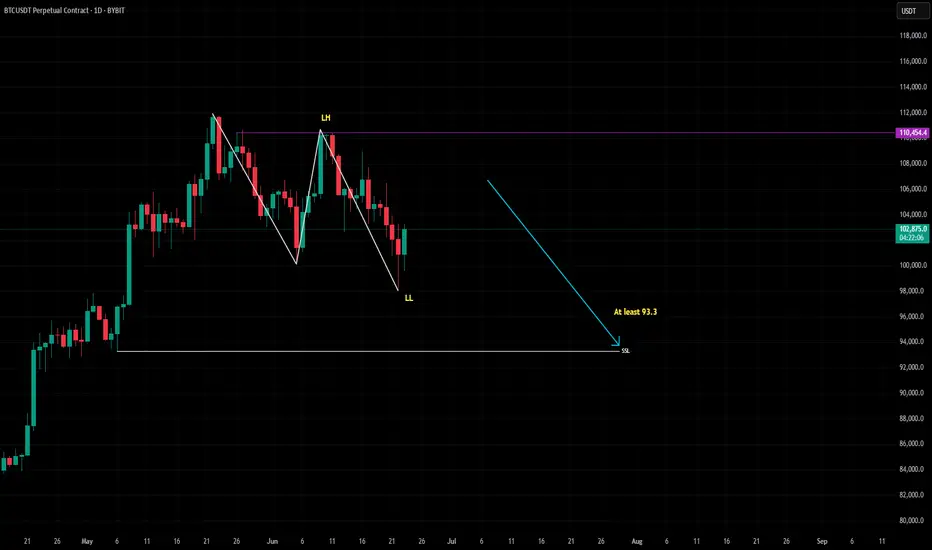
BTC Short to 93.3My target is at least SSL on 93.3
WTF, there is no need to post a huge text description to understand what is depictured on the chart!
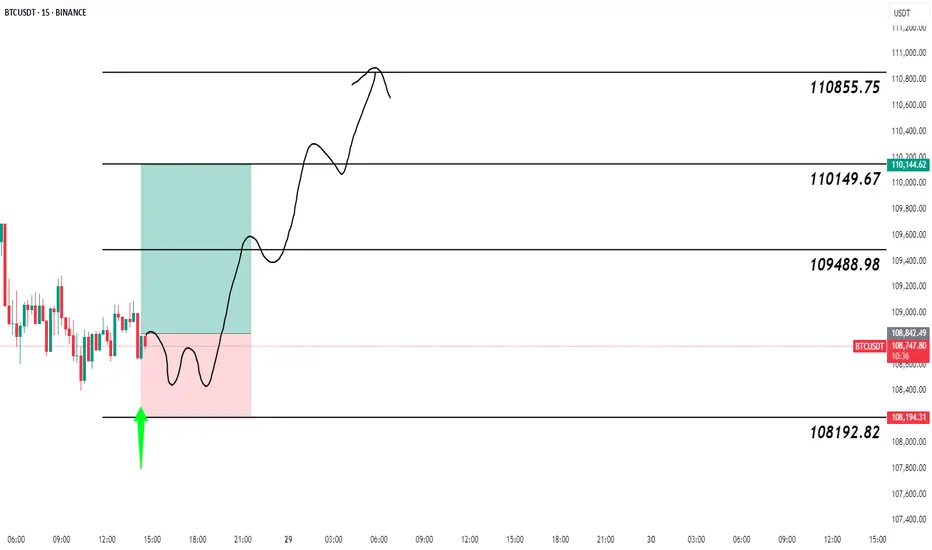
Bitcoin Long Now ! Details chart ! 89% Accuracy VIP Signal !🟢 BTCUSDT Long Setup | 15min (BINANCE)
Entry: ~108840 zone
Stop Loss: Below 108192.82
Take Profits:
TP1: 109488.98
TP2: 110149.67
TP3: 110855.75
Reasoning:
Liquidity grab below support.
Bullish rejection and structure shift.
Potential W pattern forming.
Clean RR and price action setup.
Trade Plan:
Expecting price to break above 109488.98, retest it, and then push toward 110855.75.
📊 Classic support rejection + market structure shift play.
🔔 Not financial advice. Manage your risk!
#BTC #BTCUSDT #Crypto #TradingView #PriceAction #LongSetup #Binance #TA
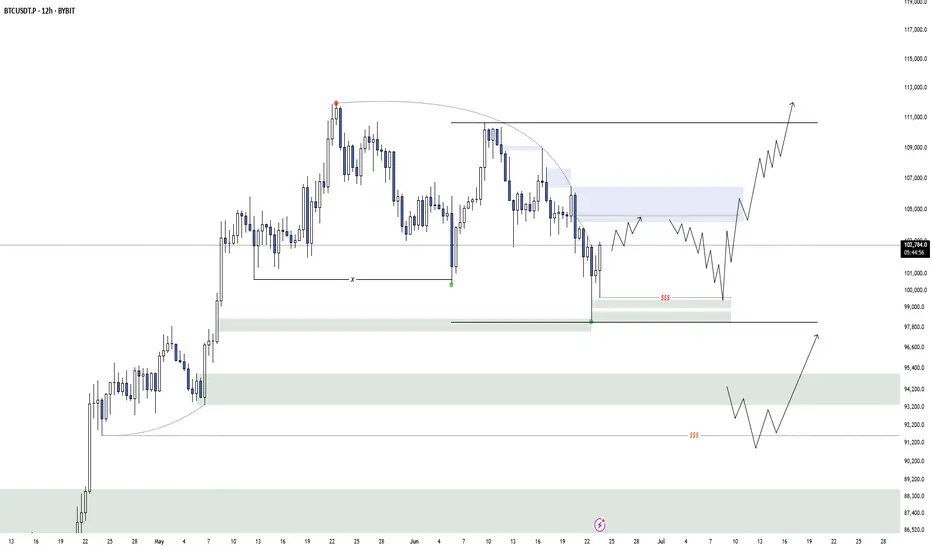
BTC MTF AccumulationThis is the current accumulation model i am watching to bring BTC back to ATH's and form the second deviation of the HTF distribution model. I would prefer if we could go lower and form a range from there, but at the moment thats all i got.
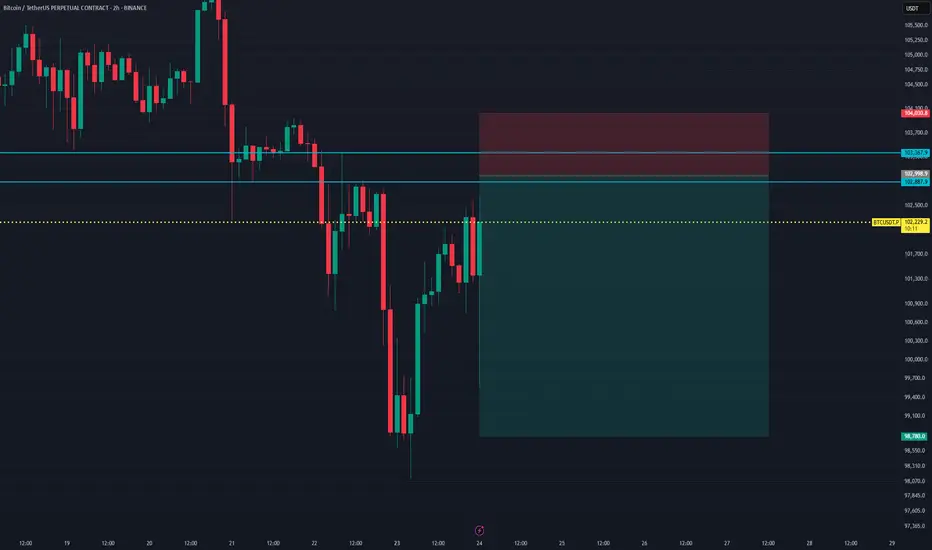
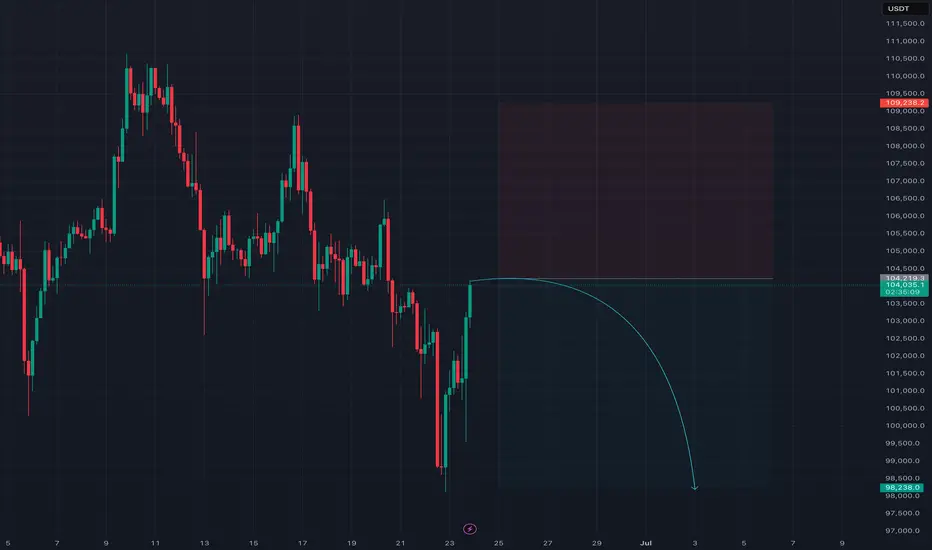
BTCUSDT Short Setup at Fresh Supply ZoneBTCUSDT is currently trading near $102,397, approaching a clean supply zone between $102,887 – $104,030, where strong historical rejection has occurred.
A short entry around $102,887 offers a high-probability setup with a stop above the zone at $104,030, targeting $98,780 as the take profit level. This aligns with a previous demand structure and offers an excellent Risk:Reward ratio of approximately 1:3.6.
Trade Setup:
- Entry: $102,887
- Stop Loss: $104,030
- Take Profit: $98,780
- Risk:Reward Ratio: ~1:3.6
This setup expects sellers to defend the supply zone, rejecting bullish attempts and triggering a downward move.