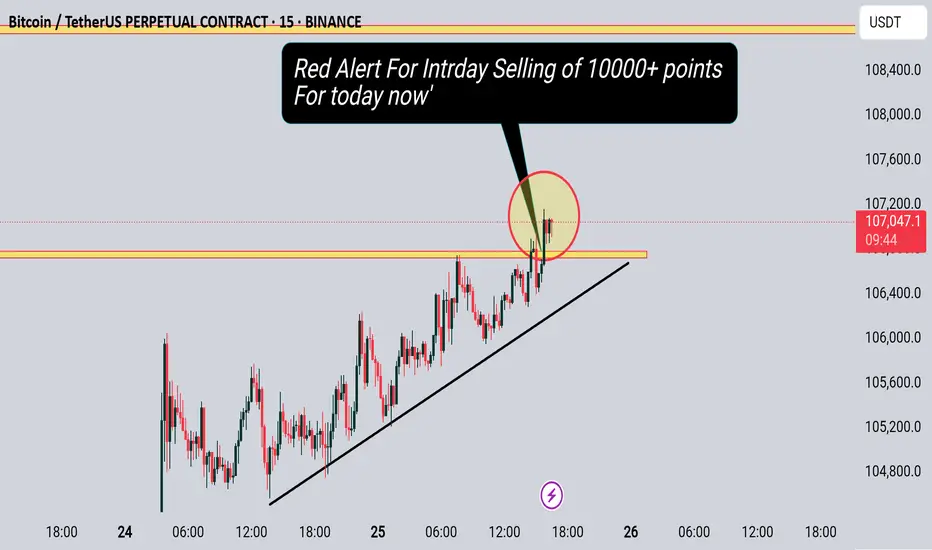
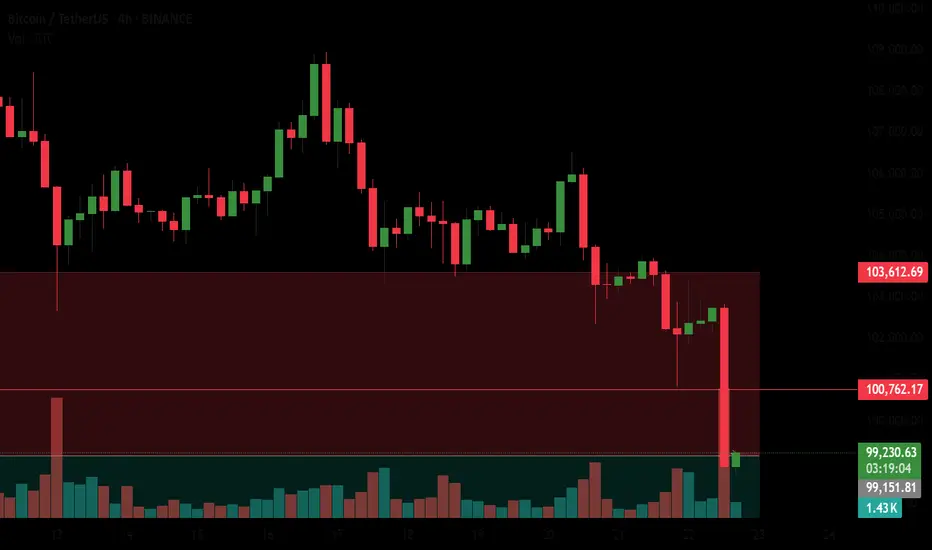
Red Alert For Intrday Selling #bitcoinHello trader's
This is your Red Alert level only for today intrday selling...
BTCUSDT.PS trade ideas
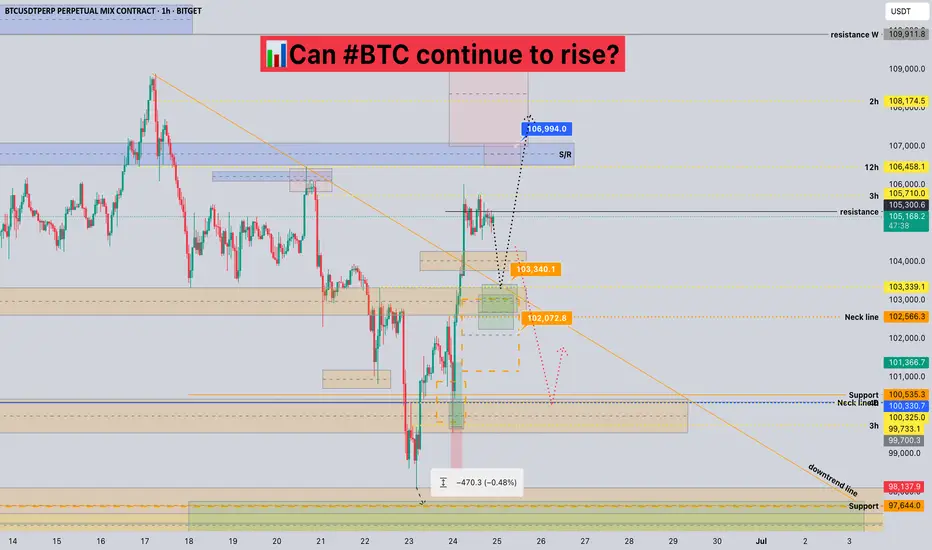
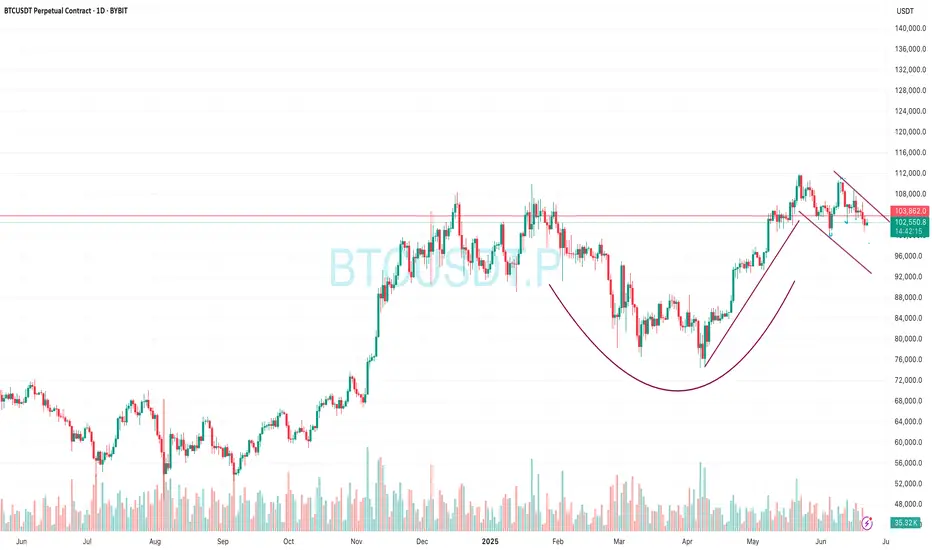
Can #BTC continue to rise?📊Can #BTC continue to rise?
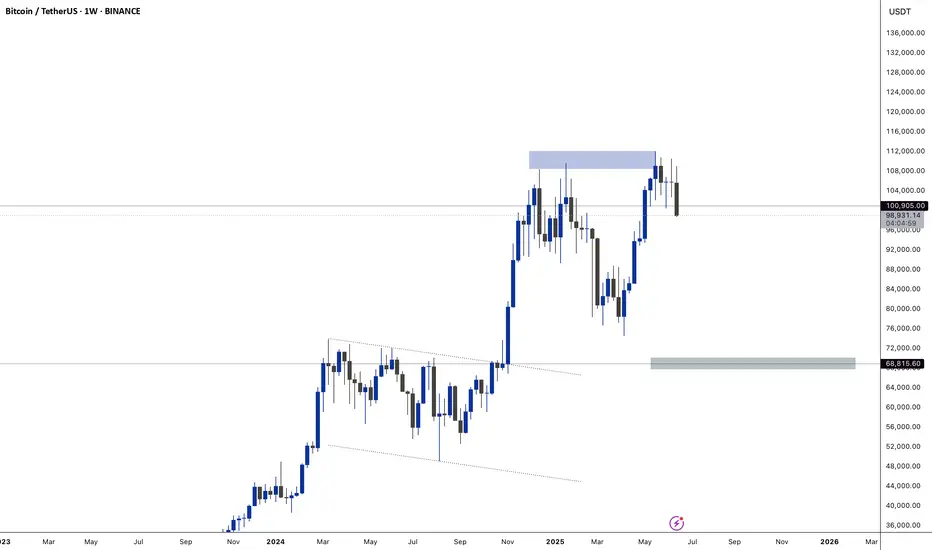
🧠From a structural perspective, we started to rebound after being very close to the ideal target area of the bearish cup-handle structure, and broke through the downward trend line, which means that the correction phase is over.
➡️So next we need to pay attention to the long trading opportunities after the pullback. At present, this position belongs to the contradictory range. It can continue to rise, but it will be very uncomfortable if we chase the rise. So wait patiently for trading opportunities after the pullback. We can pay attention to the neckline support area (102000-103000).
➡️If there is no pullback, but it continues to rise, then the resistance near 106500 is also worth our attention. This is the support-resistance conversion area that has been tested many times.
🤜If you like my analysis, please like 💖 and share 💬
BITGET:BTCUSDT.P
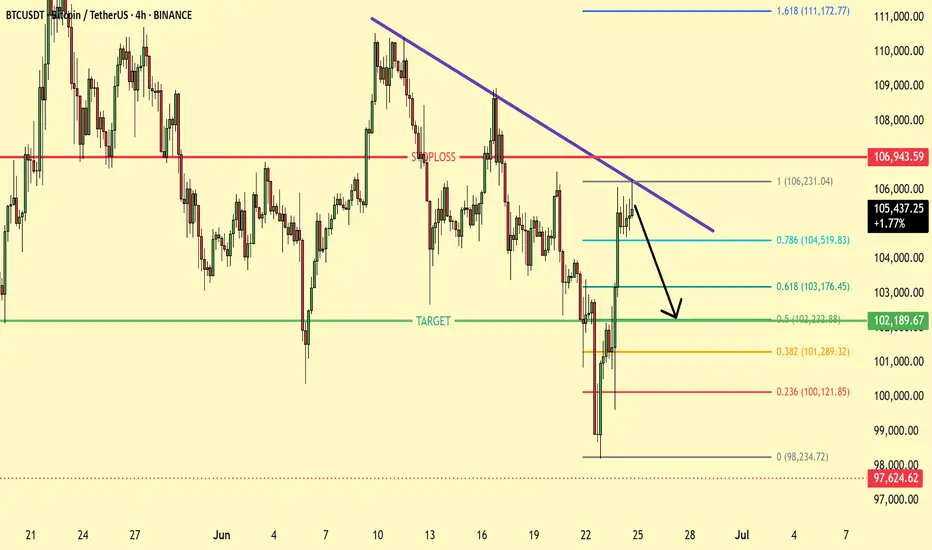
BTC rejected from the Resistance trend line BTCUSDT is currently testing a descending trendline near $105,364, with a potential bearish rejection expected. The chart suggests a short setup targeting the $102,200 area, while a break above $106,943 would invalidate the trade.
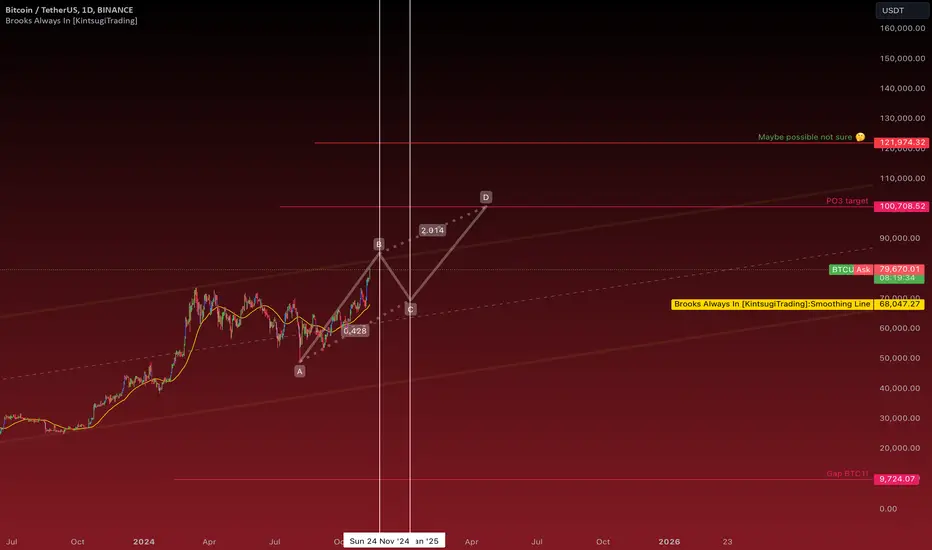
BTC midterm plan possibility
The current Bitcoin chart shows a P.O.3 pattern formation. Looking at the price targets, we can see a clear path to $100,000, which stands as a major psychological price level. The ongoing A-B-C pattern structure supports this price movement. If Bitcoin successfully breaks through the $100k level, we could potentially see an extension to around $120,000. After January, there's a strong possibility of a bullish trend that could help reach these targets, though this remains speculative and uncertain. Market movements depend on various factors, so always do your own research before making any investment decisions.This is one of the scenarios.Other way is going beyond 85k strongly and make pull back or continuation pattern (sideways)after that reach 100k.
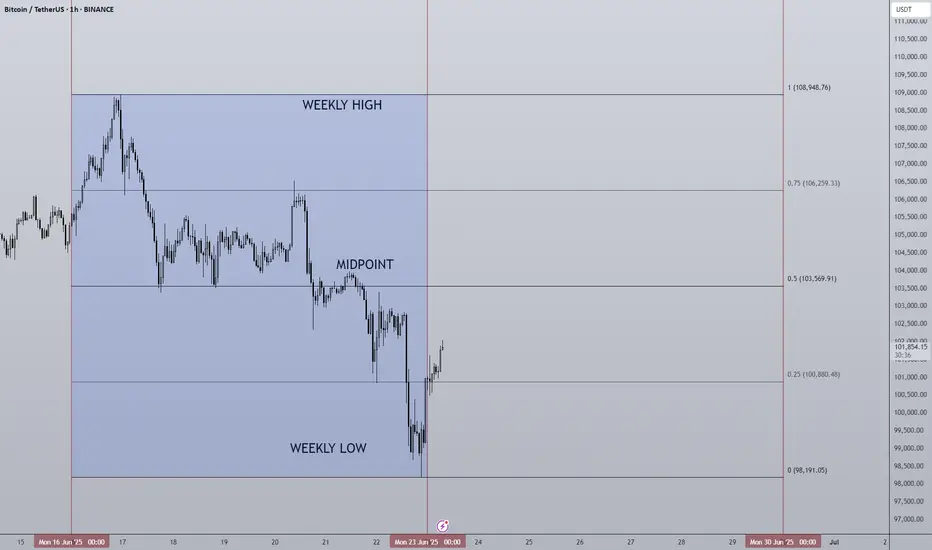
23/06/25 Weekly OutlookLast weeks high: $108,948.76
Last weeks low: $103,569.91
Midpoint: $98,191.05
Last weeks chart is a clear reflection of what happens when there is a constant stream of bad news... Geo-political escalations, America becoming more involved in the Middle-east and the FED refusing to cut interest rates.
It's well known markets do not like uncertainty, and throughout the week more and more questions have been asked with very few answers. Risk-on assets have taken a hit generally and BTC is no different, especially over the weekend. This price action should be taken with a pinch of salt as the volume is never as high as it is during the week and often it paints a false picture of how the market really feels. The market makers ultimately are just, over the weekend they often aren't involved and so I think we will know more accurately how much of this geo-political escalation is priced in by the end of the trading day. How the SPX reacts will be important too.
The FED once again refused to cut interest rates, it's clear president Trump is not happy with this. The market could have done with a cut but that will have to wait.
So for Bitcoin it's been a tough week and I can't see this getting better immediately. Bearish price targets for me would be $97,000, the short term trend is clearly biased short until some solid support comes in or something drastic happens in the political world for good. This week is about survival and caution while looking for opportunities to present themselves without knife catching.
Good luck this week everybody!
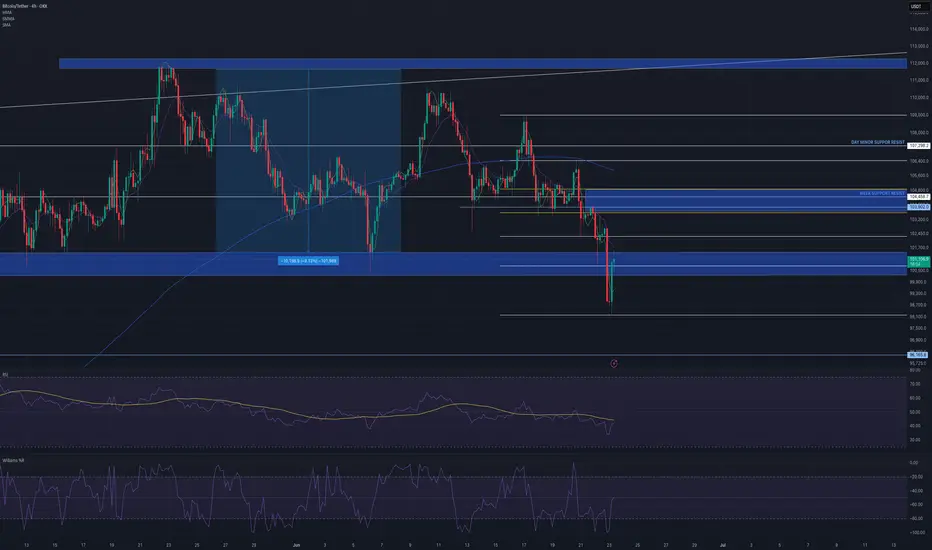
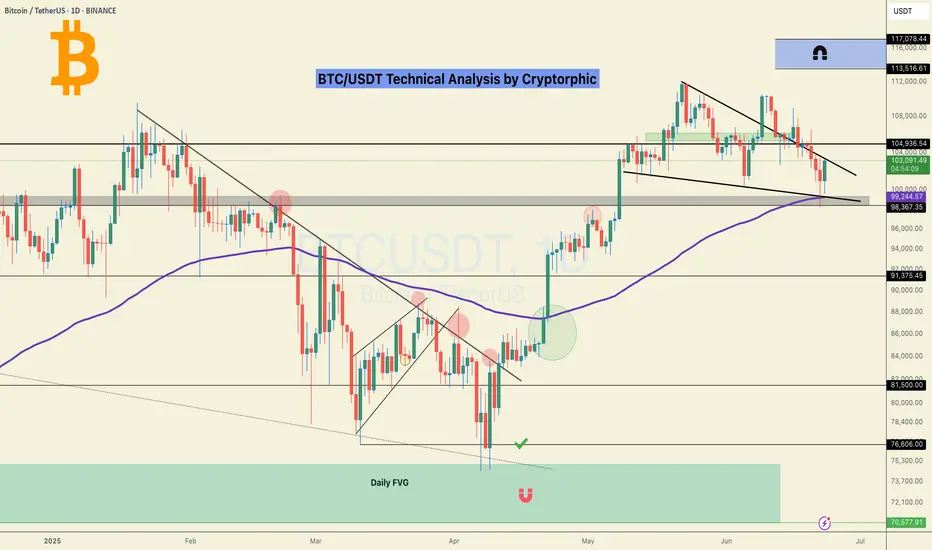
Bitcoin Under PressureBitcoin remains mired in a bearish trend as price action struggles below key moving averages—the 50-day, 100-day, and 200-day—all of which point to sustained downside pressure. On the higher timeframes, a clear descending trendline from the April–May highs remains firmly intact, reinforcing the macro downtrend.
The Relative Strength Index (RSI) continues to hover in the neutral-to-lower zones, with recent bounces still failing to cross bullish thresholds. A short-term relief rally emerged post-news volatility, with price attempting to retest the supply zone between $103.9K and $104K—a region of confluence with bearish Fibonacci levels and previous order blocks.
However, rejection at this level could set the stage for a further breakdown, targeting the $96.3K–$95.5K range. In the 1-hour and 4-hour timeframes, Fibonacci retracements and a climbing RSI suggest short-term relief is plausible, but a lower high formation would confirm continued bearish control.
BTC remains technically vulnerable despite short-term bounces, while geopolitical events and U.S. policy narratives shape market sentiment. Yet behind the volatility, continued ETF inflows, stablecoin stability, and altcoin resilience signal a market that, while cautious, remains fundamentally engaged.
Traders and investors alike should stay focused on key resistance levels for BTC, monitor developments in Middle Eastern tensions and U.S. crypto policy, and watch ETF and stablecoin flows as barometers of broader market conviction.
We PREDICTED correction, and here is the NEXT step⚡️ Hello, everyone! As I said in my previous ideas, the correction is just beginning. Some people link this to the hostilities in the Middle East.
But, in reality, this is just a way to find a reason. In fact, the charts have long predicted a correction, which I have been actively talking about for the last month.
📊 Let's take a look at what lies ahead:
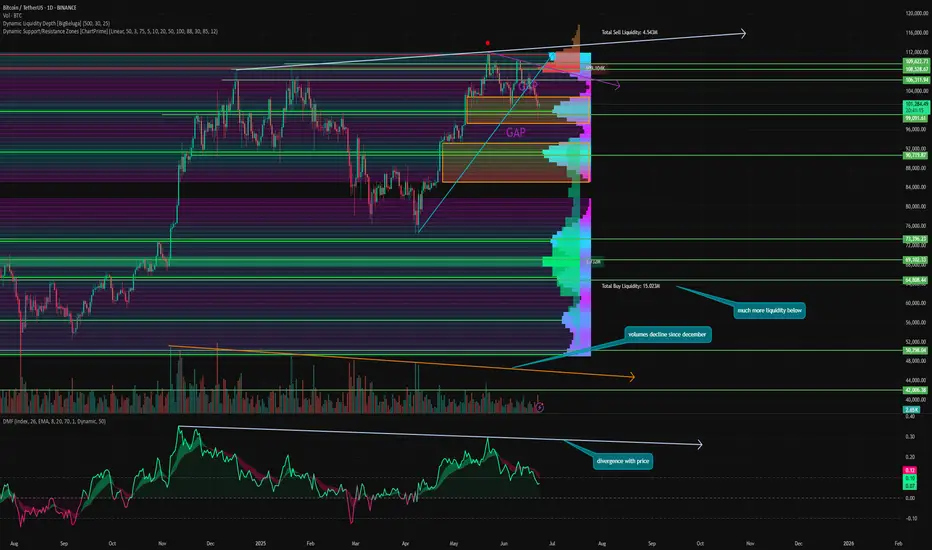
Having gathered liquidity below 100k, we are now seeing a short-term rebound. For me, the maximum target for this rebound is 106,000-107,000.
We have started to close the GAP at levels of 102,760 - 97,400. I expect it to close completely, after which we can move into a range. The next GAP is at levels of 93,280 - 85,230. So the further direction of movement is also obvious. After all, in 99% of cases, gaps close sooner or later.
⚙️ Metrics and indicators:
Money Flow - liquidity has been declining for more than half a year. This updated ATH was accompanied by a significantly smaller inflow of capital and formed a divergence. This means that there is still no new liquidity in Bitcoin, and for it to move higher, a new catalyst and cheaper prices are needed.
Liquidity Depth - as we know, the price tends to move from one liquidity zone to another. And now, there is significantly more liquidity at the bottom than at the top.
Dynamic Support/Resistance - Currently, 99,890 is a strong support level. However, each time we move lower below it. So I am confident that this level will be broken in the near future. The next major support level is 91,460.
Volume - is another indicator of the lack of new liquidity in Bitcoin. Since November 2024, purchase volumes have continued to decline!
📌 Conclusion:
I don't expect us to see Bitcoin at 60,000 before the fall. But 80,000 by September is quite possible. The fact that we will probably test the 90,000 level is not even up for discussion. Unless, of course, a new bullish catalyst appears. Altcoin ETFs are not even close to being one.
So, for now, I advise everyone to be patient and not try to predict the bottom. Prepare your bags for spot purchases, sit back in your chair, and enjoy the show!
🔥 Have a great week, everyone! 🔥
Checking the trend change after the volatility period
Hello, traders.
If you "Follow", you can always get the latest information quickly.
Have a nice day today.
-------------------------------------
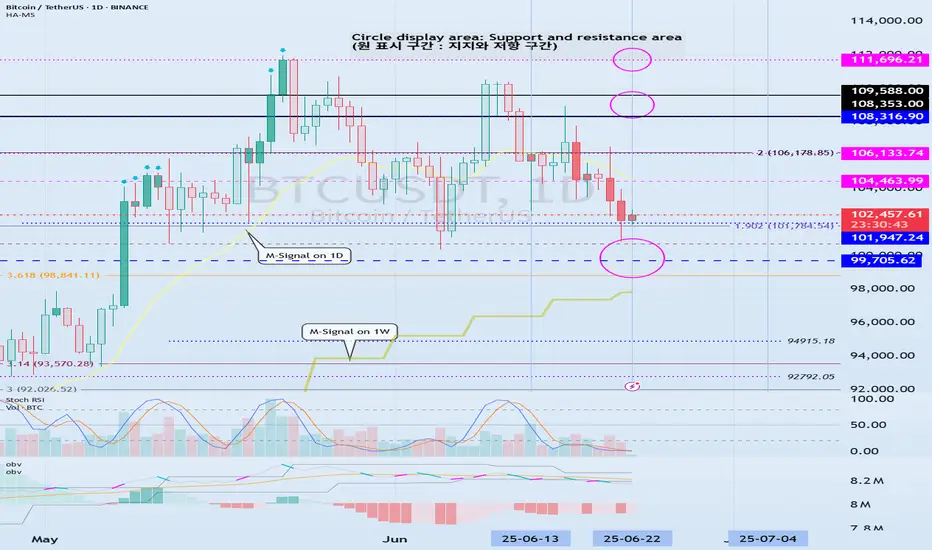
(BTCUSDT 1D chart)
This volatility period is expected to last from June 21st to 23rd.
Therefore, it is necessary to check the trend formed after the volatility period.
The 99705.62 point is the HA-High indicator point of the 1W chart, so it is important to see if there is support near this point.
If it falls without support, it may fall to around 89294.25.
The 89294.25 point is the HA-Low indicator point of the 1D chart.
Since the M-Signal indicator of the 1W chart is rising to around 99705.62, the area around 99705.62 is likely to play an important role as support and resistance.
Even if it turns upward, it must rise above the HA-High indicator point of 108316.90 of the 1D chart to maintain the price.
If not, it is likely to fall again.
-
The fact that the HA-High indicator was created means that it fell from the high point range.
In other words, if it falls below the HA-HIgh indicator point, it is likely to start a downtrend.
However, since the HA-High indicator is an intermediate value, if it is supported near the HA-High indicator, it is possible to show a stepwise upward trend.
The end point of the high point is the DOM (60) indicator.
Therefore, it should be interpreted that it has risen above the high point section only if it rises above the 111696.21 point.
Therefore, depending on how the 108316.90-111696.21 section is broken upward, an upward trend can be predicted.
----------------------------------------------------------------------
There are auxiliary indicators OBV indicators made of Low Line ~ High Line channels and PVT-MACD oscillator indicators.
The OBV indicator made of Low Line ~ High Line channels is an indicator that can see how the channel is structured, and whether OBV falls below the Low Line of the channel or rises above the High Line.
Therefore, you can predict the future trend based on the channel pattern.
-
The PVT-MACD oscillator indicator is an indicator created by adding the Close value dash PVT value to the MACD formula.
Therefore, it shows a similar appearance to the MACD oscillator indicator.
The reason for looking at the PVT-MACD oscillator indicator is to find out how the trading volume flows.
There are many trading volume indicators, but I think this PVT-MACD oscillator indicator reflects the trading volume flow well.
-
However, you should look at the support and resistance points where the changes in the movement of the PVT-MACD oscillator indicator, the OBV indicator created by the Low Line ~ High Line channel, and the StochRSI indicator occur.
If the changes in these indicators occur near the DOM(-60), HA-Low, HA-High, and DOM(60) indicator points, it can be of great help in creating a trading strategy.
The DOM(-60) indicator indicates the end point of the low point.
That is, falling below the DOM(-60) indicator means that it has entered the low point range, and there is a high possibility that it will show a full-scale downtrend.
The fact that the HA-Low indicator was created means that it has left the low point range.
That is, if it rises above the HA-Low indicator, it means that there is a high possibility that an uptrend will begin.
However, since the HA-Low indicator is an intermediate value, if it encounters resistance and falls, it is possible that it will show a stepwise downtrend.
Therefore, whether there is support in the DOM(-60) ~ HA-Low range is important.
-
Currently, the OBV indicator created as the Low Line ~ High Line channel has fallen below the Low Line.
Therefore, we need to look at whether the Low Line ~ High Line channel will change to a downtrend channel in the future.
We need to look at whether an 'M'-shaped pattern indicating a trend change occurs.
Since the PVT-MACD oscillator indicator is still below the 0 point, it can be seen that the selling force is dominant.
However, since the oscillator is maintaining an upward trend, you can see that the overall selling pressure is decreasing.
Even so, since it is located near the HA-High indicator, the resistance in the HA-High ~ DOM(60) section is expected to be considerable.
-
Support and resistance points should be drawn on the 1M, 1W, and 1D charts.
This will increase accuracy.
However, since the standard time frame chart for all indicators is a 1D chart, it is most important to check the flow of the 1D chart.
-
You may think it is difficult because you have to look at multiple indicators at once.
The most important thing is to look at the movement when approaching the HA-Low or HA-High indicator.
The reason is that the basic trading strategy is to buy near the HA-Low indicator and sell near the HA-High indicator.
-
Thank you for reading to the end.
I hope you have a successful transaction.
--------------------------------------------------
- Here is a description of the big picture.
(3-year bull market, 1-year bear market pattern)
I will explain more details when the bear market starts.
------------------------------------------------------
BTC/USDT Technical Outlook – Reversal Zone In Play✅ BTC/USDT Technical Outlook – Reversal Zone In Play
Current Price: 101,884.97 USDT
Structure: Bullish Reversal Setup
🧠 Market Insight:
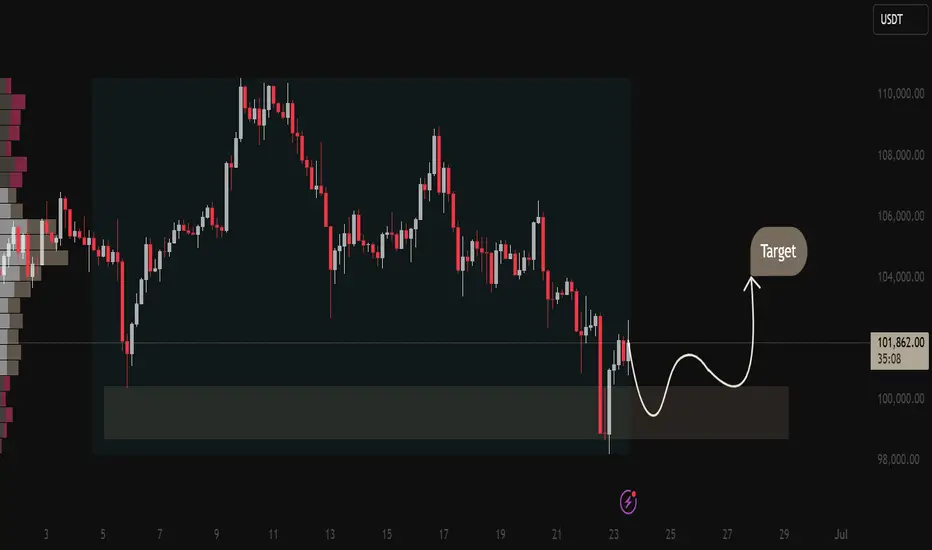
Bitcoin has tapped into a high-probability demand zone between 100,000 – 99,300 USDT, showing clear signs of buyer absorption after extended downside pressure. The chart illustrates a strong bullish reaction from this area, hinting at a potential shift in momentum.
📈 What the Chart Tells Us:
Demand Zone Activation:
The price has tested a historically reactive demand block and bounced with strength — indicating a possible exhaustion of sellers and re-entry by larger players.
Volume Cluster Confluence:
Volume Profile shows heavy historical activity around this zone. This suggests that the current bounce is not just noise — but supported by previous institutional interest.
Path Projection (White Curve):
Market structure suggests a minor pullback followed by bullish continuation toward the 104,000–105,000 USDT target. The curved projection outlines potential market behavior leading up to this target.
Short-Term Resistance:
First key resistance is seen around 102,800–103,200 USDT. A break above this would likely trigger bullish momentum toward target levels.
🔐 Trading Insight:
Bias: Bullish (Short to Medium Term)
Entry Zone: 100,200 – 100,800 USDT (buy on minor dip)
Target Zone: 104,000 – 105,000 USDT
Invalidation: Clean breakdown below 99,000 USDT
📊 Summary:
BTC is currently sitting at a critical demand zone with bullish potential building. Price action, volume profile, and market behavior all support a reversal toward 104K+. Traders should watch for confirmation on the next pullback before entering long positions.
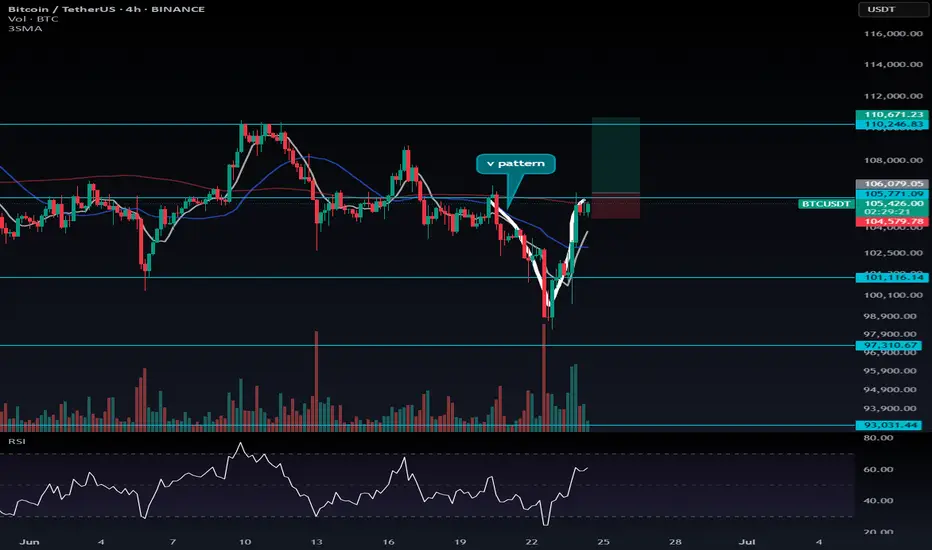
Potential Long Setup on BTC After Fakeout and V-Shaped Recovery🟢 Potential Long Setup on BTC After Fakeout and V-Shaped Recovery
After the fake breakdown around $101,116 and a strong V-shaped recovery, Bitcoin is showing signs of strength. If $105,771 breaks to the upside, a long entry with a stop at $104,579.8 could be a solid setup.
Keep in mind:
This long position should be taken with the bigger picture in mind — if BTC breaks $110,246.8, it might be much harder to catch a position then. So it's wise to already be in the market.
📌 Important note:
Don’t take heavy risk just yet. Skip taking profit (TP) on this one for now, but size your position cautiously. If the market confirms a trend later, you'll have more room to enter altcoins with higher conviction.
---
💬 What’s your take on this V-recovery? Are you entering early or waiting for more confirmation? Let me know in the comments!
Everyone Talks Charts — But the Order Book Knows FirstHello, Traders! 🤓
Everyone watches the chart. But not everyone watches the market itself. If you’ve ever wondered why the price suddenly jumps or stalls just below resistance, you’re likely looking at the surface, not the structure underneath. And that’s precisely what DOM in trading helps to reveal.
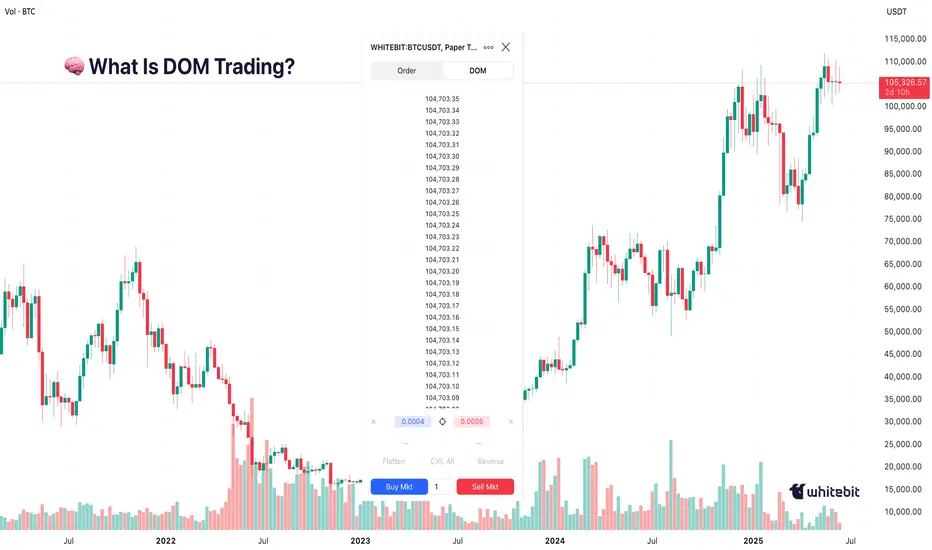
What Is DOM Trading?
Let’s start with the basics. DOM stands for Depth of Market, which shows real-time limit buy and sell orders at different price levels. Some traders call this the trading DOM. Unlike a candlestick, which tells you what already happened, the DOM trading view shows what participants intend to do. This makes it useful for those trying to understand short-term moves, liquidity pressure, or even the psychology behind a specific level.
So if you’re asking, “What is DOM in trading?” or “How does DOM work in crypto?” – it’s essentially a live x-ray of the market’s limit order book.
Order Book Trading in Crypto
The order book, the live list of buy and sell orders, acts like a constantly updating roadmap of trader intentions. In order book trading, it’s not just the numbers that matter but how they shift. For example, traders often notice thick sell walls near round numbers (e.g., $70,000 BTC), sudden order pulls, which can fake out breakout traders, and absorption, where big buy/sell orders are filled silently, without noticeable price change… When analyzed properly, this behavior gives context to price action, something traditional indicators can’t always offer.
How to Use Crypto Trendlines… and Then Watch DOM
Drawing trendlines in crypto is common. Everyone has their version of a breakout setup.
But what happens when the price reaches that line? That’s where DOM trading shines.
It doesn’t predict whether the line will hold or break, but it shows whether liquidity is building or backing away right at the critical moment. The combination of crypto trendlines and DOM behavior often exposes subtle market dynamics, a large bid appearing just as price touches support, for instance, or offers vanishing before a breakout.
That’s not about strategy. It’s about market structure awareness, watching both the levels and the surrounding behavior.
Chart vs DOM: Two Sides of the Same Story
The crypto psychology chart tells you what’s happened — highs, lows, closes. The DOM, on the other hand, shows live trader psychology. And that’s where the psychology of crypto trading gets interesting.
When everyone’s waiting for BTC to hit $100K, for example, you might already see: Buyers are stacking bids at $95K, hoping for a retrace. Sellers layering offers at $99.9K, defending the level. And the sudden orders near $100K, a possible trap. In this way, round numbers in trading aren’t just emotional, they’re structurally significant. Especially in crypto, where the market cap is still heavily influenced by sentiment.
Final Thought
Some traders find it useful to spend a few sessions just observing the DOM. Psychological numbers in trading, like $10K, $20K, or even the famous 100K BTC milestone, are often surrounded by unusual order book behavior. So, the next time price seems to move “out of nowhere,” ask yourself: Was it really out of nowhere… or did the DOM in trading already whisper it?
You don’t need to trade based on it. But knowing how to draw trendlines in crypto and then pairing that with DOM behavior can offer a sharper view of where the market might hesitate, reverse, or run. Sometimes, seeing how others are placing their bets matters more than where. What do you think?
Short BTC. Next price to touch is 87 to 89KHi,
Market has broken down the structure. When market breaks its structure it continue to fall till the next structure shows its presence which comes under area of 89K.
DIY its for educational purpose.
Happy trading.
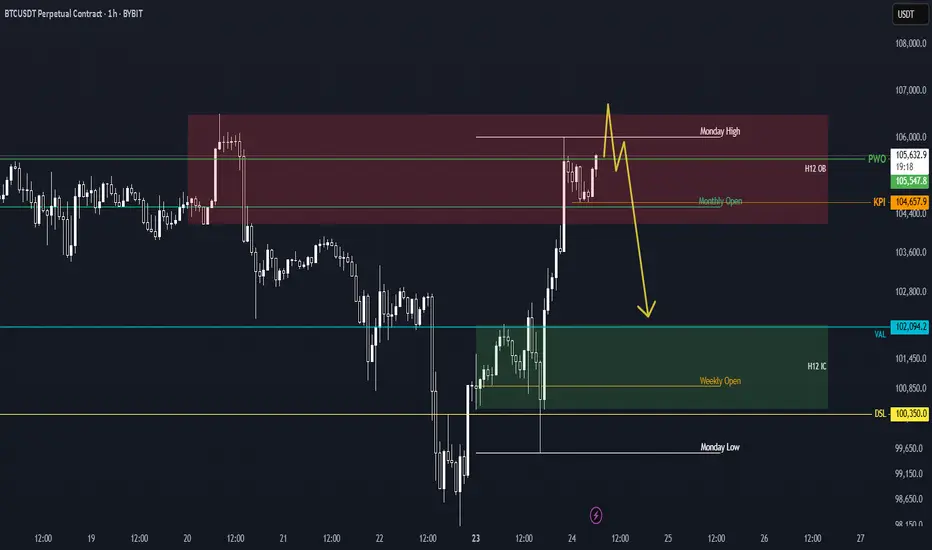
Possible next scenario from BTCTakes Monday's high, traders get too excited.
Followed by a strong H1 candle close back inside Monday's range (trigger)
Aim for the H12 inside candle consolidation (and value area low of last week)
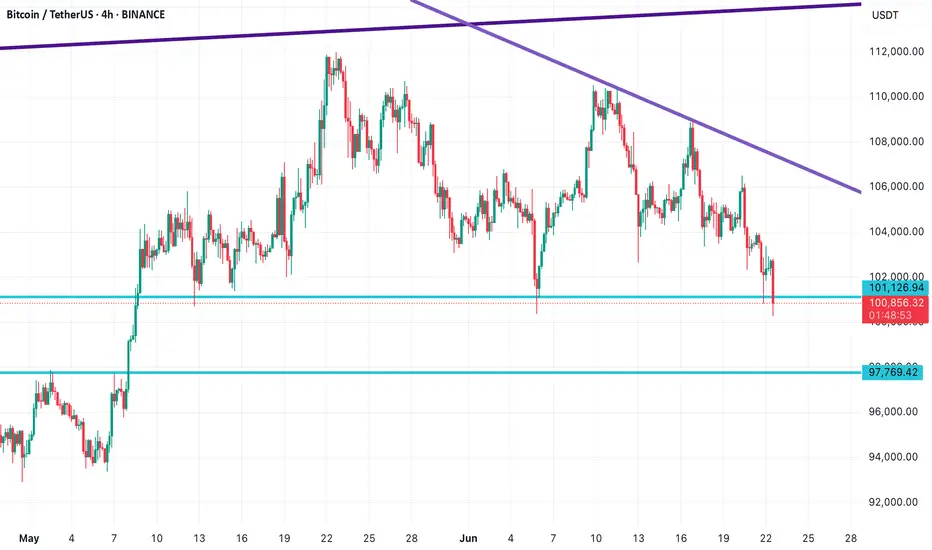
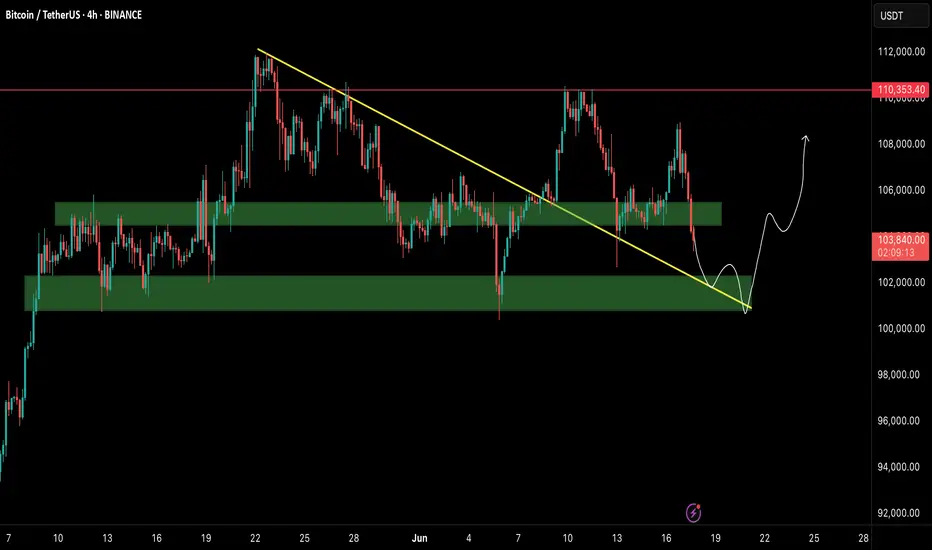
Bitcoin Technical Analysis | Critical Support Zone in 4H Timefra📉 Bitcoin Technical Analysis | Critical Support Zone in 4H Timeframe
Bitcoin is currently testing a major support zone at $101,126, but bearish pressure remains high.
⚠️ If bulls fail to hold this level and no strong candle closes above it, we could see a further drop toward the $97,769 and $96,475 support zones.
However, if Bitcoin manages to bounce from here and begins a recovery, make sure to watch the descending purple trendline – a key resistance level that could slow down the upside.
🧭 The support and resistance levels drawn on this chart are highly reactive zones — use them to plan your trades and set smart entries and exits.
👉 Follow for more clean and actionable setups on BTC, ETH, and major crypto pairs!
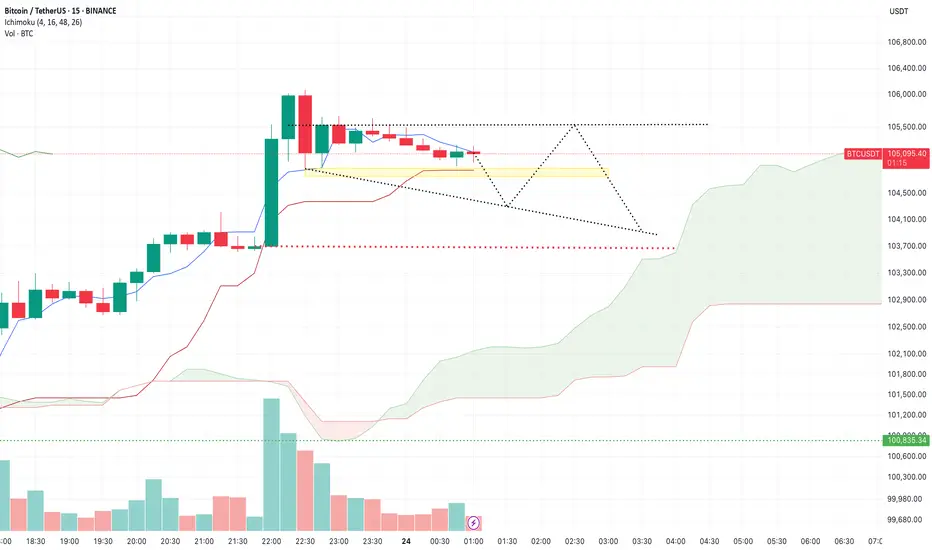
BTC/USDT – Intraday Plan (15m, Ichimoku) by RiscoraWe’re approaching a major liquidity zone in the yellow highlighted area. I expect this zone to be swept soon — likely triggering a wave of stop-losses and liquidations. Once this liquidity is taken, I anticipate a sharp move down on increased volume.
After this liquidity event, my base case is a buyback from lower levels, with price rebounding towards the upper boundary at 105,500. From there, I’m watching for renewed selling pressure to create another push down, forming a descending wedge pattern and a retest of the 104,000 zone.
The key price range I’m focused on for the coming session is 104,400 – 105,500.
I expect BTC to spend most of tomorrow trading within this range, as it consolidates after the volatility spike.
However, if in the next few hours we see a 1H candle close decisively below the red-marked level at 103,700, this would be a strong bearish signal. In that case, I expect the move to extend further down toward the 102,300 area.
Whether price eventually breaks higher or lower from this range will depend on macroeconomic flows and the market’s reaction inside the outlined zone. I’ll continue to update as the situation unfolds.
BTC - Cup & Handle?BTC forming a cup and handle on the 1D chart which seems to be the main timeframe/narrative of play..
Bitcoin Crash Will Continue to Levels that will REKT majority!??MARKETSCOM:BITCOIN crashed towards $98k so far! Almost 10% drop so far! Crypto noobs and mass media manipulators will blame this CRYPTOCAP:BTC crash on the Iran and Israel conflict! Professional traders will, however, tell you that this was orchestrated and the crash was already planned beforehand, and the best traders caught the crash from the top at $109k and made a profit on this Bitcoin correction! Professional insider trading against news manipulation, artificial conflicts, and emotional trading !

#BTC Bounced, 100EMA saved the day!100 EMA saved the day.
But the one concern? We’ve printed a new Lower Low, not a great sign.
The chart looks bouncy, but the overall structure still feels uncertain.
No point guessing or forcing trades here, I’d rather wait for clear confirmation.
I’ll share updates if I spot any changes or interesting altcoin setups.
For now, patience is our best edge. I know many altcoins might look great, but BTC Dominance is not yet done. I'll be sharing that chart tomorrow.
Stay sharp.
Hit that like button if you find this short update useful.
Thank you
#PEACE
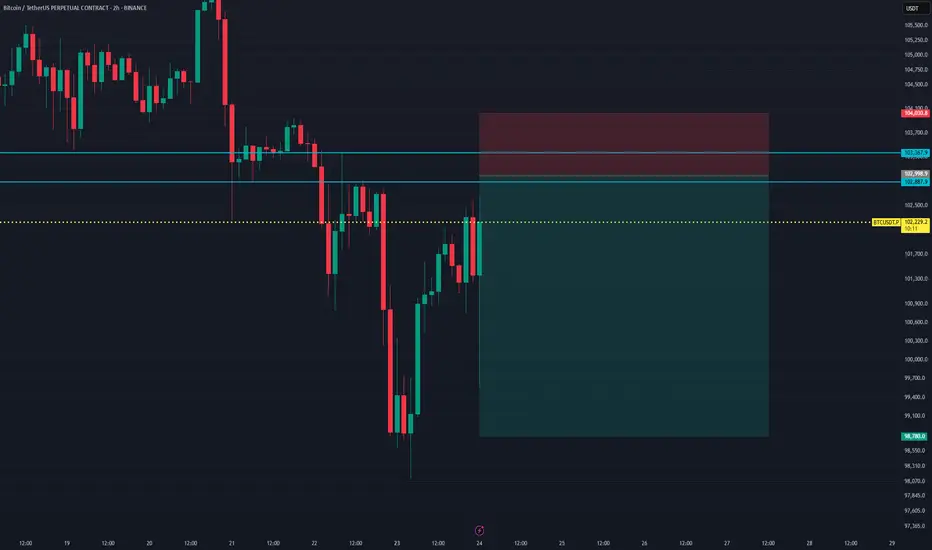
BTCUSDT Short Setup at Fresh Supply ZoneBTCUSDT is currently trading near $102,397, approaching a clean supply zone between $102,887 – $104,030, where strong historical rejection has occurred.
A short entry around $102,887 offers a high-probability setup with a stop above the zone at $104,030, targeting $98,780 as the take profit level. This aligns with a previous demand structure and offers an excellent Risk:Reward ratio of approximately 1:3.6.
Trade Setup:
- Entry: $102,887
- Stop Loss: $104,030
- Take Profit: $98,780
- Risk:Reward Ratio: ~1:3.6
This setup expects sellers to defend the supply zone, rejecting bullish attempts and triggering a downward move.
Bitcoin | Long | 3hrsThis technical analysis is for informational and educational purposes only. It does not constitute financial advice. Remember to always research and consult with a professional before making investment decisions. Good luck! 📈💼🚀

BTCUSDT Update — Big Macro Forces In Play!!Hey Traders!
If you’re finding value in this analysis, smash that 👍 and hit Follow for high-accuracy trade setups that actually deliver!
Bitcoin once again testing key support levels as global tensions continue to fuel uncertainty in the markets.
Chart Overview:
BTC broke down from short-term resistance and is now retesting the major support zone between $102K–$103K. The structure still remains within a broader consolidation range, but this support zone is absolutely critical for bulls to defend.
Immediate Resistance: $106K → $110K
Immediate Support: $102K → $100K
A breakdown below $100K could trigger deeper liquidations towards $95K–$98K, while a successful defense here could push BTC back toward previous highs.
Geopolitical Impact:
Global headlines are heavily influencing risk assets right now:
🇮🇱 Israel-Iran tensions are escalating.
🇺🇸 The US is signaling stronger involvement diplomatically, adding more fear to markets.
📉 Traditional markets have already started to show signs of caution.
Bitcoin, as a risk asset, remains vulnerable to these global macro shocks in the short term.
The Game Plan Right Now:
If we see sustained support at $102K–$103K, there’s still room for a relief bounce towards $106K–$110K in the near term.
However, if global tensions escalate further, expect increased volatility with downside liquidity grabs.
Stay cautious with tight risk management. Macro headlines are still driving sudden sentiment shifts.
📊 My Bias:
Watching for potential sweep of $102K with possible reversal structure forming. Any clear reclaim of $105K may signal a local bottom.
📝 Key Takeaway:
Global narratives are bigger than technicals right now. The next few days could dictate whether BTC holds or faces another sharp liquidation event.
Stay patient. Stay disciplined. And most importantly: manage your risk.
👉 Follow for more real-time updates as we track both price action and macro headlines impacting crypto.
BTCUSDT Hello traders.
The BTCUSDT trade I shared the other day played out just as expected, with BTC experiencing a significant drop in value shortly after. The price fell all the way down to the 98K level.
Following this decline, I anticipate a short-term rebound toward the 102K–103K range, after which I expect the downtrend to resume. Therefore, I’ve placed a Sell Limit order at 102,350, and I’m currently waiting for the price to reach that level.
If you'd like, you can consider this opportunity in the same way.
🔍 Trade Details
✔️ Timeframe: 1-Hour
✔️ Risk-to-Reward Ratio: 1:2
✔️ Trade Direction: Sell Limit
✔️ Entry Price: 102,350.24
✔️ Take Profit: 100,250.08
✔️ Stop Loss: 103,399.62
🕒 If the trade doesn’t gain strong momentum, I will keep the position open only until 23:00 (UTC+4) today. Otherwise, I will manually close the trade—either in profit or at a loss—depending on price action.
🔔 Disclaimer: This is not financial advice. I’m simply sharing a trade I’ve taken based on my personal trading system, strictly for educational and illustrative purposes.
📌 Interested in a systematic, data-driven trading approach?
💡 Follow the page and turn on notifications to stay updated on future trade setups and advanced market insights.
