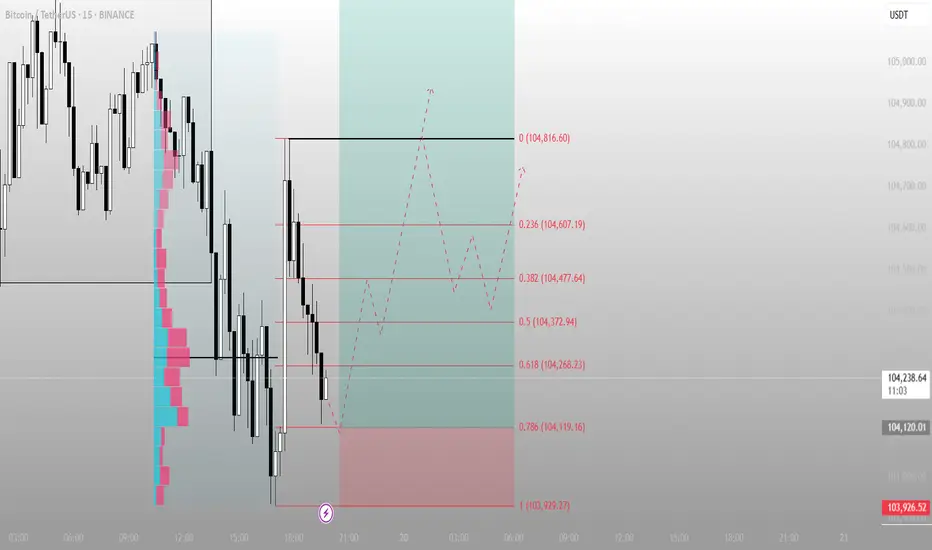
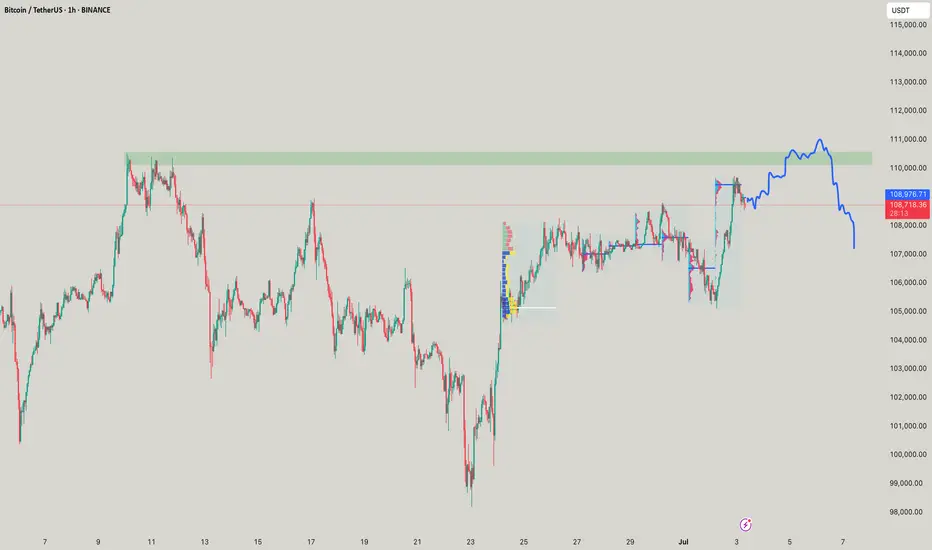
BTC – 15min Reversal Structure & Fibonacci ReclaimWe’re currently witnessing a potential short-term reversal on BTC’s lower timeframe after a volume-supported breakdown and sweep of local lows.
🔍 Key Observations:
Price swept liquidity at local lows (~103,929.27)
Entered into a clear reaccumulation box with responsive buyers
Volume profile shows prior POC just above – room for fill
Fibonacci retracement aligns with key structure:
0.5 = 104,372.94
0.618 = 104,268.23
1.0 = 104,816.60 (final high target for this impulse)
📈 Potential Play:
Entry Zone: Just above the sweep candle (104,100–104,200)
Target 1: 0.382 at 104,477
Target 2: 104,816.60
Invalidation: Close below 103,926
🧠 Mindset:
This is a classic liquidity sweep → reaction → reclaim pattern. If BTC flips the 0.5 level with strong momentum, a short squeeze toward the 104.8K area becomes likely.
Great opportunity for scalpers or day traders.
Let me know if you want this turned into a long-form breakdown or sent in another format.
BTCUSDT.PS trade ideas
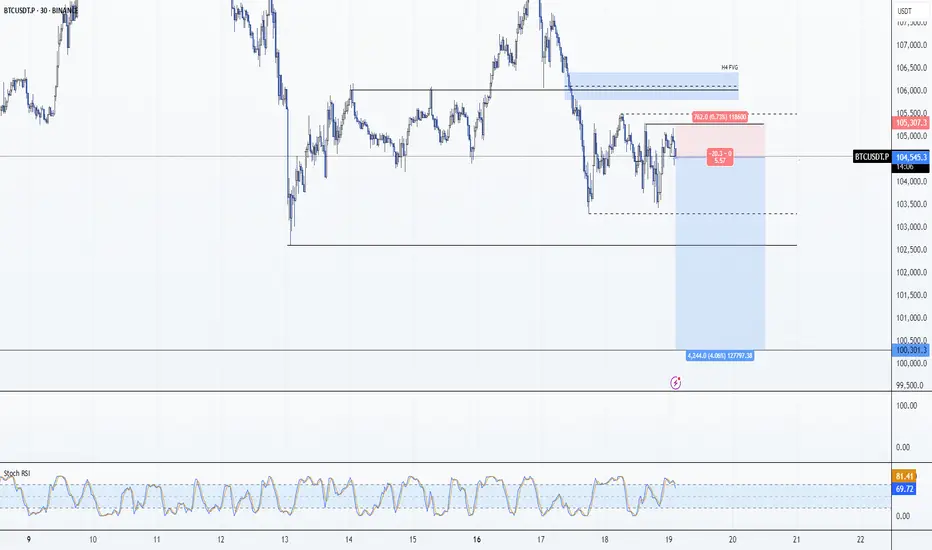
BTC: Short 19/06/25Trade Direction:
BTC Short
Risk Management:
- Risk approx 0.25%
Reason for Entry:
- M30 + M15 Bear Div
- Rejected off Monday low
- Failure to break weekly open
- H1 overbought
- Market is choppy, HTF Bearish
Additional Notes:
- Compounding shorts to maximize edge if trade confirms, currently have a risk free SOL short running. Moving my risk to this.
BTC
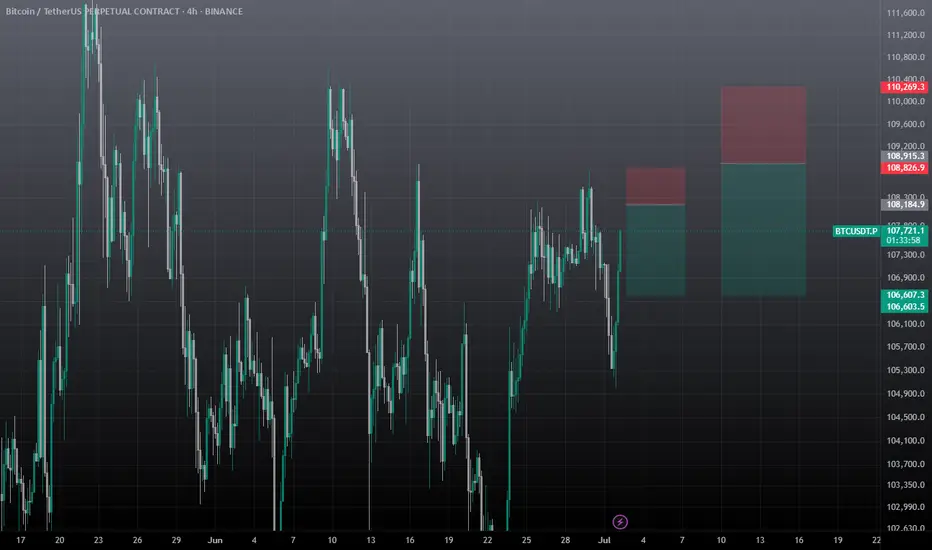
BTC is currently in local consolidation. After a liquidity grab on either side, potential entry setups may form via the AMD pattern — but only if key conditions are met.
No setup — no trade. Wait for confirmation.

#Bitcoin Update - 19.06.2025🚨 #Bitcoin Update – 19.06.2025 🚨
For the first time after FOMC, Bitcoin is showing an unusual calm – and yes, that’s pretty strange, especially considering the ongoing tensions in the Middle East. But let's break it down clearly and from my point of view. 👇
🔹 Arrow #2 remains a crucial resistance level. Price *did* break above it, but there was no strong confirmation or momentum – it got rejected and pulled back.
🔸 Currently, Bitcoin is stuck in a range, moving between Arrow #2 and Arrow #4 (marked by black lines). This range-bound behavior might continue for a while unless we get a strong breakout.
🌟 Now, pay close attention to the yellow lines under Arrow #3 and Arrow #5 – these are key support zones. As long as these hold, bullish sentiment remains intact.
✅ Also, Arrow #6 (black line) is the last strong support – only if this breaks, we can start talking about a potential bearish move or at least a deeper retest.
📈 In my opinion, we might see another attempt to break the All-Time High (ATH) very soon. Price still looks bullish, and as long as we hold above Arrow #6, there’s no clear sign of weakness.
🎯 Summary:
* Market is calm but not dead.
* Still bullish unless Arrow #6 breaks.
* Range between Arrow #2 & Arrow #4 continues.
* Eyes on next ATH attempt! 🚀
🧠 Stay patient. Stay focused.
📊 Next up: ETH and Bitcoin Dominance analysis coming soon – make sure you follow so you don’t miss the update!
\#Crypto #BTC #Trading #BitcoinAnalysis #CryptoUpdate #BTCUSDT

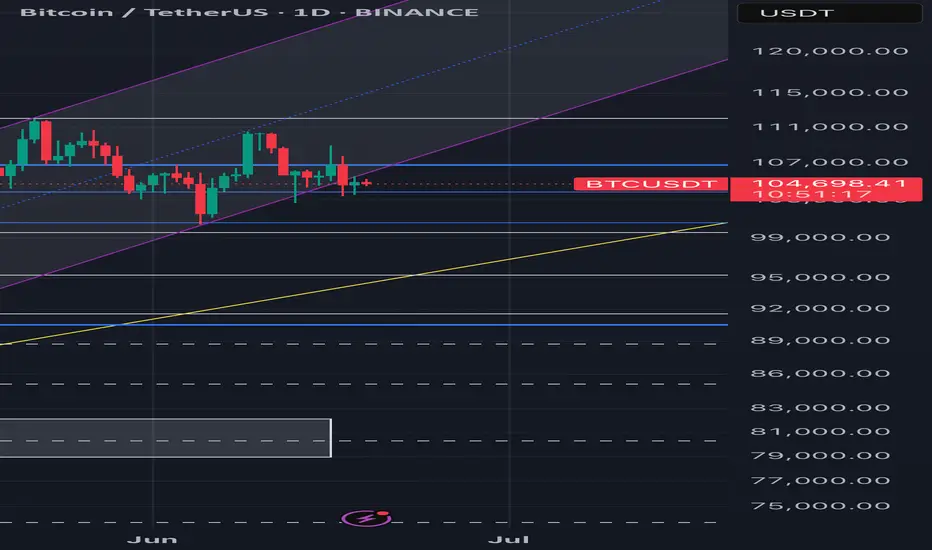
BTC/USD – Price Rejected at ATH | Key Support in PlaY Bitcoin recently reached a new all-time high at $111,942, but the daily candle closed lower around $109,550, signaling a potential rejection.
On the 1D timeframe, we are now watching the $100,725 level closely. A confirmed break below this support would be a strong signal to consider short positions.
Until then, BTC may consolidate or attempt another push higher. Patience is key here — wait for confirmation.
📌 Key levels:
• Resistance: $111,942 (ATH)
• Support: $100,725 (critical break level)
🧠 Trade safe, manage risk, and follow for more analysis.

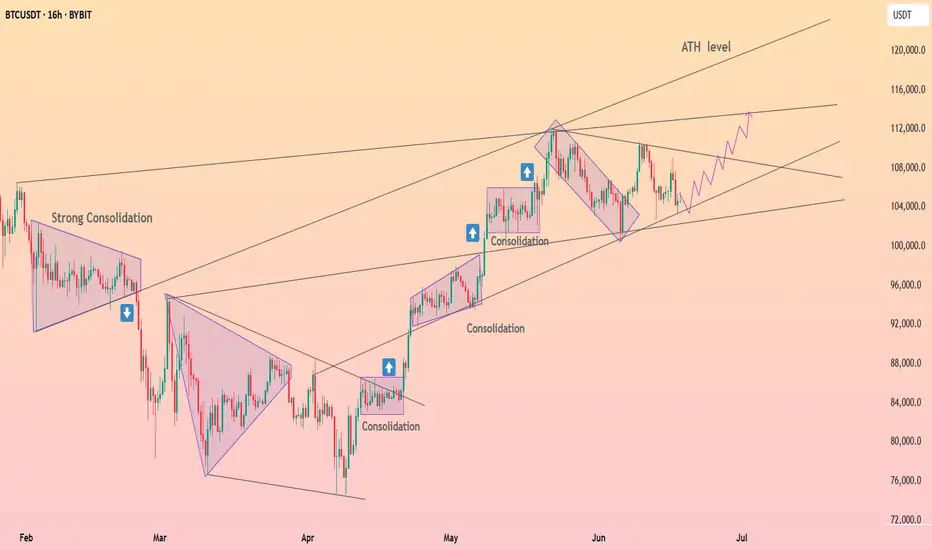
HolderStat┆BTCUSD forms a triangleBYBIT:BTCUSDT trades inside a narrowing flag between 104 k and 108 k. A push past 108 k activates the pole projection toward 112–114 k and possibly the ATH rail; rejection sends price to retest 102 k support before the next offensive.
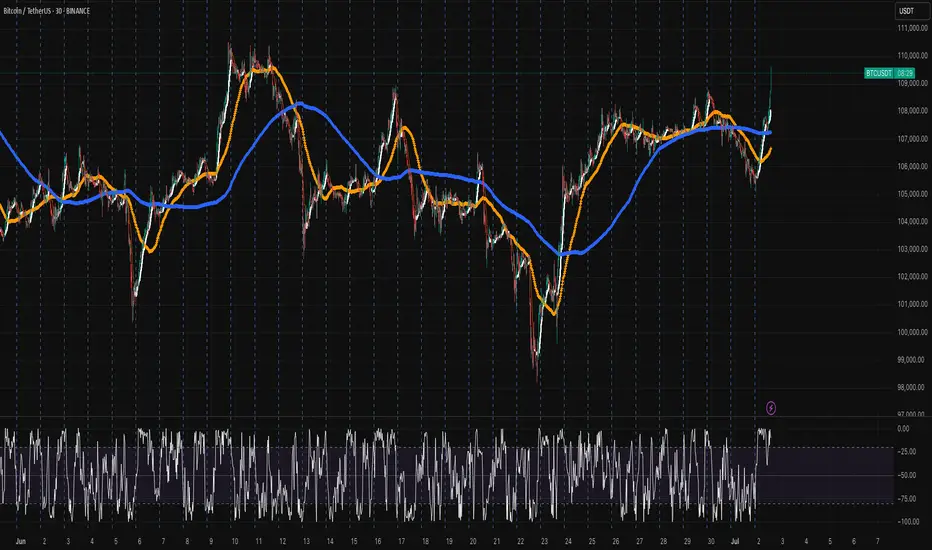
Bitcoin (BTC): Buyers Accumulating Near 200EMA | Pump Incoming?Buyers are showing dominance near the 200EMA, which might lead the price to upper zones and give us a good bounce from here.
What we are expecting is some sort of sideways or neutral movement before the weekend hits, and during the weekend we are looking to see strong upside movement.
Swallow Academy

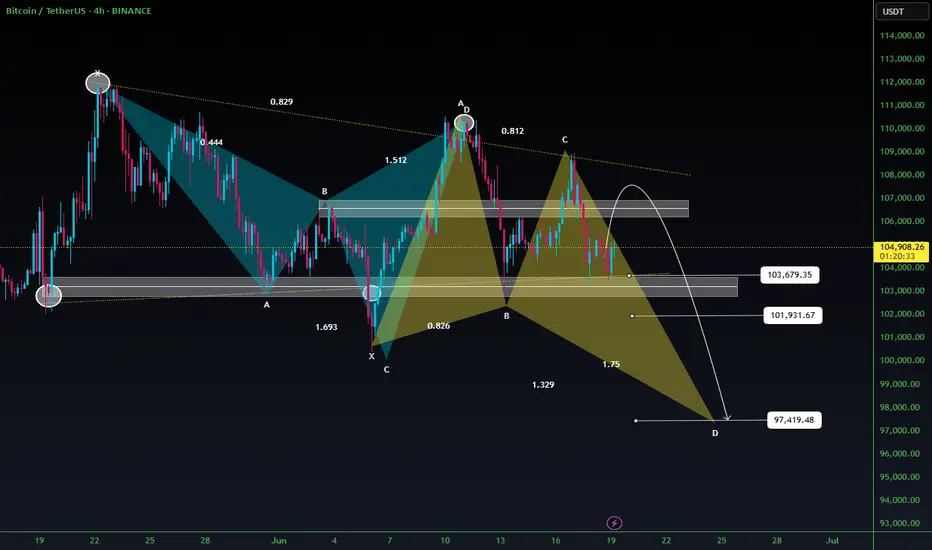
Technical Analaysis Setup – #BTC/USDTTechnical Analaysis Setup – #BTC/USDT
#Bitcoin is currently forming a bearish harmonic pattern indicating a potential correction toward key support zones.
📉 The price action suggests the development of a Gartley pattern with projected downside targets around $103,679, $101,931, and possibly extending to $97,419.
A critical resistance zone between $105,000 and $106,000 will be pivotal for either confirming bullish momentum or triggering a bearish reversal.
If BTC fails to break through this resistance and confirms the bearish reversal signal, a deeper decline toward the aforementioned support levels becomes highly probable.
🎯 Target 1: $103,679
🎯 Target 2: $101,931
🎯 Target 3: $97,419
Bitcoin Prepares for Upward MoveBitcoin has formed a flag pattern, indicating consolidation at a structural base. A confirmed breakout on the daily chart would strengthen the case for a continued upward trend.
BTC - will it touch ATH @ 112K ?Well the move of BTC was moved just touching the 4H or 1H ob acted as a well cushion and moved up, Looks like this is going to happen for once and then can be seen!
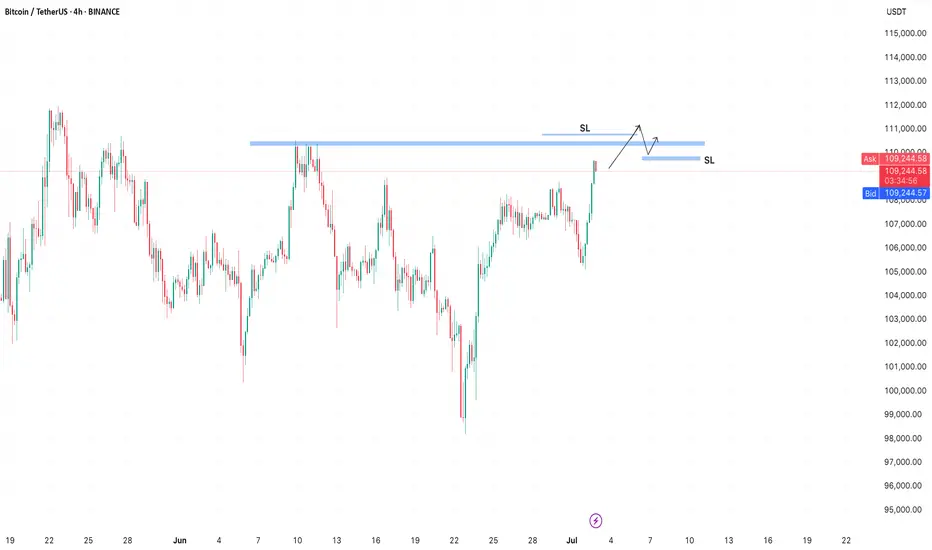
BTC is approaching a strong zone!BTC has a strong zone around 110,500 where a large number of orders are stacked.
In crypto, it’s common for stop losses to be taken on both sides.
After a breakout above the zone, short sellers get liquidated, while buyers enter the market — only to be stopped out by a false breakout when the price drops below the zone to trigger their stops.
Btcusd techinical analysis.Btcusd technical analysis next move posibale at h1 time frame.not finchinal advice.
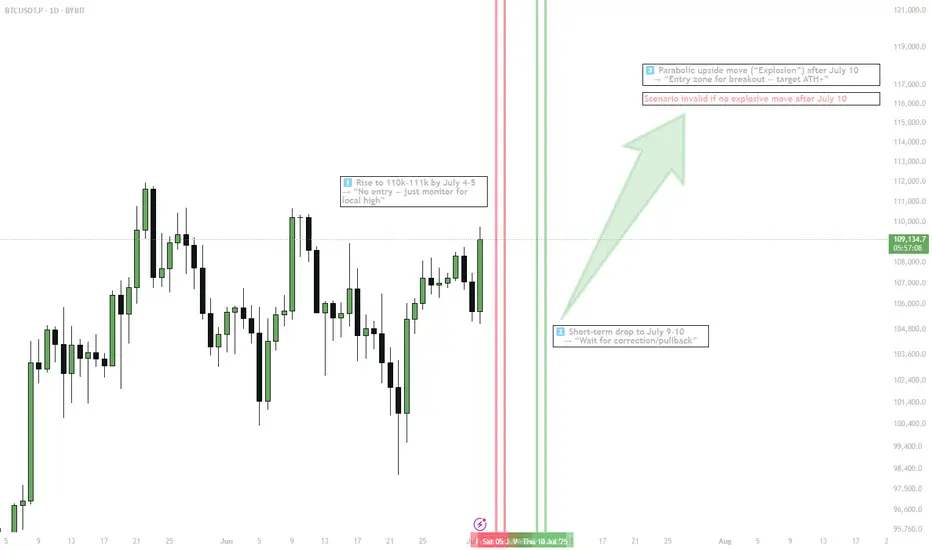
BTC — Harmonic Parabolic Scenario 1. Rise to 110–111k by July 4–5
2. Drop into July 9–10
3. Parabolic move after July 10
4. TP: ATH+
5. Stop: scenario invalid if no breakout
BTC short squeeze in the makingMany people believe that BTC is running "too hot," and we're seeing what appears to be a short squeeze. We all know what's next. No one in their right mind will buy at the top, esp. given it's volatility. Some economic events are right around the corner over the next 1-2 weeks which could impact BTC and S&P. Typically, market rallies are short lived, esp. when the fundamentals are out of whack. Unemployment is cooling (remember is a lagging indicator), high # of bankruptcies, housing unaffordability highest in decades, high interest rates, student loans will start making a dent soon...the list goes on. Don't let the Champagne effect fool you! Berkshire stocking up on cash for a reason.
Best of luck and always do your own DD! Staying positive, with a healthy dose of keeping things real.
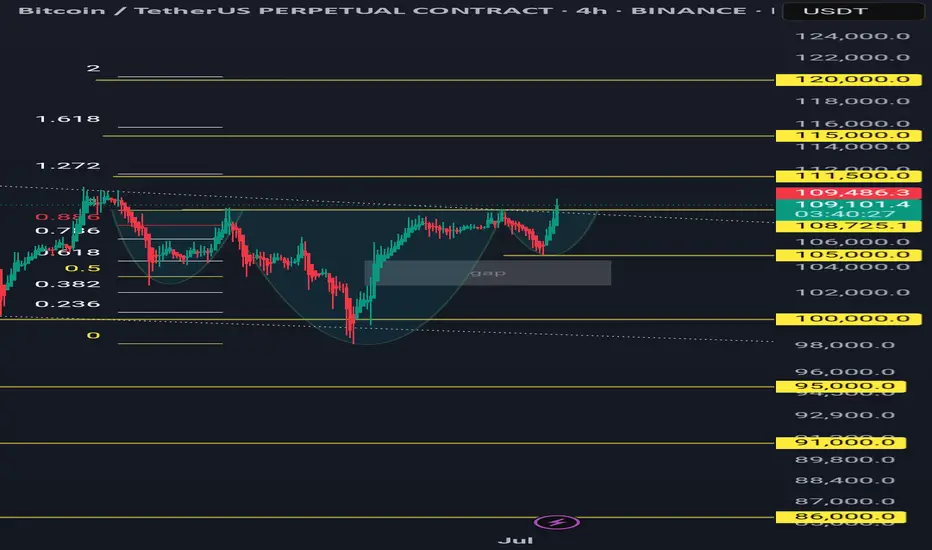
Btcusdt 4hr timeframe, bullish iH&S patternComming from shorters take profit area, formed a bullish ih&s pattern. If closes above 108725 in 4hr time, may activate the pattern.
Targets are 111500, 115000 and 120000
Invalidation if closes below 105k
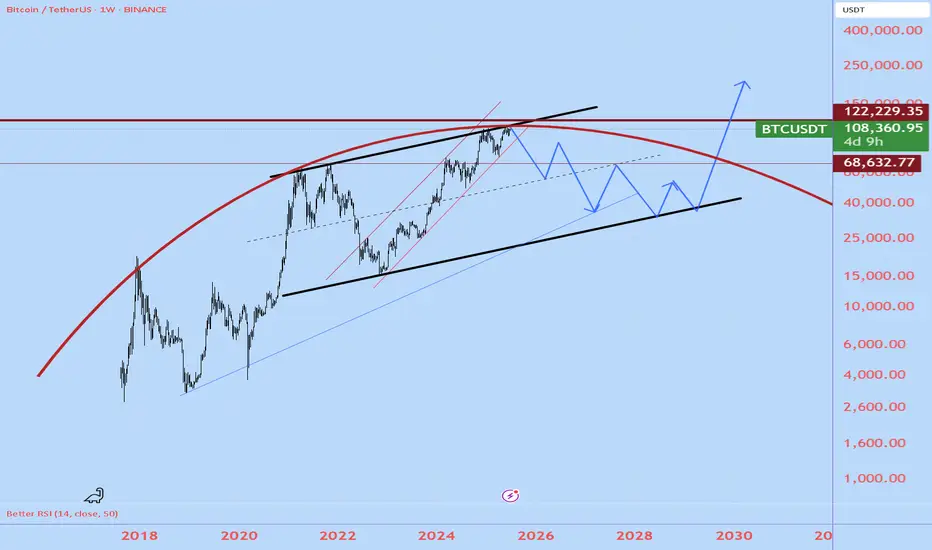
BTCusdtWill BTC go for another 4-year cycle? Everything is possible..
I think the next weeks will be conclusive to see if we can stay in the red channel or will go down.
I believe BTC will reach about 35K, but in a zigzaggy way, giving push to altcoins seasonally.
It is just speculation
BTC SCALP TradeWait for the entry then take with small amount no high risk must use SL. If BTC don't retrace towards 106.5k in coming hours then don't take risk on shorting it will breakout towards 113k
HUGE SHORT ON BTC - SIMPLE AS THATas per title. Don't need to mention, it very easy to know that it will drop.

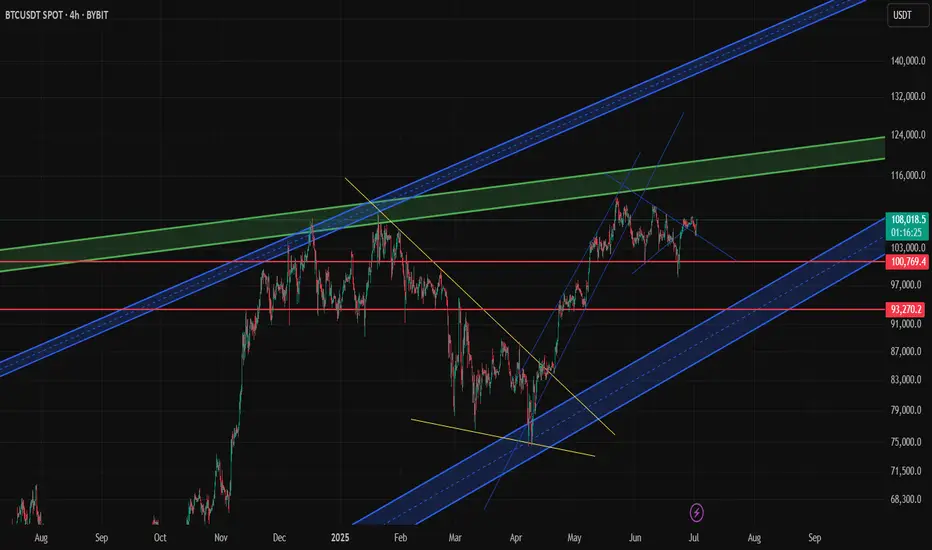
How I Use Bybit Referral Code BY500 for BTC Scalping –Live TradeBTC/USDT – 4H Scalping Setup with Real Price Action Zones & Channel Analysis (Bybit Referral code BY500 Chart) Over the past few weeks, Bitcoin has been moving within a clear ascending channel with multiple pullbacks creating scalp-worthy entries on the 4H timeframe. In this analysis, I’m sharing my current BTC/USDT scalping strategy built around support/resistance, channel breakouts, and confluence zones—all visualized on the chart above.
Current BTC Setup:
BTC is currently trading near $107,800, having bounced from the $100,769 red support line
A potential retest of the descending wedge is underway
The price remains above a critical long-term support zone marked in blue channels, suggesting a bullish mid-term outlook
Why I Use This Strategy
My scalping technique is based on identifying high-probability zones within channel ranges, especially in confluence with long-term trendlines. This strategy is particularly effective when using exchanges with low fees and fast execution.
I personally trade this setup using a platform that offers deep liquidity and competitive trading fees (hint: chart is from that platform). Lower fees = better ROI per scalp, especially in volatile conditions.
Scalping Tools Used:
Channels: To identify swing zones and trend continuation
Volume zones: (Not shown here, but used on execution layer)
Multi-timeframe confluence
Support/Resistance flips
Pro Tip:
If you're an active scalper, always watch for:
Wick rejections at trendlines
Volume surge near breakout
Failing rallies as signs of retracement
usE bYBIT referral Code - BY500
These are all visible in this BTC structure.
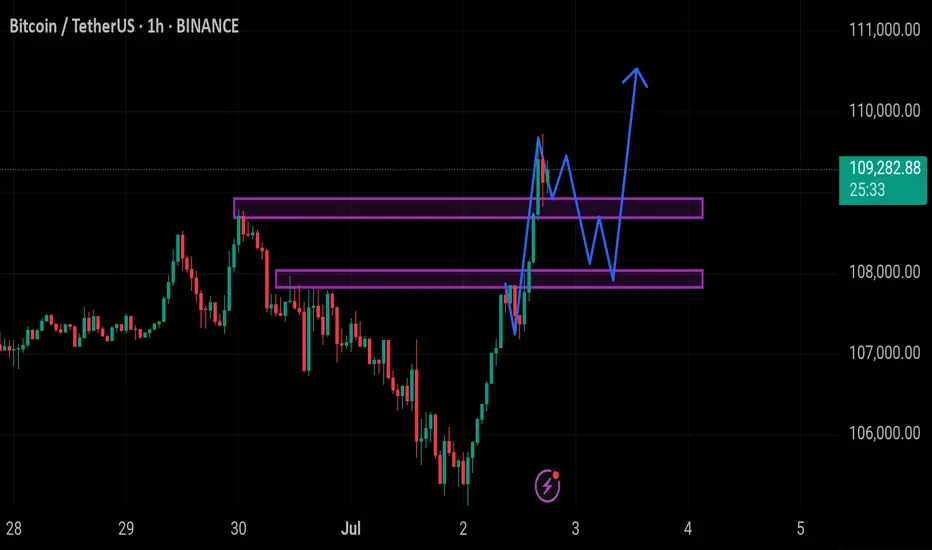
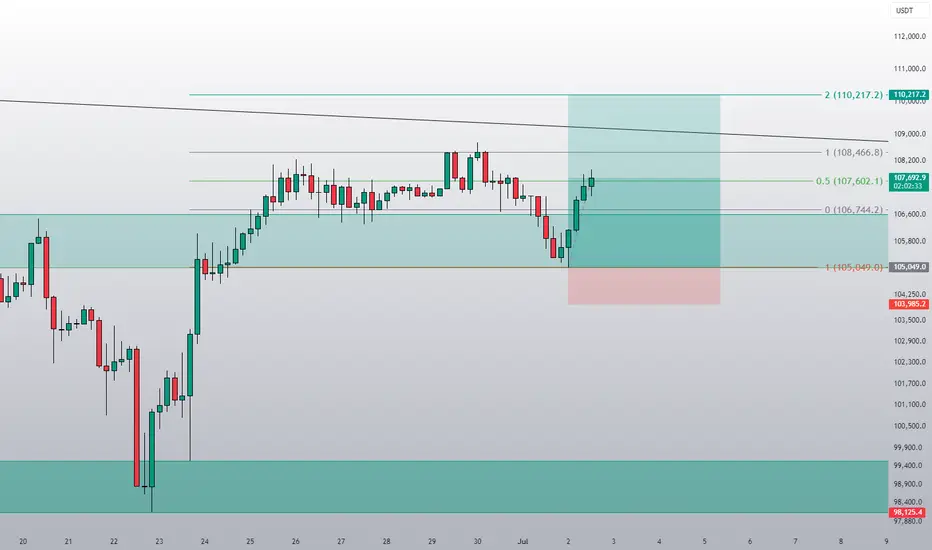
This is exactly how I like it!This is textbook range trading. A break below the range by the same size aligns with the 0.5 Fibonacci level of the entire underlying correction, followed by a bounce back into the range. The next step is to take the 0.5 Fibonacci level of the range itself. If that level is broken, the next target is the upper band of the range. Should that also be breached, we are then aiming for Fibonacci level 2 — or the moon.
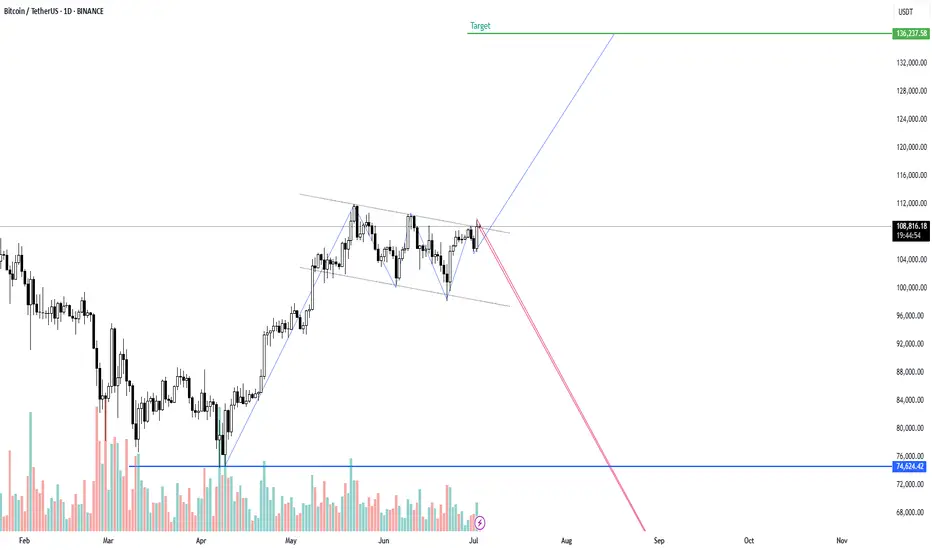
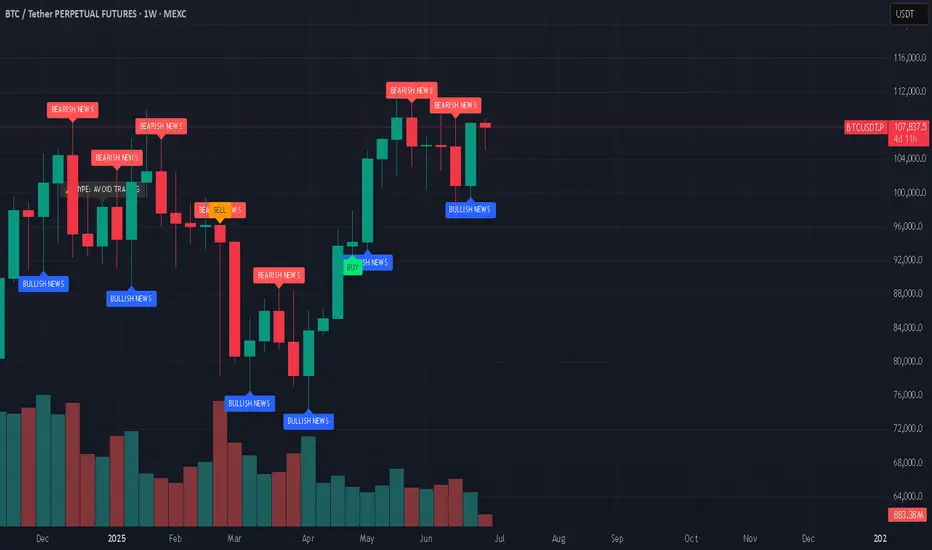
Bitcoin Set to Break All-Time High: Market Consensus Is BullishAs we enter the second half of 2025, Bitcoin (BTC) is on the verge of breaking its all-time high (ATH), with analysts, institutional investors, and market data all pointing toward an imminent surge. The convergence of technical strength, robust institutional inflows, and favorable macro trends is fueling widespread optimism that BTC will soon surpass its previous records.
Key Drivers Behind Bitcoin’s Imminent ATH Breakout
Institutional Investment & ETF Approvals:
The surge in institutional interest, highlighted by record inflows into Bitcoin ETFs and major asset managers ramping up exposure, is a pivotal force behind BTC’s upward momentum. Recent ETF approvals and growing allocations by corporate treasuries are reshaping the liquidity landscape and boosting confidence in Bitcoin as a mainstream asset.
Technical Indicators & Market Structure:
Bitcoin’s price action is consolidating near critical resistance levels ($107,000–$109,000), with technical analysts identifying bullish formations such as the inverted head-and-shoulders pattern. A decisive move above $109,000 is expected to trigger a rapid ascent to new highs, with targets ranging from $112,000 in the short term to as high as $135,000–$200,000 by year-end, according to leading forecasters.
Historical Cycles & Macro Trends:
Unlike previous halving cycles, where corrections followed price spikes, this cycle is marked by sustained demand from ETFs and corporate buyers. Standard Chartered and other major institutions now project BTC to reach $135,000 in Q3 and potentially $200,000 by late 2025, citing a fundamental shift in market dynamics
BUT...A drop to 90k is considered possible before the rally.
#crypto #bitcoin #portfolio #analysis
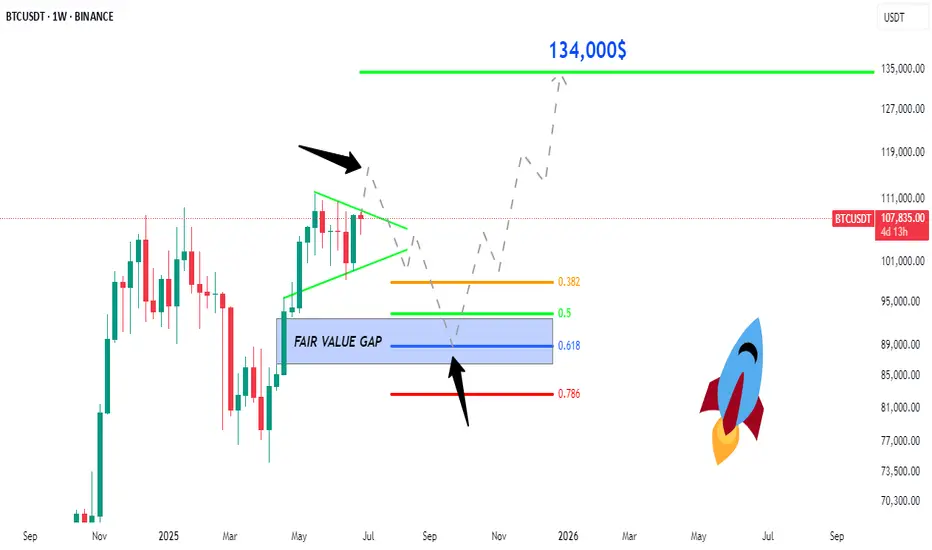
BTC: Price to 134,500$ , FVG, Fib 0.5 and 0.618 ratio ?Price to 134,500$:
Bitcoin is now moving in a triangle pattern, which is getting smaller. The price is around $107,758. Here is possible move is a breakout to the downside first, where the price may drop to fill the "Fair Value Gap" area, which is marked in purple. This area is between the Fibonacci levels of 0.5 and 0.618. After that, Bitcoin could go up again and reach the price of $134,000.
Trade Ideas:
I marked 2 areas with arrow let the price reach here and wait for confirmation in both areas. Specially in Fair Value Gap area.
Trade Signal:
I will provide both trade signal here so follow my account and you can check my previous analysis regarding BITCOIN. So don't miss trade opportunity so follow must.
BINANCE:BTCUSDT BITSTAMP:BTCUSD COINBASE:BTCUSD COINBASE:BTCUSD BINANCE:BTCUSDT.P CRYPTO:BTCUSD BYBIT:BTCUSDT.P BINANCE:BTCUSD