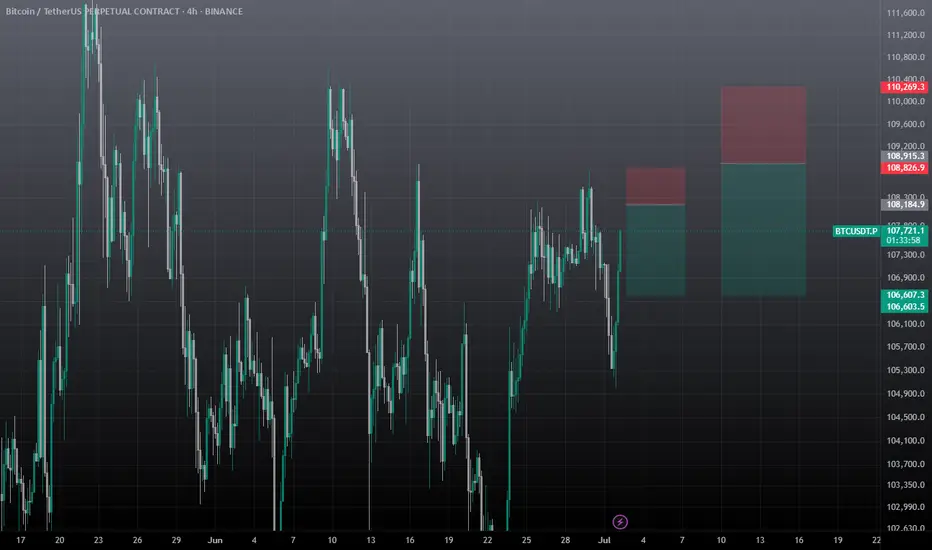
Btcusdt 4hr timeframe, bullish iH&S patternComming from shorters take profit area, formed a bullish ih&s pattern. If closes above 108725 in 4hr time, may activate the pattern.
Targets are 111500, 115000 and 120000
Invalidation if closes below 105k
BTCUSDT.PS trade ideas
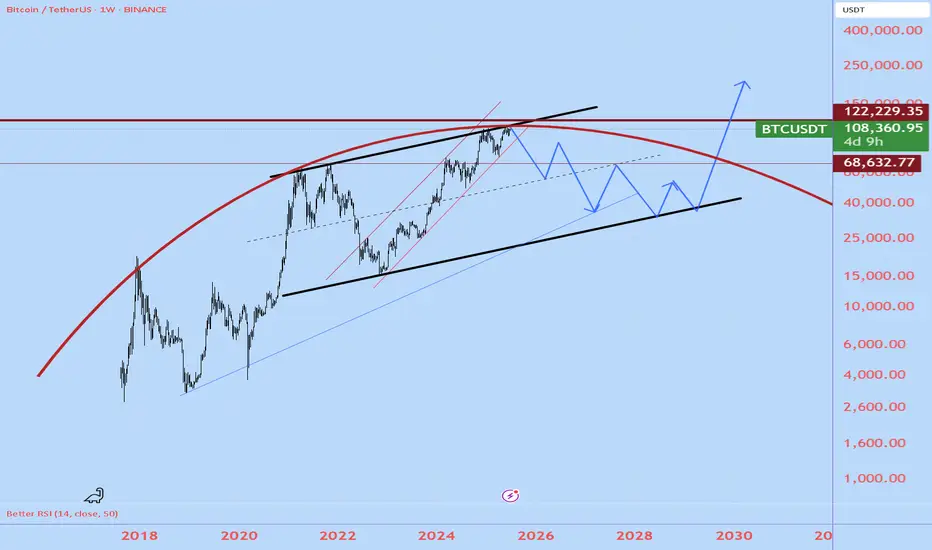
BTCusdtWill BTC go for another 4-year cycle? Everything is possible..
I think the next weeks will be conclusive to see if we can stay in the red channel or will go down.
I believe BTC will reach about 35K, but in a zigzaggy way, giving push to altcoins seasonally.
It is just speculation
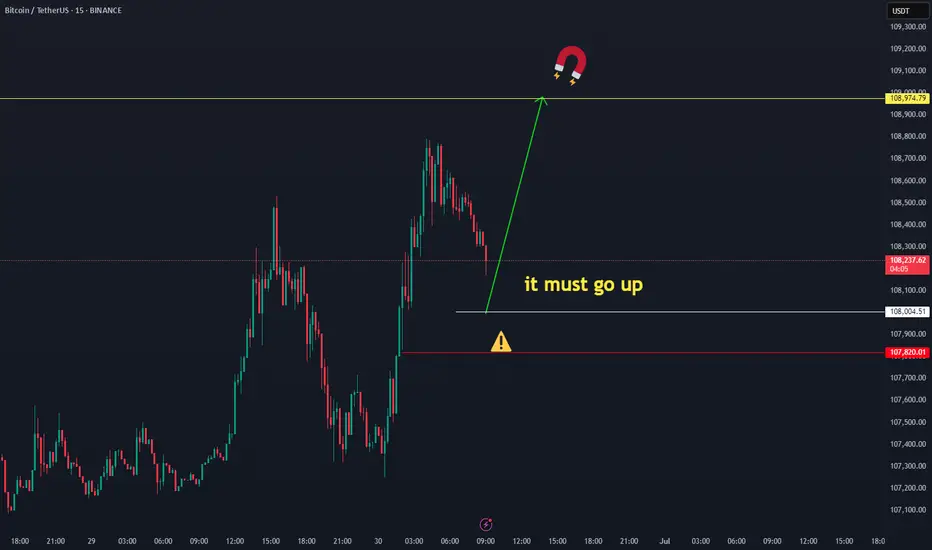
BTC SCALP TradeWait for the entry then take with small amount no high risk must use SL. If BTC don't retrace towards 106.5k in coming hours then don't take risk on shorting it will breakout towards 113k
HUGE SHORT ON BTC - SIMPLE AS THATas per title. Don't need to mention, it very easy to know that it will drop.

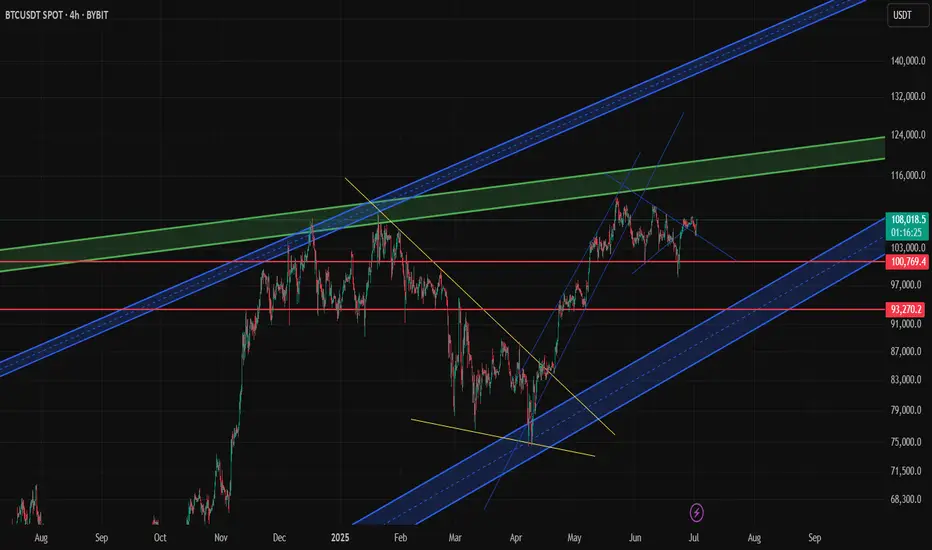
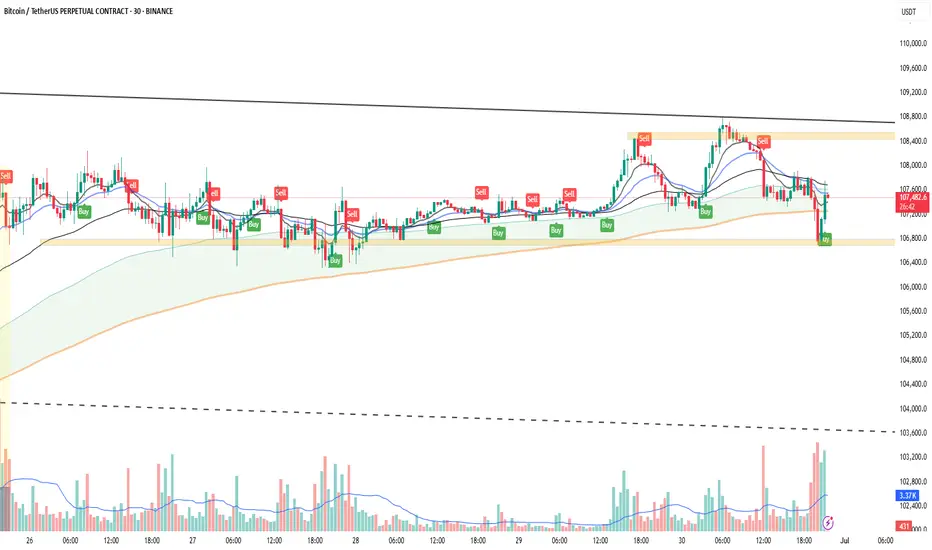
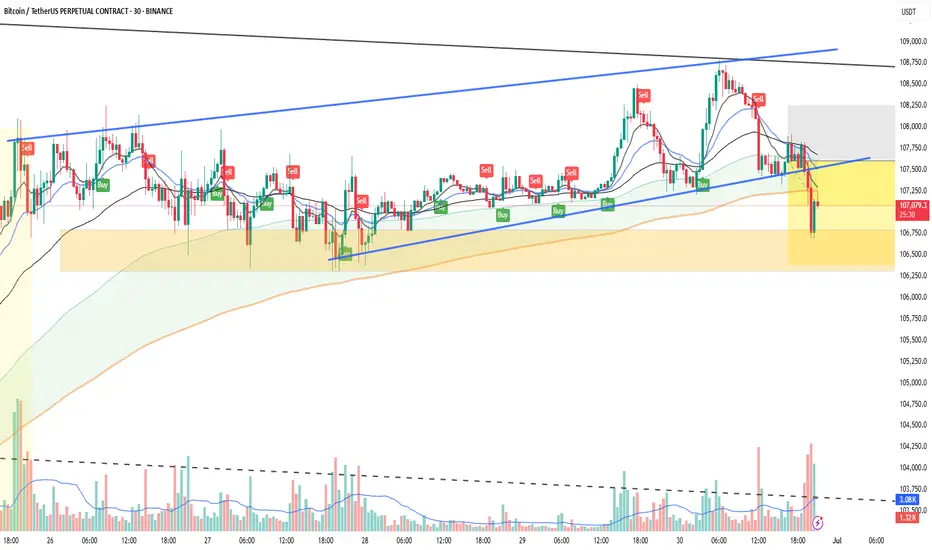
How I Use Bybit Referral Code BY500 for BTC Scalping –Live TradeBTC/USDT – 4H Scalping Setup with Real Price Action Zones & Channel Analysis (Bybit Referral code BY500 Chart) Over the past few weeks, Bitcoin has been moving within a clear ascending channel with multiple pullbacks creating scalp-worthy entries on the 4H timeframe. In this analysis, I’m sharing my current BTC/USDT scalping strategy built around support/resistance, channel breakouts, and confluence zones—all visualized on the chart above.
Current BTC Setup:
BTC is currently trading near $107,800, having bounced from the $100,769 red support line
A potential retest of the descending wedge is underway
The price remains above a critical long-term support zone marked in blue channels, suggesting a bullish mid-term outlook
Why I Use This Strategy
My scalping technique is based on identifying high-probability zones within channel ranges, especially in confluence with long-term trendlines. This strategy is particularly effective when using exchanges with low fees and fast execution.
I personally trade this setup using a platform that offers deep liquidity and competitive trading fees (hint: chart is from that platform). Lower fees = better ROI per scalp, especially in volatile conditions.
Scalping Tools Used:
Channels: To identify swing zones and trend continuation
Volume zones: (Not shown here, but used on execution layer)
Multi-timeframe confluence
Support/Resistance flips
Pro Tip:
If you're an active scalper, always watch for:
Wick rejections at trendlines
Volume surge near breakout
Failing rallies as signs of retracement
usE bYBIT referral Code - BY500
These are all visible in this BTC structure.
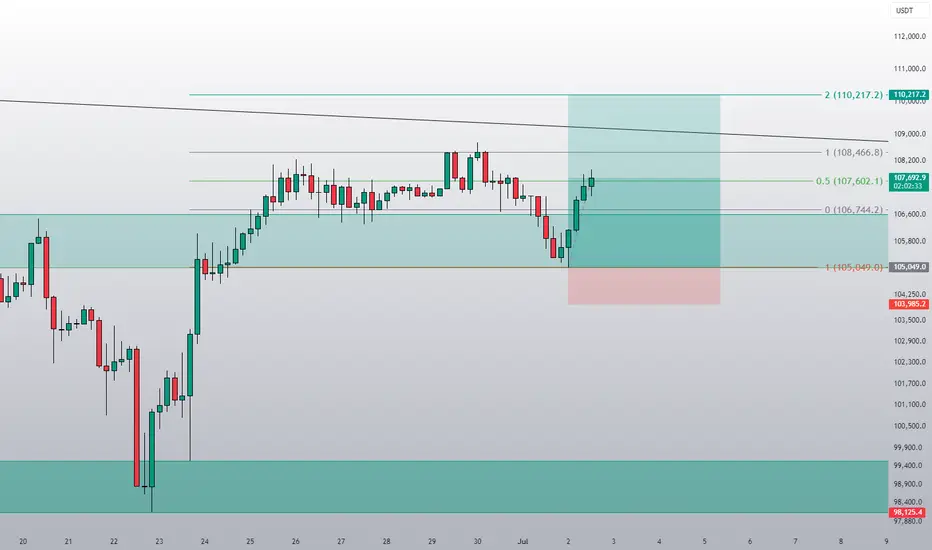
This is exactly how I like it!This is textbook range trading. A break below the range by the same size aligns with the 0.5 Fibonacci level of the entire underlying correction, followed by a bounce back into the range. The next step is to take the 0.5 Fibonacci level of the range itself. If that level is broken, the next target is the upper band of the range. Should that also be breached, we are then aiming for Fibonacci level 2 — or the moon.
Bitcoin Set to Break All-Time High: Market Consensus Is BullishAs we enter the second half of 2025, Bitcoin (BTC) is on the verge of breaking its all-time high (ATH), with analysts, institutional investors, and market data all pointing toward an imminent surge. The convergence of technical strength, robust institutional inflows, and favorable macro trends is fueling widespread optimism that BTC will soon surpass its previous records.
Key Drivers Behind Bitcoin’s Imminent ATH Breakout
Institutional Investment & ETF Approvals:
The surge in institutional interest, highlighted by record inflows into Bitcoin ETFs and major asset managers ramping up exposure, is a pivotal force behind BTC’s upward momentum. Recent ETF approvals and growing allocations by corporate treasuries are reshaping the liquidity landscape and boosting confidence in Bitcoin as a mainstream asset.
Technical Indicators & Market Structure:
Bitcoin’s price action is consolidating near critical resistance levels ($107,000–$109,000), with technical analysts identifying bullish formations such as the inverted head-and-shoulders pattern. A decisive move above $109,000 is expected to trigger a rapid ascent to new highs, with targets ranging from $112,000 in the short term to as high as $135,000–$200,000 by year-end, according to leading forecasters.
Historical Cycles & Macro Trends:
Unlike previous halving cycles, where corrections followed price spikes, this cycle is marked by sustained demand from ETFs and corporate buyers. Standard Chartered and other major institutions now project BTC to reach $135,000 in Q3 and potentially $200,000 by late 2025, citing a fundamental shift in market dynamics
BUT...A drop to 90k is considered possible before the rally.
#crypto #bitcoin #portfolio #analysis
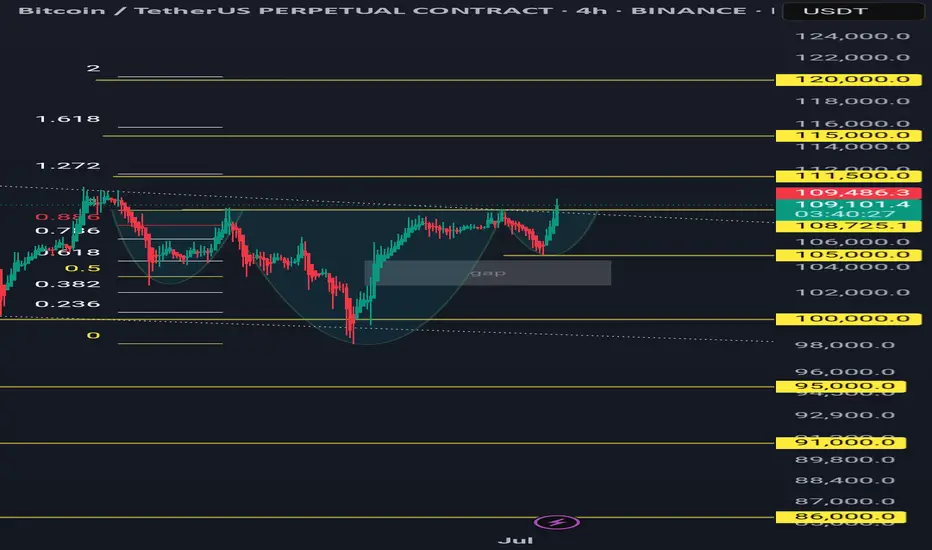
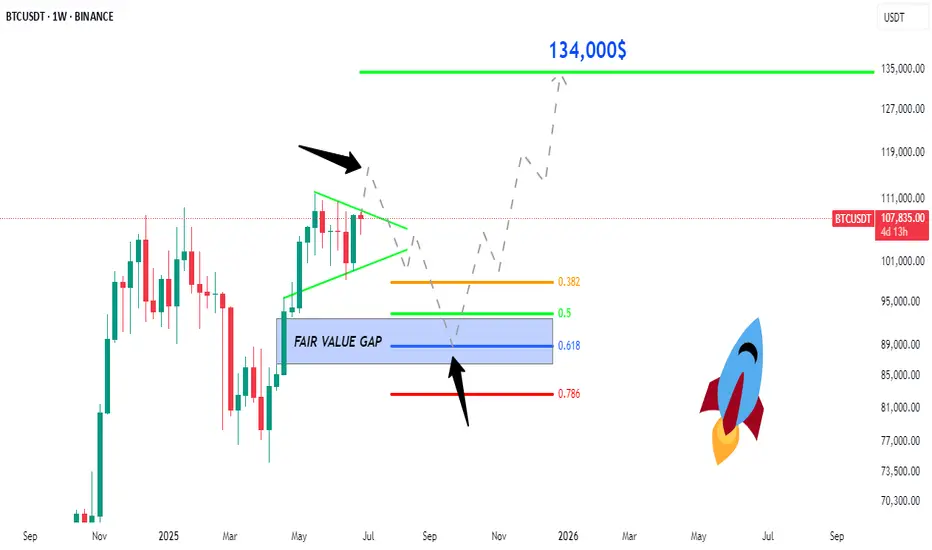
BTC: Price to 134,500$ , FVG, Fib 0.5 and 0.618 ratio ?Price to 134,500$:
Bitcoin is now moving in a triangle pattern, which is getting smaller. The price is around $107,758. Here is possible move is a breakout to the downside first, where the price may drop to fill the "Fair Value Gap" area, which is marked in purple. This area is between the Fibonacci levels of 0.5 and 0.618. After that, Bitcoin could go up again and reach the price of $134,000.
Trade Ideas:
I marked 2 areas with arrow let the price reach here and wait for confirmation in both areas. Specially in Fair Value Gap area.
Trade Signal:
I will provide both trade signal here so follow my account and you can check my previous analysis regarding BITCOIN. So don't miss trade opportunity so follow must.
BINANCE:BTCUSDT BITSTAMP:BTCUSD COINBASE:BTCUSD COINBASE:BTCUSD BINANCE:BTCUSDT.P CRYPTO:BTCUSD BYBIT:BTCUSDT.P BINANCE:BTCUSD
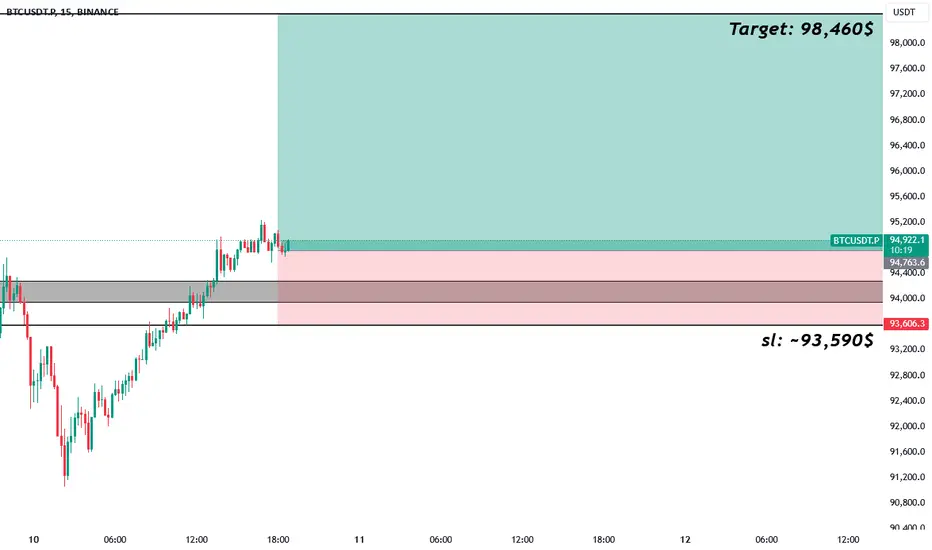
BTCUSD | 89.99%++ Accuracy Trade | Bitcoin AnalysisThe trade has a defined risk-to-reward structure, with the stop-loss (SL) set at approximately $93,590 to manage downside risk. The target is clearly identified at $98,460, suggesting a potential breakout toward higher levels. The highlighted support and resistance areas provide context for price action, signaling a continuation of the bullish trend if the support holds.
BINANCE:BTCUSDT
90% confidence by TiqGPT Analyzing the provided charts for Bitcoin against Tether (BTC/USDT) across multiple timeframes, we observe a consistent upward momentum, indicating a strong bullish sentiment. Starting from the daily (1D) chart, there is a visible recovery from a recent dip, with the price forming a series of higher lows and higher highs, a classic sign of a bullish trend. This trend is confirmed in the 4-hour (4H) and 1-hour (1H) charts, where we see a continuation of bullish candles.
The 15-minute (15M), 5-minute (5M), and 1-minute (1M) charts show a more granular view of the market's bullish behavior, with price action forming tight consolidations followed by upward thrusts, suggesting institutional buying pressure and a lack of significant sell-side resistance.
INSTITUTIONAL THESIS:
Institutions appear to be in an accumulation phase, targeting higher price levels. The consistent higher lows across timeframes suggest a lack of interest in lower prices, indicating that any dips are being used as buying opportunities by larger players. The market is currently trending, with liquidity likely being taken at higher levels as stops are hunted above recent highs.
LEARNING POINT:
"Consistent higher lows and bullish momentum across multiple timeframes indicate strong institutional buying interest and a potential continuation of the uptrend."
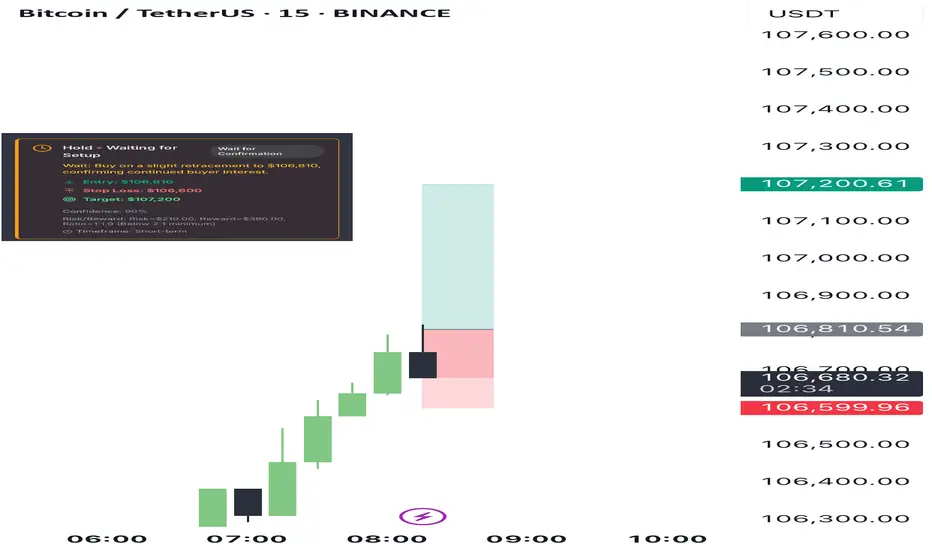
SIGNAL: WAIT
SYMBOL: BTC/USDT
ENTRY PRICE: $106,810
STOP LOSS: $106,600
TARGET PRICE: $107,200
CONDITION: Buy on a slight retracement to $106,810, confirming continued buyer interest.
RATIONALE: Calculated risk/reward ratio of 1:1.9 (Risk=$210.00, Reward=$390.00) does not meet minimum 2:1 requirement. Waiting for better institutional setup with improved risk parameters.
Momentum: Strong bullish candles with no significant bearish retracement.
Liquidity: Potential liquidity above recent highs around $107,200.
Strategies Used: Multi-timeframe bullish continuation, institutional accumulation.
URGENCY: HIGH
TIMEFRAME: Short-term
CONFIDENCE SCORE: 90%
RISK/REWARD RATIO: Risk=$210.00, Reward=$390.00, Ratio=1:1.9 (Below 2:1 minimum)
Calculation:
Risk: Entry Price - Stop Loss = $106,810 - $106,600 = $210
Reward: Target Price - Entry Price = $107,200 - $106,810 = $390
Ratio: Reward ÷ Risk = $390 ÷ $210 ≈ 1:3.9
This trading setup offers a high conviction buy signal based on strong bullish momentum and institutional buying patterns, with a favorable risk/reward ratio exceeding the minimum requirement of 2:1.
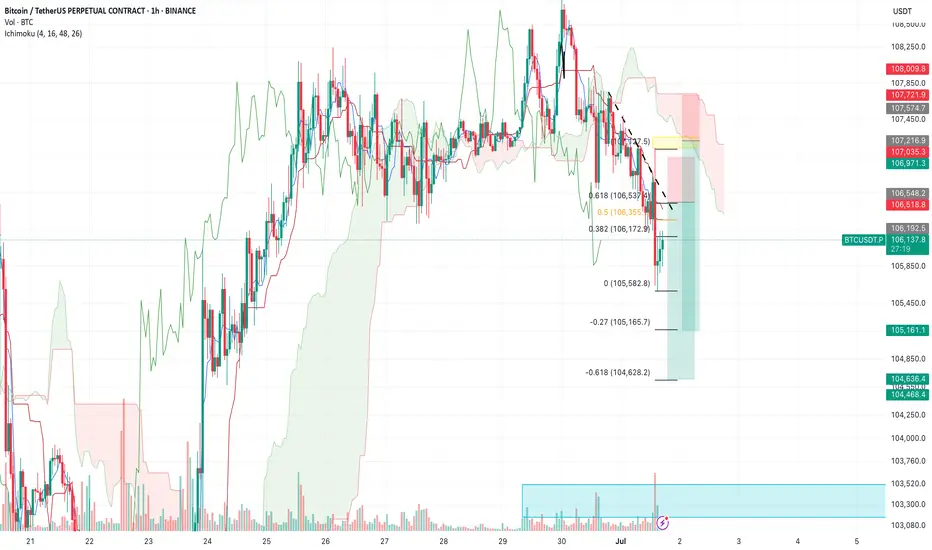
BTC/USDT – Intraday Plan & Reflections (15m, Ichimoku) by RiscorReflections on the previous trade:
Yesterday’s short setup played out: we reached the targeted downward block, as expected. However, price didn’t bounce to the 108000 level (untapped area), leaving a liquidity gap that isn’t great for bears. This means we might revisit and fill that zone in the future.
Today’s context:
A strong sell-off and the untapped 108,000 zone make things uncertain, especially when looking to avoid getting trapped in countertrend longs.
Currently, I see two main short setups:
Scenario 1: Short from 106,550 (correction entry)
Entering on a pullback to 106,550 as a correction within the current bearish move.
Targeting a drop towards the 1.618 retracement of the last impulse, aiming for the lower blue zone (bottom of the cloud on H4).
This is the primary short if the correction materializes without breaking the highs.
Scenario 2: Short from yellow block (liquidity grab fakeout)
If price sweeps above and takes liquidity at the yellow block (marked by cluster of stop-losses), I’ll short from that fakeout.
Stop-loss as shown on the chart. Targeting the 0.27 fib of the previous impulse.
For this trade, I want to see a sharp rejection and heavy sell-off from the yellow zone.
If price consolidates above 107,200 (a couple of 1H closes), this is a red flag and I’ll exit manually.
In that case, expecting a move to 108,000 to fill the previous imbalance, before looking for renewed downside.
Key notes:
Context is highly uncertain today, multiple possible outcomes.
For now, I’m favoring the second scenario, but scenario one remains valid if the correction plays out as described.
Watching price action and volume closely for clues.
#BTC #Crypto #Trading #Ichimoku #Riscora
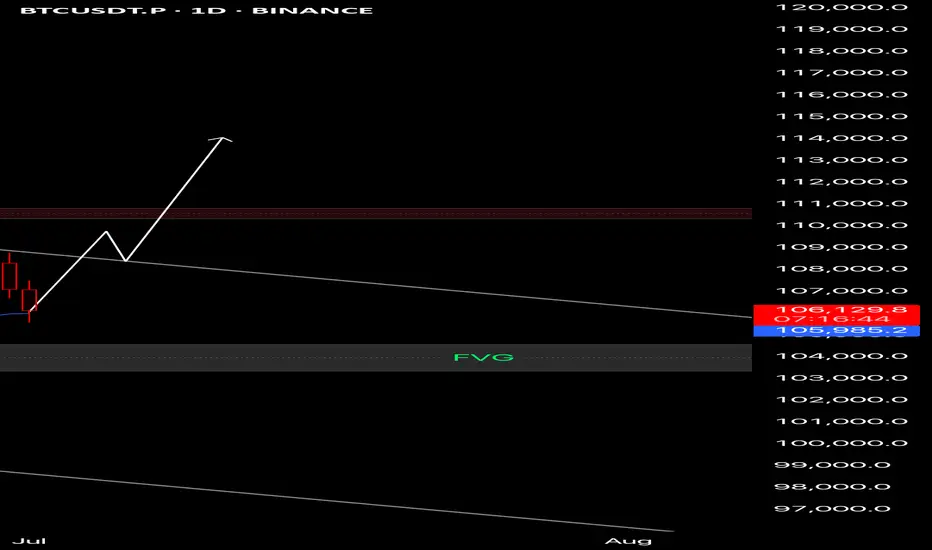
BTC 1D Analysis📊 BTC 1D Analysis
Price is respecting the channel and currently holding the 21 EMA as dynamic support.
If we see a strong daily close above the descending resistance, it may trigger a breakout toward the $110,000–$112,000 zone.
Key levels:
🔹 Support: $105,980
🔹 Resistance: $110,800
Bias: Bullish if breakout confirms
Watch the next 1–2 candles for confirmation.
🔔 Set alerts – don’t chase!
#BTC #Bitcoin #CryptoAnalysis #TradingView #CryptoSignals #DYOR
BTC losing its shine all over again.In previous charts I already called this might be the blow of top. Someone might say but bitcoin haven't finish its cycle, this is true but the economic situation is not favorable for any market to pump.
Another one is all whales, market makers and institutions knows 100% that if the market pumps one more time they will most likely dump because the market is already weak as it is, one more push will attract new money yes but retail buys of $200 are not enough to support the liquidity that is being hold above.
So we might see a reversal from 103k which is the bottom of the pennant to retry resistance once again, this time I would say 108-110k will be the resistance., Rejecting below that point will set BTC for a drop to the 95-98k once again.
I want to say BTC will most likely test the 80s again but let's not get too far away, Let's see how it does at 103k first, then if it holds then we know that it will reverse to the 108k area.
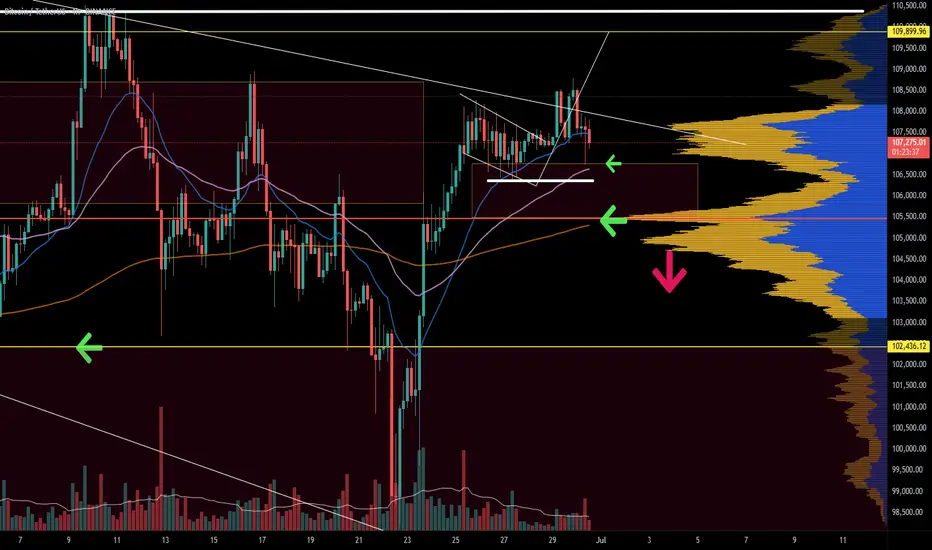
BTCUSDT 4H/1D | Macro Rejection + Event WatchBTC got rejected again at macro trendline (~108.5K)
Multiple lower highs → selling pressure confirmed
4H breakdown from compression with volume spike
Now hovering near 106.5K — key support
🔻 Below 106.2K = clean short trigger → 104.4K–102.5K
✅ Reclaim above 108.2K flips bias bullish
⚡ Market Context
Large treasury interest building (institutional buying signs)
Recent $40B options expiry adds volatility at key levels
Renewed institutional participation visible across platforms
Bias: Bearish below 107.2K. Structure and volume support downside.
Watch for July trend confirmation post-event digestion.
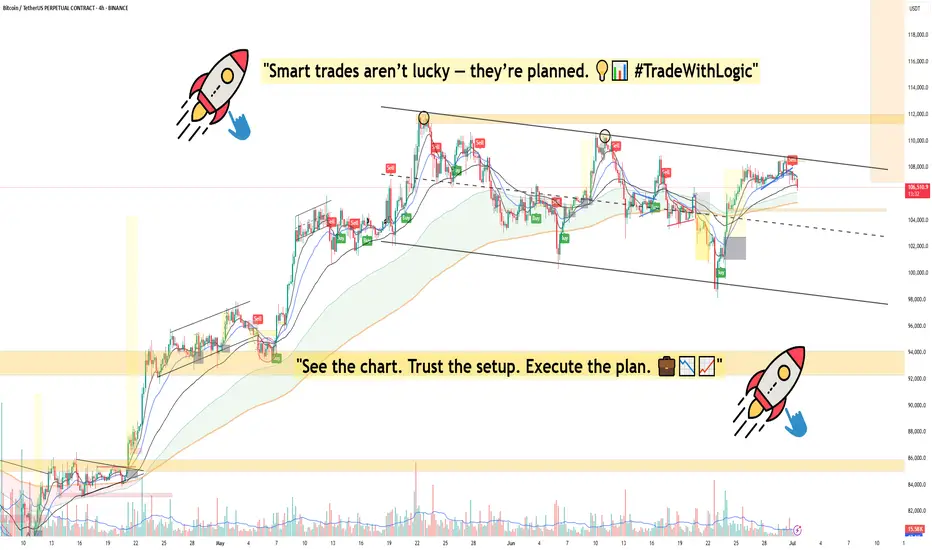
“Smart trades aren’t lucky — they’re planned.”
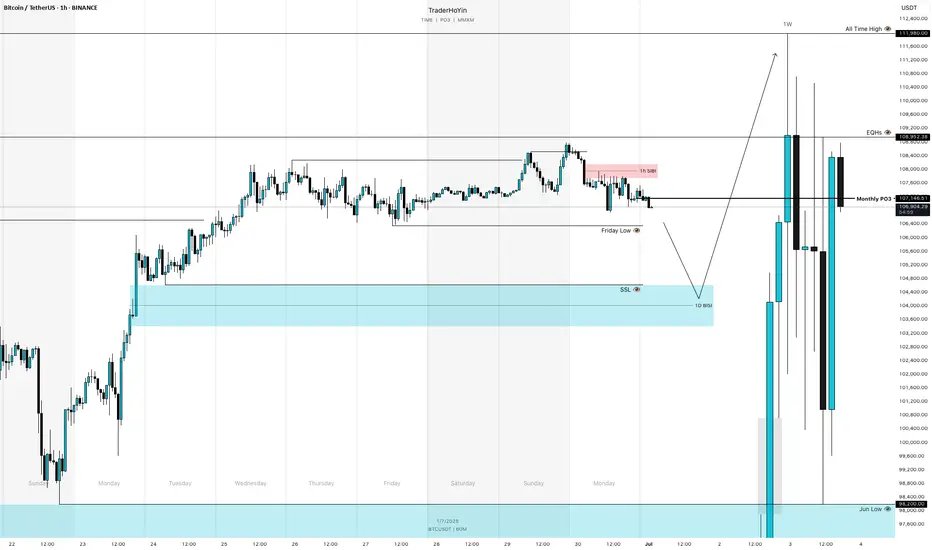
BTC - New month, new monthly Power Of ThreeNew monthly Power Of Three:
4 weekly candles to form a monthly candle.
So there will be 4 weekly PO3 within 1 monthly PO3.
Accumulation => Manipulation => Expansion
I anticipate the first week there should be a accumulation phase.
Determine the previous dealing range to find out the premium and discount range.
Short term trades back into the discount range and long term continues higher.
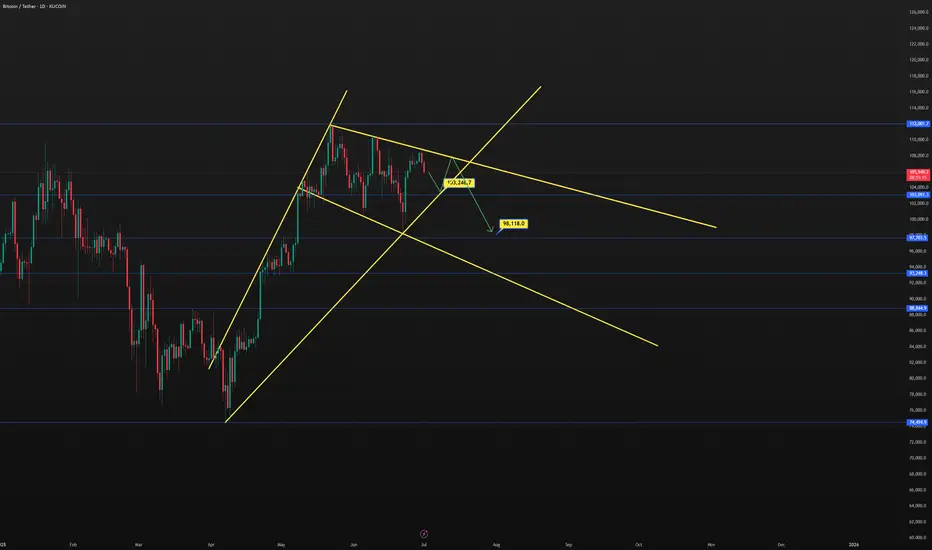
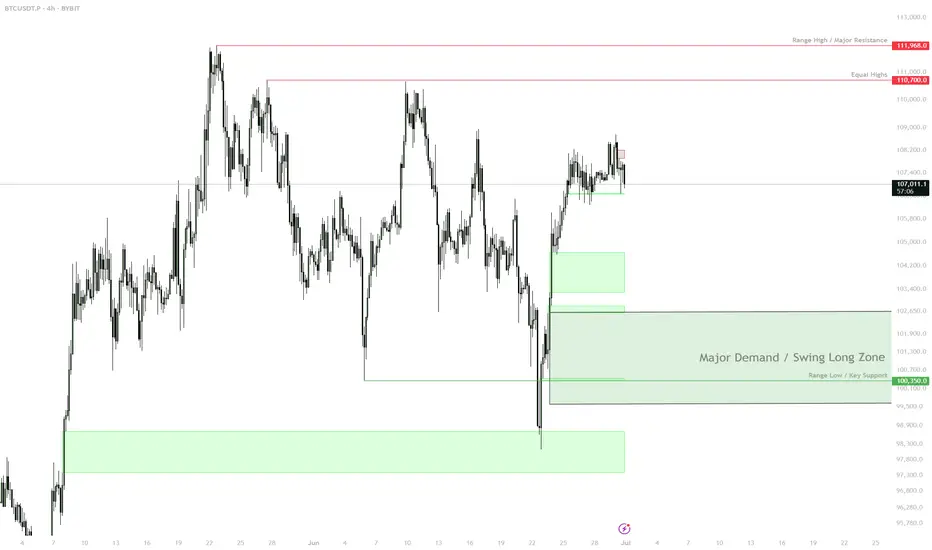
BTC — ATH or Lower High? Patience for the Next SwingBINANCE:BTCUSDT | 4h
Patience here — waiting for the next high-probability swing.
Major levels to watch: $111,990 (range high), $108,950 (weekly), $100,300–103,000 (demand).
Next move: ATH attempt or another lower high? Will act when the reaction sets up.
BTC needs to hold up here. BTC is at a very important level. A role over is expected, but without market structure confirmation, it's important to consider the possibility of a move up. The bearish thesis on lower timeframes is the easy one. Ensure your bullish thesis is also considered. A confirmed lower low or a lower high would confirm a CHOCH reversal.
Full TA: Link in the BIO
BTCUSDT| Bounce from Channel SupportBTC just bounced cleanly off mid-channel support (~106.8K) within the descending structure.
Held above EMAs and reclaimed key short-term support.
If price holds above 107.2K → likely retest of 108.4K channel resistance.
Break and close above 108.5K = trendline breakout → 110K+ possible.
Break below 106.8K = failed bounce → 105.5K next demand.
Bias: Bullish while holding above 107.2K.
30-Minute Chart – Rising Wedge BreakdownBreakdown from 30m rising wedge confirmed with volume. Retest at 107.5K failed. Price now under EMAs.
4H also broke rising channel → rejection from 108.4K.
Key support: 106.4K.
Break below = 105.2K target.
Reclaim 107.5K = upside risk to 108.8K+.
Bias: Bearish below 107.5K.
Volume confirms move.
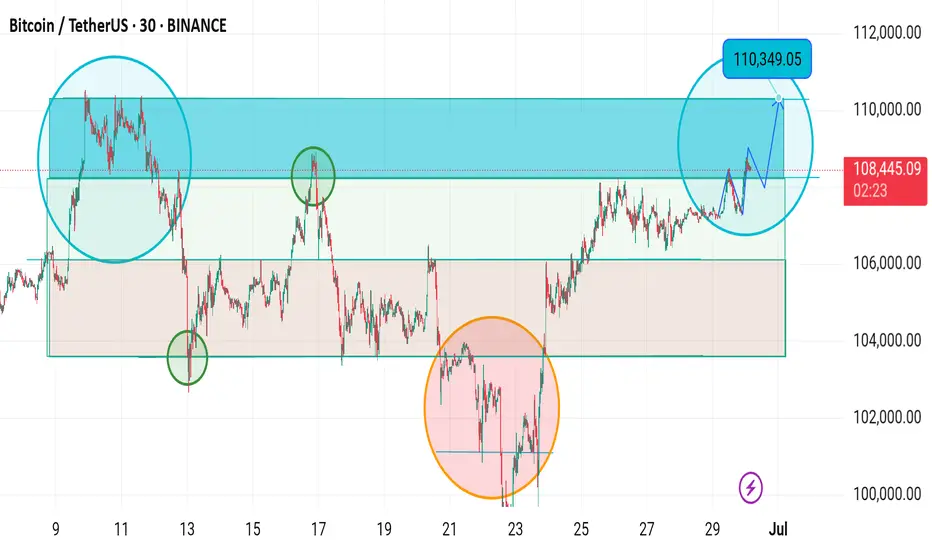
BTC Breakout Imminent – Targeting $110,349🕒 Timeframe: 30-Minute Chart
📈 Current Price: $108,425
🎯 Projected Target: $110,349
---
🔍 Chart Zones & Key Levels:
🔷 Blue Resistance Zone (~108,500 - 110,500)
Price is currently approaching the top of this range.
Historically, price rejected strongly from this area (left blue circle).
This zone has acted as major supply, but now price is retesting with bullish momentum.
🟢 Green Circles – Key Reaction Points
The first green circle marks a strong bounce from previous support (~106,000).
Second green circle shows resistance rejection, indicating it's a key pivot level.
🔶 Orange Zone (~104,000 - 106,500)
This acted as a demand zone during the correction (middle of the chart).
Price formed a double bottom within this zone, signaling bullish reversal (orange circle).
---
📊 Structure & Pattern:
Consolidation breakout from a horizontal range.
Forming higher highs and higher lows, showing bullish structure.
The blue arrow path shows expected price movement:
Minor pullback
Followed by breakout towards $110,349 target
---
🧠 Market Sentiment:
Strong accumulation near $106,000 suggests buyers are in control.
Price is gradually grinding higher into resistance with volume increasing (implied).
---
🧭 Conclusion:
Bias: Bullish
Entry Zone: Dips near $107,800–$108,000
Target: $110,349
Invalidation: Break below $106,500
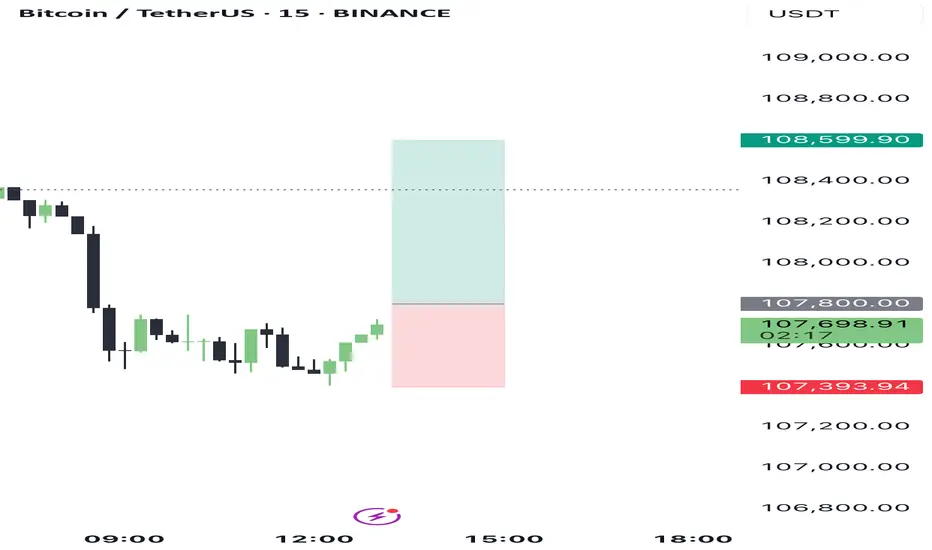
Bitcoin/TiqGPT Setup1D Timeframe: The daily chart shows a bullish momentum with recent green candles indicating a strong upward push. The price is currently near the high of the recent range, suggesting potential resistance or profit-taking levels.
4H Timeframe: The 4-hour chart reveals a more detailed view of the bullish momentum. There are signs of a pullback with the latest candle forming a small body, which could indicate a temporary exhaustion in buying pressure.
1H Timeframe: On the hourly chart, the price action shows a sharp decline followed by a recovery, indicating a volatility spike. This could be a reaction to a liquidity grab below prior lows, which is a common institutional maneuver to eliminate stop-loss orders before a directional move.
15M Timeframe: The 15-minute chart displays a recovery phase with the price moving upward steadily, suggesting that the earlier drop was likely a liquidity sweep.
5M Timeframe: This timeframe shows continued upward movement with consistent green candles, supporting the recovery narrative seen in the 15M chart.
1M Timeframe: The 1-minute chart shows a very granular view of the bullish momentum. The consistent upward ticks suggest strong buying interest at these levels, possibly from retail following the institutional cue.
INSTITUTIONAL THESIS:
Institutions appear to be in a phase of accumulation after a liquidity sweep, as evidenced by the sharp drop and subsequent recovery. The goal seems to be to push the price higher after successfully capturing liquidity below recent lows.
LEARNING POINT:
"1H Liquidity Sweep followed by a 15M and 5M bullish recovery indicating institutional buying pressure."
SIGNAL: BUY
SYMBOL: BTC/USDT ENTRY PRICE: $107,800 STOP LOSS: $107,400 TARGET PRICE: $108,600 CONDITION: Buy limit order post-1M confirmation of continued bullish momentum. RATIONALE: The setup aligns with a liquidity sweep followed by a bullish recovery across multiple timeframes, indicating strong buying interest. The entry is set above the current 1M high to ensure momentum continuation, with a stop placed just below the recent 1H low to minimize exposure to another potential liquidity sweep. STRATEGIES USED: Liquidity Sweep Recovery, Multi-Timeframe Bullish Alignment URGENCY: HIGH TIMEFRAME: Short-term CONFIDENCE SCORE: 85% RISK/REWARD RATIO: Calculated as follows:
Risk: $107,800 (Entry) - $107,400 (Stop) = $400
Reward: $108,600 (Target) - $107,800 (Entry) = $800
Ratio: 800 / 400 = 2:1
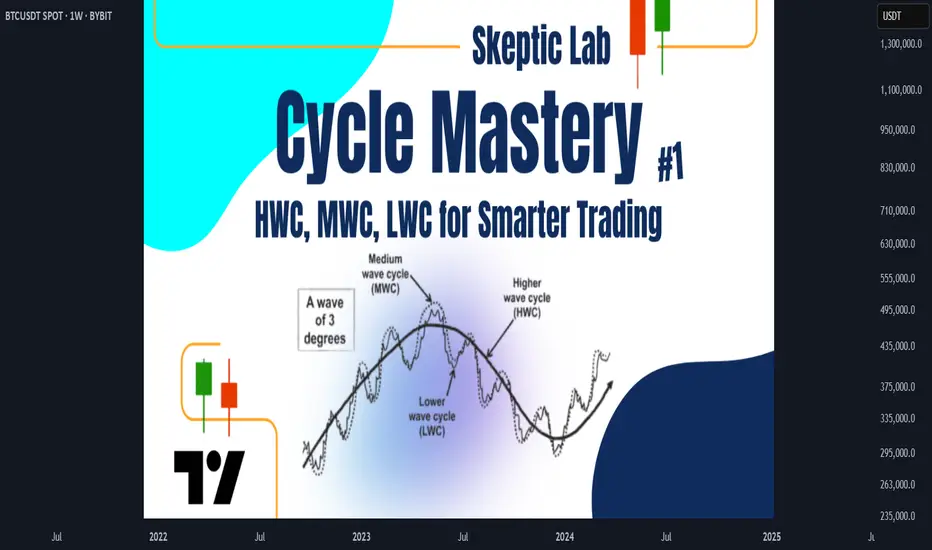
Skeptic| Cycle Mastery Part 1: HWC, MWC, LWC for Smarter TradingUnderstanding Higher Wave Cycle ( HWC ), Minor Wave Cycle ( MWC ), and Low Wave Cycle ( LWC ) is the key to making informed trading decisions, simplifying when to go long , short , or stay out . This Part 1 masterclass introduces these cycles, their relative nature, and how to align them with your strategy for precise entries and effective risk management . Let’s break it down. 📊
The Three Cycles: HWC, MWC, LWC
We trade across three market cycles:
HWC (Higher Wave Cycle) : The big-picture trend, like Bitcoin’s yearly uptrend.
MWC (Minor Wave Cycle): A medium-term trend, often an uptrend or corrective phase within the HWC.
LWC (Low Wave Cycle): The short-term daily trend, which can be range-bound, uptrend, or downtrend.
Knowing these cycles helps you decide when to e nter long, short, or avoid trading altogether, ensuring you align with the market’s rhythm.
Defining Your Cycles: It’s Relative
The main question before diving in: What timeframes are HWC, MWC, and LWC? The answer is relative—it depends on your strategy. Think of it like a temperature scale: 0°C isn’t “no heat” but a reference point (water’s freezing point). Similarly, your cycles are defined by the largest timeframe you analyze:
HWC: Your highest timeframe (e.g., Weekly for long-term traders).
MWC: The next level down (e.g., Daily).
LWC: Your shortest timeframe (e.g., 4-Hour or 1-Hour).
Ask yourself: What’s the largest timeframe I check? Set your HWC there, then scale down for MWC and LWC based on your trading style. This relativity ensures your cycles fit your unique approach.
While shorter cycles (LWC, MWC) form the HWC, the HWC’s power dominates, influencing smaller cycles. Let’s explore how to trade based on these relationships.
Trading Scenarios: When to Act
Scenario 1: HWC Uptrend, MWC Range
When the HWC is in an uptrend and the MWC is range-bound:
Action: Enter a long position on the first MWC wave when the LWC breaks the ceiling of the MWC range (e.g., a box breakout).
Why? The HWC’s bullish power supports the move, likely triggering an MWC uptrend. This makes the first wave a strong, low-risk entry.
Example: If the LWC (e.g., 4-hour) breaks the MWC range ceiling with a strong candle, you can confidently go long, backed by the HWC uptrend.
Scenario 2: HWC Downtrend, MWC Range
When the HWC is in a downtrend and the MWC is range-bound:
Action: Skip the first MWC wave. If the LWC breaks the MWC range ceiling, avoid going long—the bearish HWC could reject the move, resuming its downtrend.
Wait for the Second Wave: Let the MWC return to a range after the first wave. If the LWC breaks the range ceiling again, go long with confidence—the HWC’s influence is less likely to disrupt this second wave.
Risk Management Tips (if you trade the first wave against the HWC):
Reduce Risk: Lower your position size to minimize exposure.
Take Profits Early: Close the position or secure most profits (e.g., scale out) once you hit your R/R target, as volatility is high.
Wider Stop-Loss: Set a larger stop-loss to account for potential HWC-driven reversals, as stop-loss hunts are common in this scenario.
Adjusting Stop-Loss Size Based on Cycles
Aligned Cycles (HWC, MWC, LWC in Same Direction): When all three cycles align (e.g., all uptrend), set a tighter stop-loss relative to market conditions. Gradually scale out profits instead of closing the position, as the trend’s strength supports higher R/R (e.g., 5 or 10).
HWC Against MWC/LWC: If the HWC opposes the other cycles (e.g., HWC downtrend, MWC/LWC uptrend), use a wider stop-loss. The HWC’s power could reverse the LWC, lowering your win rate if stops are too tight. Expect volatility and plan accordingly.
Final Vibe Check
This Cycle Mastery Part 1 equips you to time MWC waves with precision, aligning HWC, MWC, and LWC for smarter entries. By mastering when to trade the first or second wave, you’ll avoid traps and maximize your edge. Part 2 will dive deeper with examples—stay tuned! At Skeptic Lab, we trade with no FOMO, no hype, just reason. Protect your capital—stick to 1%–2% risk per trade. Want Part 2 or another topic? Drop it in the comments! If this guide sharpened your game, hit that boost—it fuels my mission! 😊 Stay disciplined, fam! ✌️
💬 Let’s Talk!
How will you time your MWC waves? Share your thoughts in the comments, and let’s crush it together!