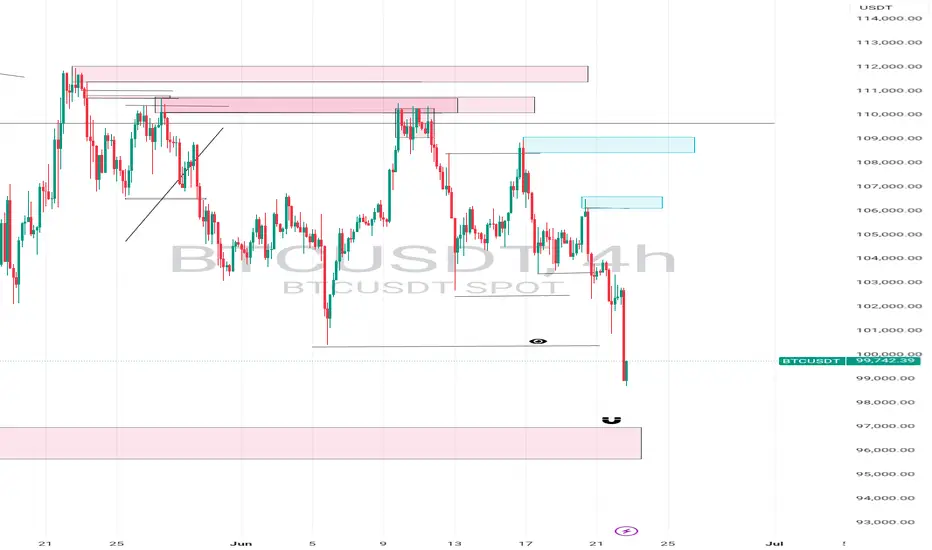
$btc long zones set upsth: htf + ltf liq + sh fib lvls + 61.8 fib 1d + 78.6 1d fib + cypher 1d harmonic pattern
BTCUSDT.PS trade ideas
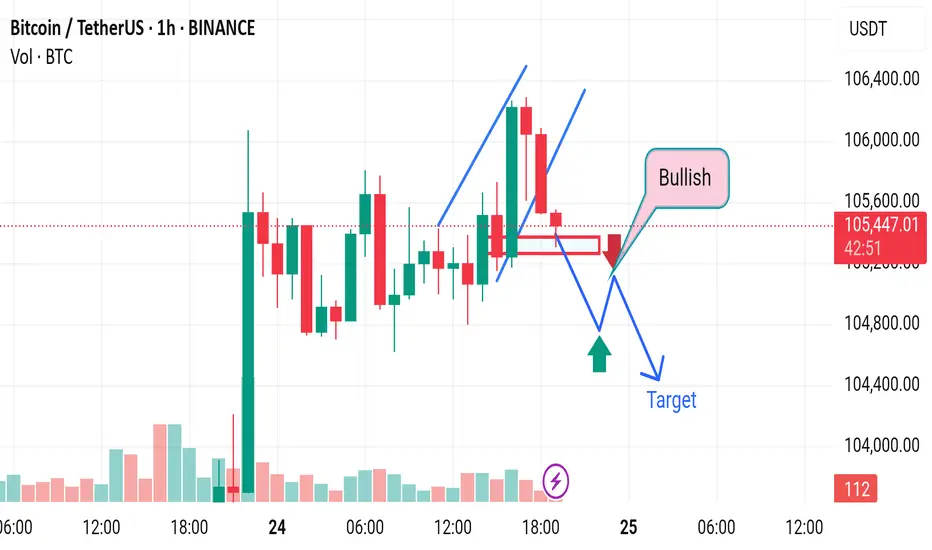
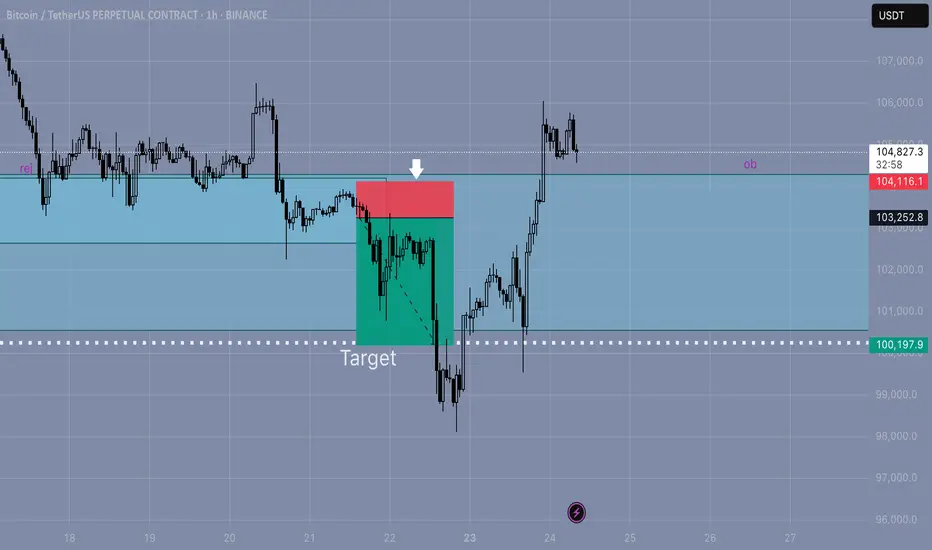
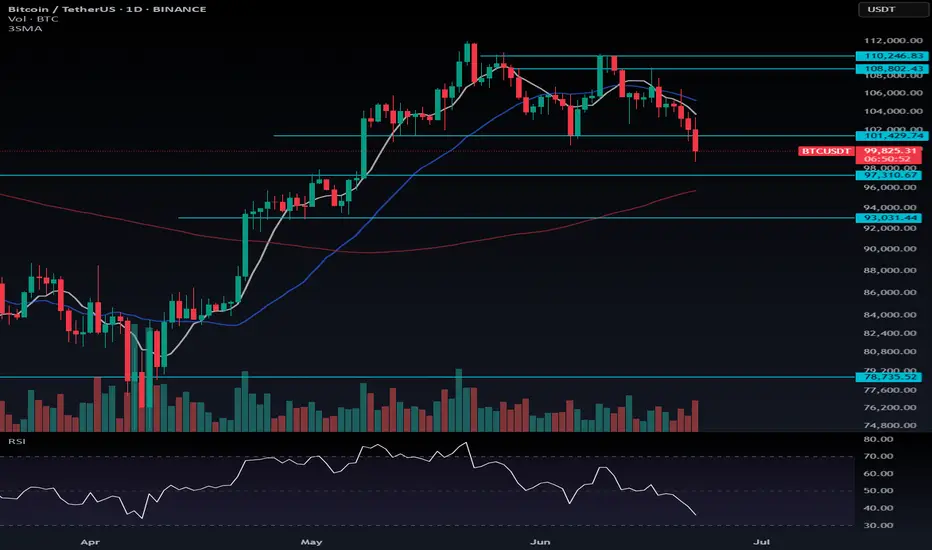
Market next target ⚠️ Disruption Analysis – BTC/USDT
1. False Bullish Narrative
The chart labels the structure as “Bullish”, yet recent price action shows:
A strong rejection near 106,000.
Followed by multiple red candles with increasing volume — a common sign of sell pressure re-entering the market.
The bullish label may be premature or misleading based on this momentum shift.
2. Bearish Structure Developing
The price is starting to form a lower high after the sharp drop.
The outlined path resembles a head-and-shoulders pattern in early development, often preceding a bearish breakdown.
The breakdown could lead directly to the "Target" zone or even below if momentum increases.
3. Volume Divergence
The volume spike during the pump was not sustained. Post-spike, volume is declining on green candles, suggesting buyers are exhausted.
Sellers are likely using liquidity at the top to exit positions, not initiate new longs.
4. Support Turned Resistance
The red boxes mark failed support zones which now may act as resistance.
If price attempts to retest these zones and fails, it would confirm bearish control and validate the downward path toward the target (104,400–104,000).
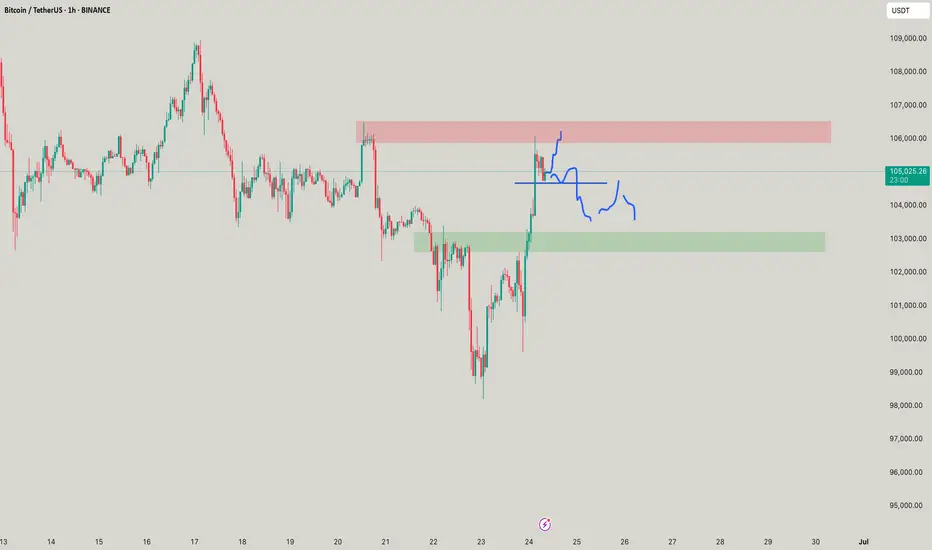
BTC Short Setup – Breakdown Below Structure💡 Idea:
Bitcoin is consolidating under a key structure after a sharp bullish move. If price breaks below the curved neckline, it could signal the start of a local downtrend.
🔔 Trade Plan:
Entry: Below $104,902 (after a clear 1H candle close under the curved line)
Stop-Loss (SL): $106,649 (above the recent swing high)
Take-Profit (TP): $100,735 (targeting major support zone)
Risk/Reward: Approximately 1:2.38
🧠 Reasoning:
Price is forming a rounding top structure, indicating potential exhaustion of bullish momentum. A break below the curve could lead to a retracement toward the $100k support level.
📆 Timeframe: 1H
⚠️ Always wait for confirmation and manage your risk.

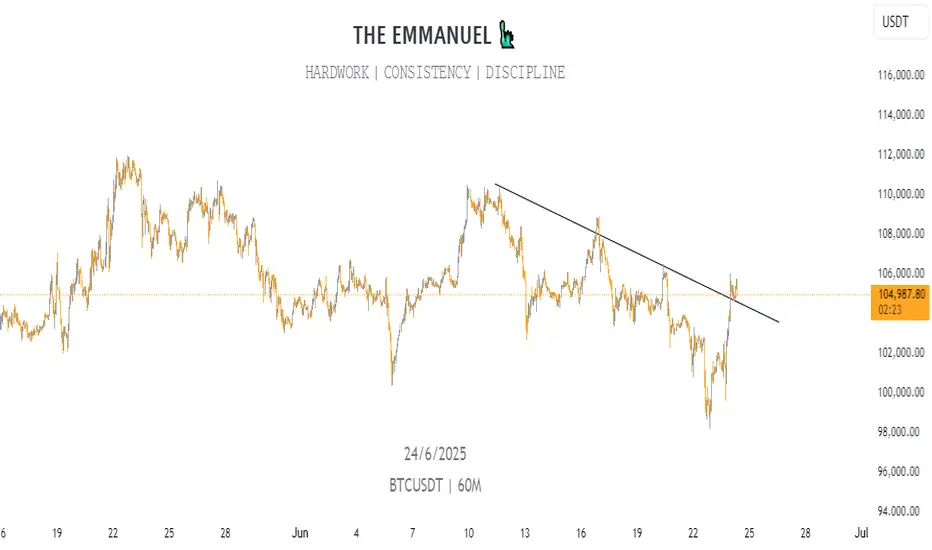
Where are we going?BTC is at a critical level of resistance at the prior low. Breaking above this level would suggest a change in the trend. A rejection would suggest a final downward movement, which I would prefer in order to complete a 1-2-3-4-5 wave count and avoid an expanded flat correction.

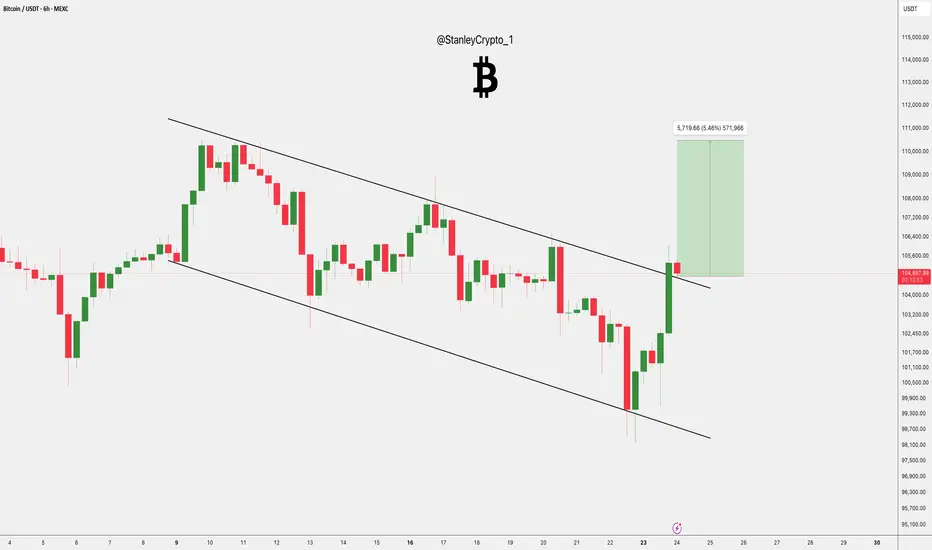
Bitcoin Overall: Larger correction may be overWhile I believe it is still possible to target the more global support zone below, a sequence of events like that shown (another smaller push higher before a larger drop) would suggest BTC is on its way to new ATH again.
Conversely, a larger drop from current resistance levels would suggest we still have one more larger leg down to me.
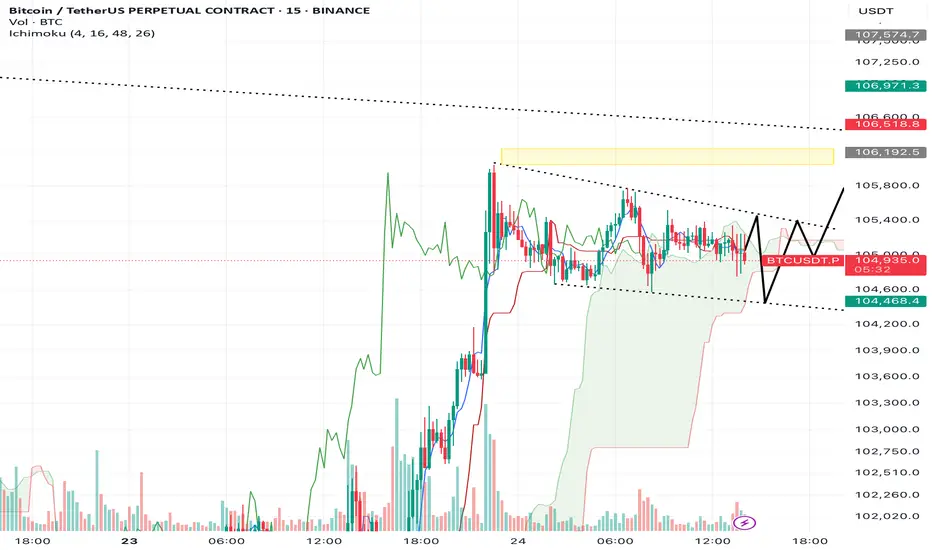
BTC/USDT – Intraday Plan (15m, Ichimoku) by RiscoraMy main scenario for today:
Expecting BTC to sweep the lows near 104,350, then see strong buying interest and a move up towards the yellow liquidity block around 106,300 by the end of the trading day. Ideally, I want to see this reversal on clear volume.
If there’s no strong buy reaction at 104,370 and buyers fail to step in, then I expect BTC to break lower — without reaching the yellow zone — and continue down by the width of the current channel.
Key zones:
Support: 104,350–104,370
Target if bullish reaction: 106,300 (yellow block)
Failure to bounce: deeper downside move, channel breakdown
Watching price action and volume closely at support for the next trade trigger.
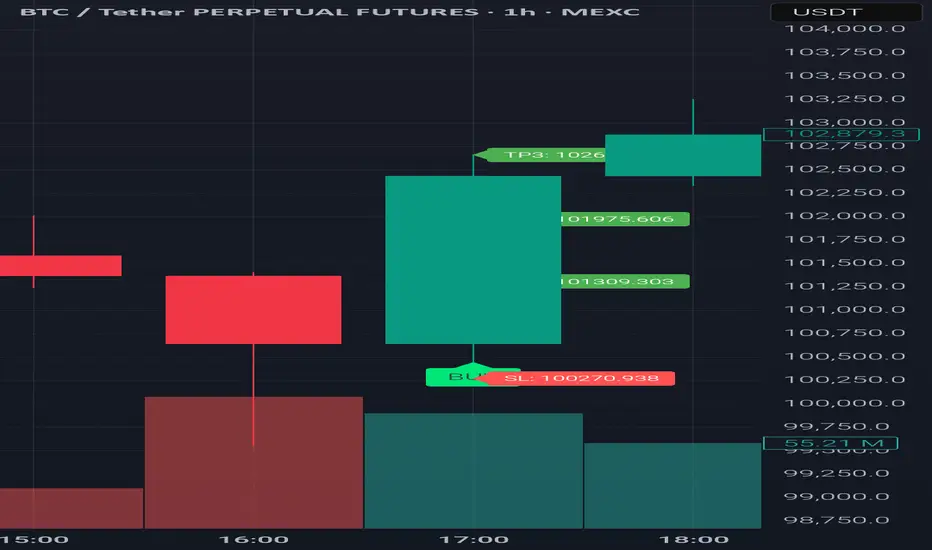
Instructions on how to potentially use the SIG[TP/SL (1H-4H-1D)]It's a HF algorithm for the 1H,4H,1D Time-Frames. Which means whenever the instrument reaches the open price, the algo might give a lot of signals and sometimes it might give plenty of reverse signals. In order to use the specific algo in the best possible way, here's a helpful guide on how to potentially use it:
1)Wait for the instrument to reach the open price.
2) ALWAYS, Follow the signals, e.g: We are at the open price. If it indicates buy signal, then open a long position. If for example 5 seconds later (again at the open price) it indicates a sell signal, then reverse the long position into a short position, and keep doing it until it gives a signal, that will be followed by a good sized candle.
3) The safest way is to close the trade when the price reaches the potential TP1.
4) Happy Trading!
*The text above is not an investment advice, and it does not guarantee any profit.
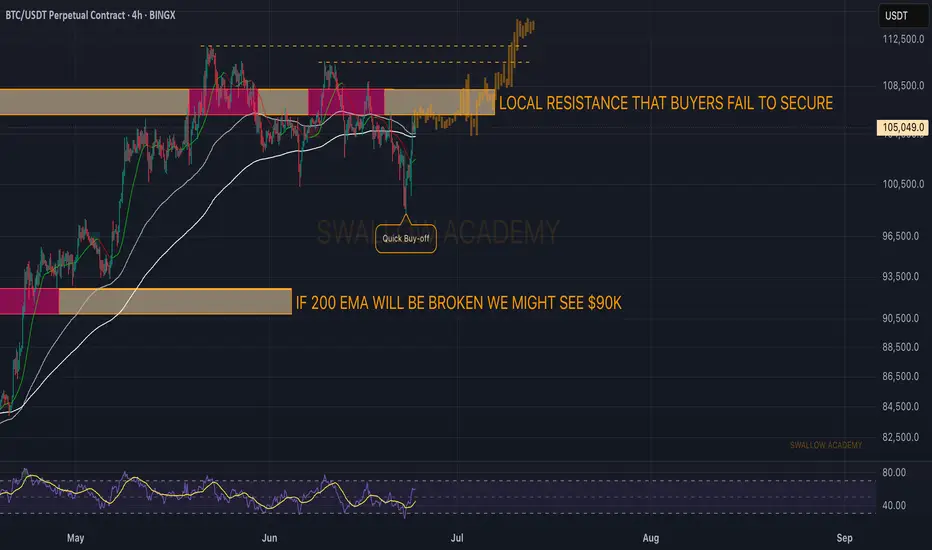
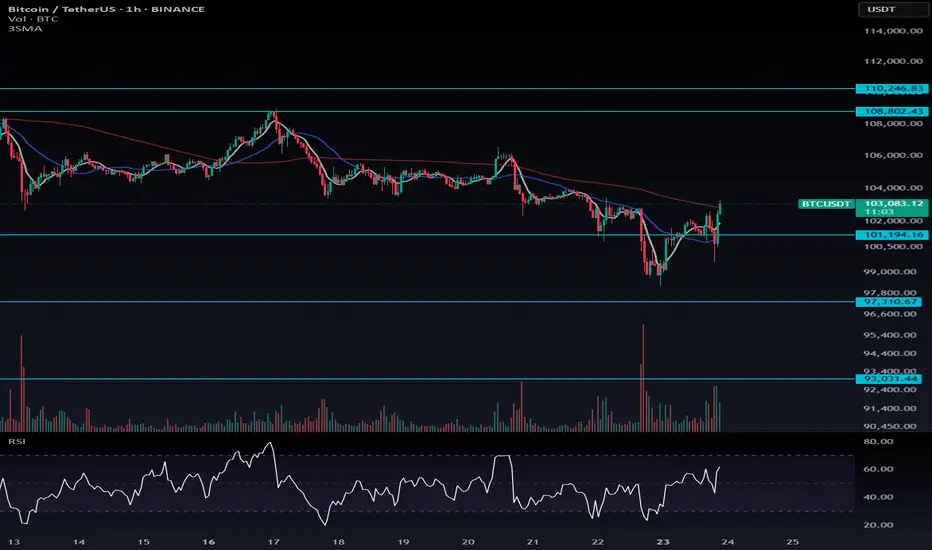
Bitcoin (BTC): Buyers Back in Play | Buyside DominanceBitcoin had a strong sell-side movement recently, which led the price below the EMAs and showed us again the failed breakout attempt.
What we saw was news-based movement, which got eaten up very quickly by buyers, where the price is now back above the 100K area and going again for an attempt to break out from here.
Nothing is confimed yet but what we saw was strong buyside dominance!
Swallow Academy
Played it perfectly: grabbed long liquidity and rode down to ourHey everyone!
Move unfolded exactly as we planned:
Minor price spike – a classic false breakout to collect liquidity in the long zone.
No valid short formation, so I stayed sidelined during that spike.
Once long liquidity was swept, the market reversed sharply downward—right toward our objective.
Price then steadily slid to our lower target, closing the trade with the planned profit.
📊 Key takeaways:
Don’t force entries without clear setups.
Liquidity grabs in line with your overall scenario are powerful signals.
Patience and discipline remain the ultimate edge.
What are your thoughts? Share your experiences with similar liquidity hunts!
NEW BTC HIGHS?BTC just broke a previous resistance zone. Previous data indicates a more upward push.
This may even lead to new highs.
$BTC Breaks Out $110K in Sight?CRYPTOCAP:BTC has broken out of its descending channel and is now trading around $105K.
This breakout signals a potential trend reversal, with a projected move toward $111K.
Holding above the breakout zone could confirm further bullish momentum.
DYRO, NFA
Is BTC having War INDUCED PA? - 110k?
Owing to this the movement has been commenced due to the ceasefire! Whats next?
The move can be seen on the bit up 106,500 can be eyed, just expect a bit
BTC is the champion our portfolio needs. BTC has some work to do. Either it will correct for a nice confrimatio low or strucure out for a bull fag. Either way, the price remains within a downward-sloping channel. That keeps me neutral bullish. But until I see a pivot point structure with signs of divergence in oversold conditions, it's difficult to get a proper RR.
Full TA: Link in the BIO
Markets Rally as Iran’s Strike Falls Short of Expectations🟢 Markets Rally as Iran’s Strike Falls Short of Expectations
One key point here is that global markets were bracing for a much more severe response from Iran toward the U.S. But when the actual attack turned out to be less intense than expected, risk assets — including crypto and stocks — started to climb, while oil prices dropped. Normally, heightened tensions in the Middle East would push oil prices higher, but this time, the opposite happened.
Another important factor is Bitcoin’s exchange outflows. As I’ve mentioned before, BTC leaving exchanges is a bullish sign — it means fewer coins are available to sell, which can fuel quick upward moves when a long trigger appears.
📍Wait for a clean long setup, and avoid emotional trades.
---
💬 Do you think the market is reacting rationally or emotionally right now? Drop your thoughts in the comments!
btc dirrectionnow days btc was bleeding much but to day was was recovering little as you see my last analyst it approaches the exact direction and I hope the coming days will go as I will insh Allah be ready for big bull run after it finish the last liquidity swept
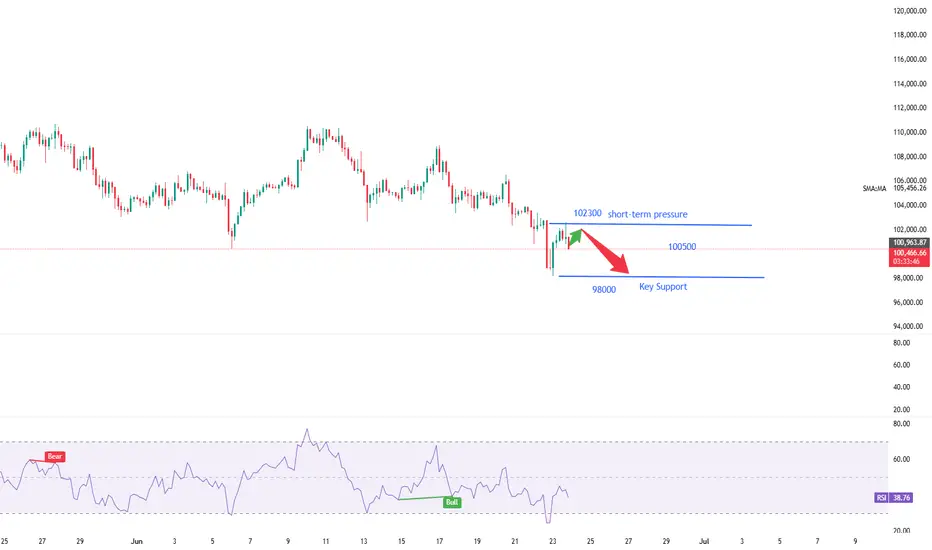
A bearish trend is gradually taking shape.From a technical perspective, the complete breakdown of the box bottom, coupled with the MACD indicator about to fully crossing below the zero axis, both indicate that bullish momentum is weakening and a bearish trend is gradually forming. Short-term bulls need to take a temporary break and wait for the construction of a stabilizing platform. For bears, according to the current trend, they can lay out short positions on rallies. The ideal entry position is near the lower edge of the box, and they can try to lay out positions boldly after setting stop-losses.
On the news front, "Laote"'s policies change frequently, with extremely high uncertainty. The market needs global stability, and there has been no bull market in history built in a turbulent environment. Therefore, we need to treat market conditions cautiously, avoid blind and radical operations, and only by maintaining rationality can we respond to market changes.
you are currently struggling with losses,or are unsure which of the numerous trading strategies to follow,You have the option to join our VIP program. I will assist you and provide you with accurate trading signals, enabling you to navigate the financial markets with greater confidence and potentially achieve optimal trading results.
Trading Strategy:
sell@102300-102800
TP:100000-100500
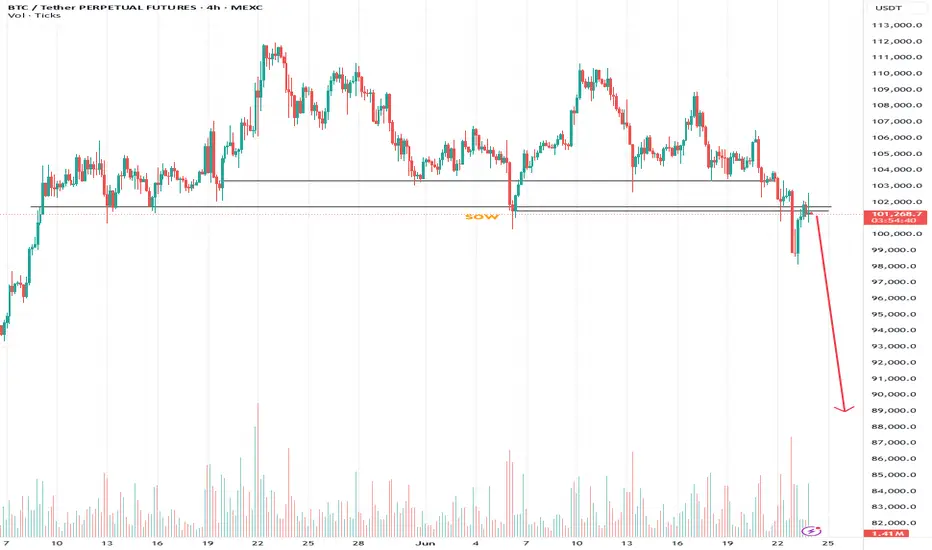
BTC comleted wykoff with retest of sowJudging by 4h analysis, BTC completed wykoff with retest of sow and is getting completely obliterated now. Get out while you can! X_X
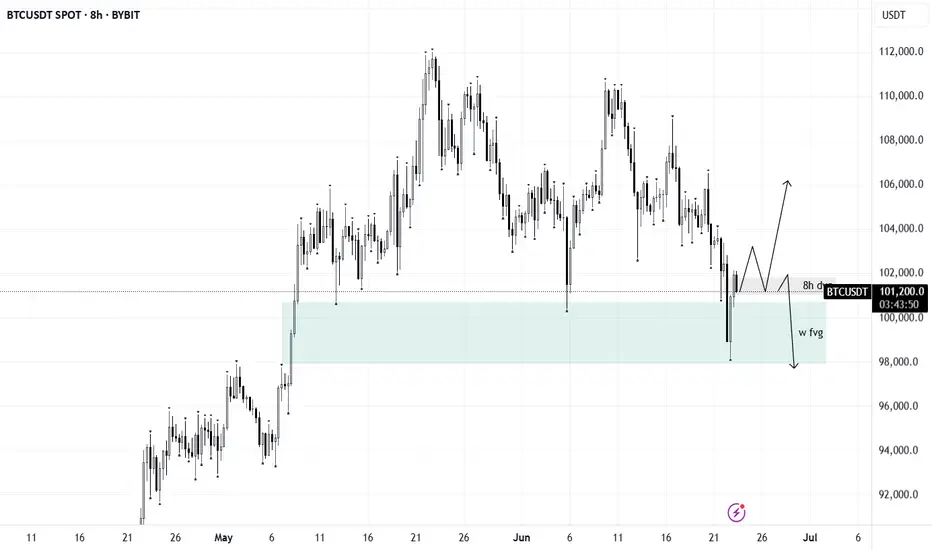
BTCBTC is currently trading within an 8H short FVG. For continued upside, a clean inversion of this zone is required.
Failure to flip this level may trigger a corrective move toward the $93K–$98K range. Monitor price action closely — confirmation is key.
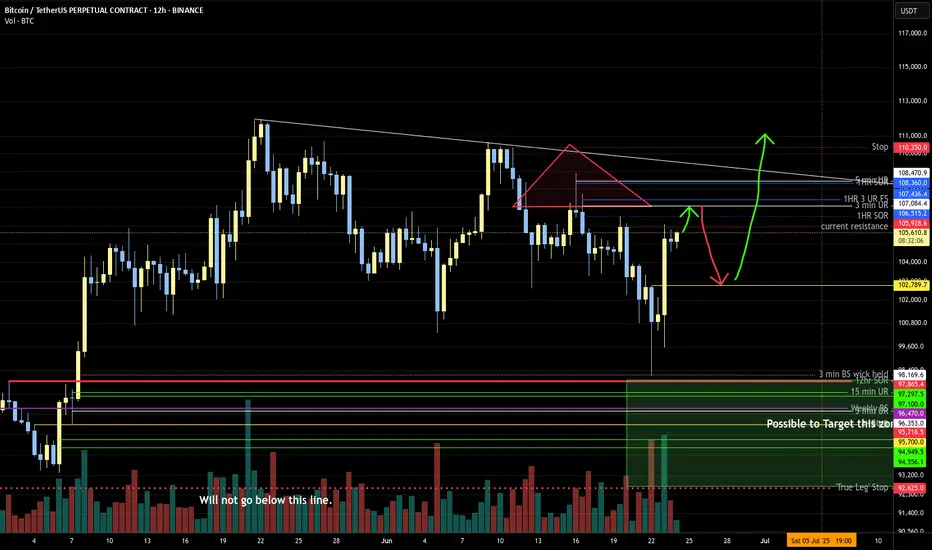
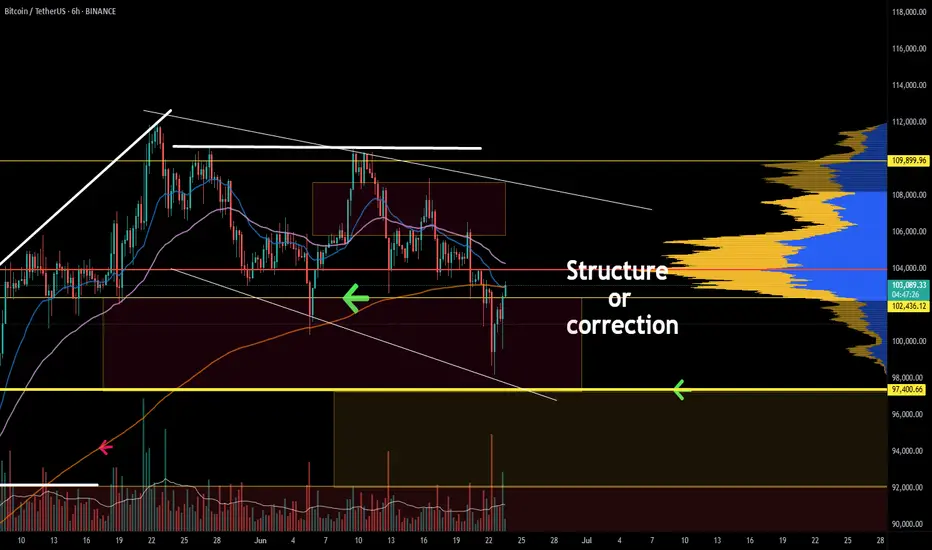
Major Support Confluence, Tactical Rebound or Looming Flush?__________________________________________________________________________________
Technical Overview – Summary Points
__________________________________________________________________________________
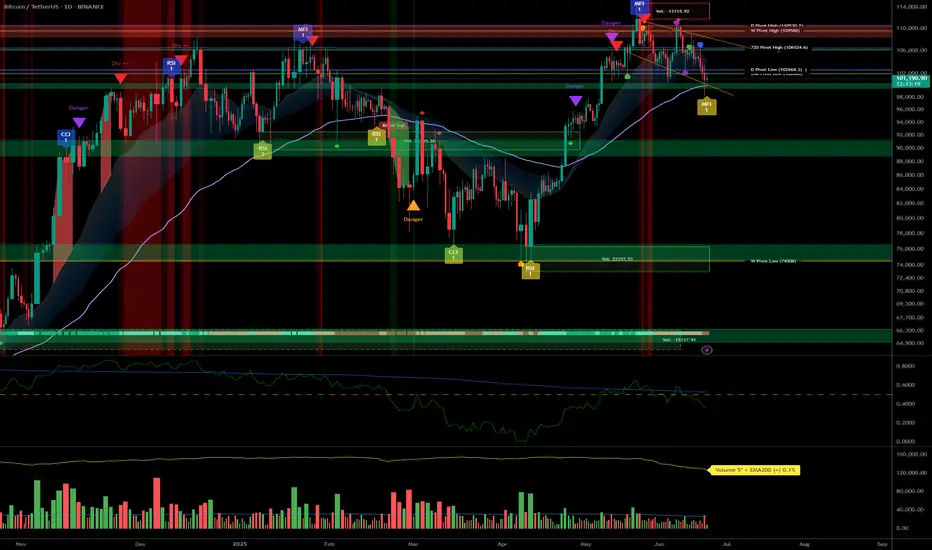
Momentum: BTC is working a major daily support zone (102.6–103k USDT) with strong confluence across 1D, 12H, and 2H pivots. Technical rebound in play, but still no strong behavioral catalyst.
Supports / Resistances: Key support clusters at 102.3–103.3k (2H, 720min, daily pivots). Main resistances: 106.4k–110k.
Volume: Very high on 2H/1H near supports, hinting at possible washout/profit-taking. No buy climax identified.
Risk On / Risk Off Indicator: Strong bullish signal from 1D to 30min (neutral on 15min), while lower TFs remain under selling pressure.
Multi-TF Behavior (ISPD DIV): No excess or euphoria: market is waiting/compressed, caution is necessary in the short term.
__________________________________________________________________________________
Strategic Summary
__________________________________________________________________________________
Global Bias: Tactical bullish but cautious — confirmation on clean rebound needed to strengthen conviction.
Opportunities: Technical entries in the 102.6–103.3k zone with stops below 102k (aggressive) or 97.5k (defensive). Profit-taking zones at 106.4k/109.9k/110k.
Risk Areas: Invalidated below 97.5k (swing), potential flush down to 94k/88–89k. Heightened vigilance around macro releases.
Macro Catalysts: PMI prints (June 23), Fed on pause, increased geopolitical risks (latent volatility and cross-asset caution).
Action Plan: Prioritize active management: reduced position sizing, mechanical stops, and real-time bias adjustment based on volume and behavioral response.
__________________________________________________________________________________
Multi-Timeframe Analysis
__________________________________________________________________________________
1D–12H: Major supports (D Pivot Low 102626.8), structural uptrend, strong Risk On signal, but no behavioral/volume extremes.
6H–4H: Ongoing technical rebound, moderately high volume, support confluence, BUT short-term TF pressure remains.
2H–1H: Very high volume at support, possible local flush, but still no bullish behavioral confirmation—monitor for rapid volatility.
30min–15min: Tentative stabilization post-support absorption, no clear psychological excess, risk of further downside if rebound not confirmed; Risk On / Risk Off Indicator is neutral at 15min.
Summary: Bullish structural setup, but fragile micro dynamics—discipline and speed are key.
__________________________________________________________________________________
Fundamental & On-chain Overview
__________________________________________________________________________________
External factors: Fed on hold, US inflation slightly higher, robust economy, increased geopolitical risks (hot spots Israel–Iran, Ukraine–Russia). Latent risk-off sentiment but not yet materialized.
Calendar to watch: June 23, 09:45–10:00 UTC (US PMI & home sales).
On-chain: Low user activity, high institutional volumes, off-chain flow dominance, leverage high (mostly in stablecoins, limiting crypto-margined liquidation spirals), no euphoria or panic detected.
Risk/reward synthesis: Key technical buy zone 102.6–103.3k (stop < 102k/97.5k), targets 106.4k/109.9–110k. Below 97.5k: bearish bias, defensive risk management needed.
__________________________________________________________________________________
Final strategic synthesis
__________________________________________________________________________________
BTC remains "structurally strong but tactically fragile": major support confluence and bullish sectoral signal, but persistent micro selling pressure and macro/cross-asset uncertainty. Only entries on clear technical signals, mechanical stops and active risk management offer rational short-term setups in this volatile and compressed environment.
__________________________________________________________________________________
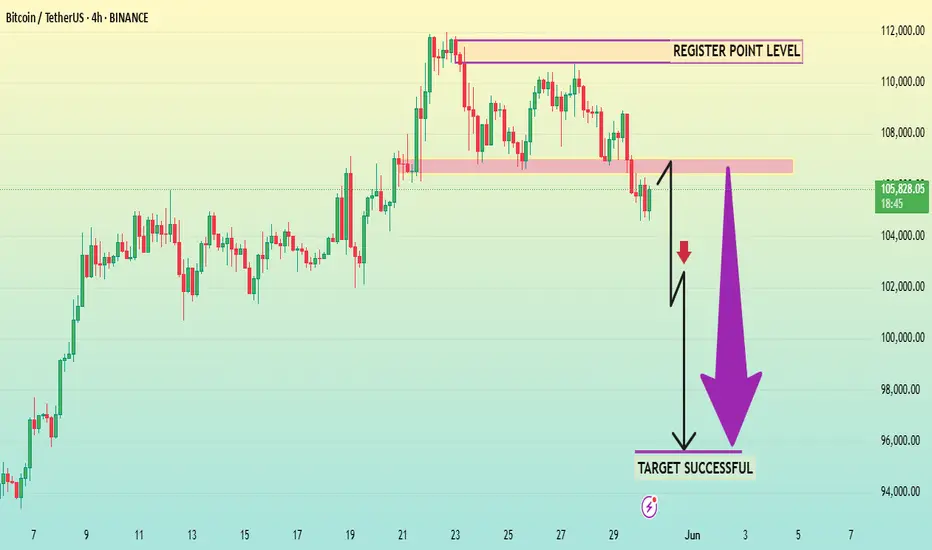
BTCUSD 4HThis chart presents a bearish setup for Bitcoin (BTC/USDT) on the 4-hour timeframe, shared by "Alpha_Gold_Trader." Here's the key breakdown:
---
Chart Breakdown
Current Price: Around $105,857
Resistance Zone (Register Point Level): ~$109,000 to ~$111,500
Support Zone (Breakout Level): ~$106,500 to ~$107,500 (pink box)
Bias: Bearish (implied by breakdown and downward projection)
Price Target: Around $95,000, labeled as "TARGET SUCCESSFUL"
---
Technical Implication
Price has broken below the support zone marked in pink.
A retest of broken support is anticipated before continuation down (common in breakout setups).
The setup suggests a short trade if price fails to reclaim the broken support and confirms rejection.
---
Trading Strategy Outline
Entry: Near $107,000 (on failed retest)
Stop Loss: Above $108,500 (back in the previous range)
Take Profit: ~$95,000 (target zone)
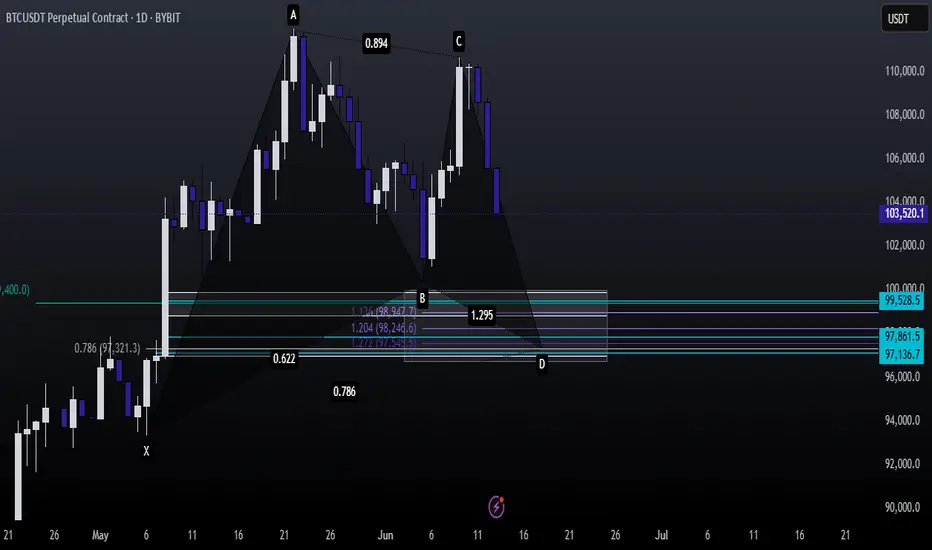
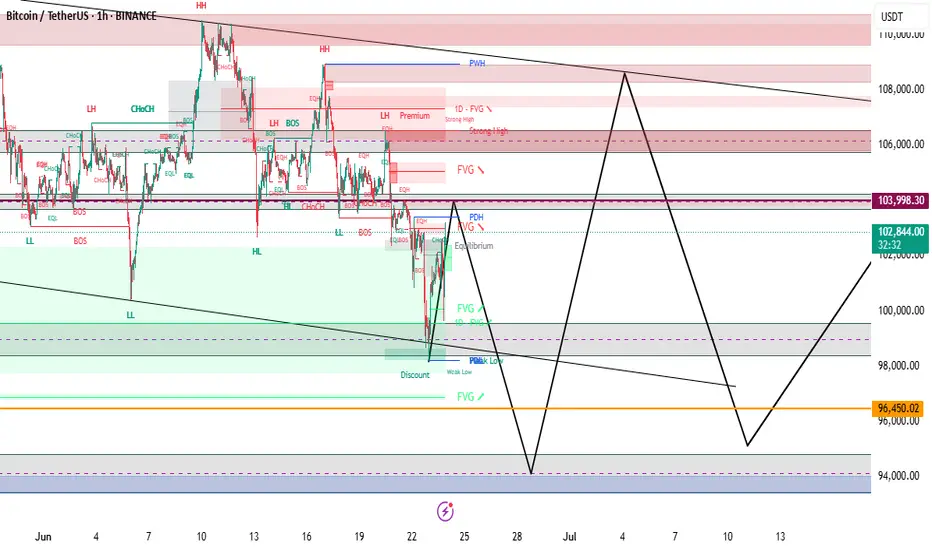
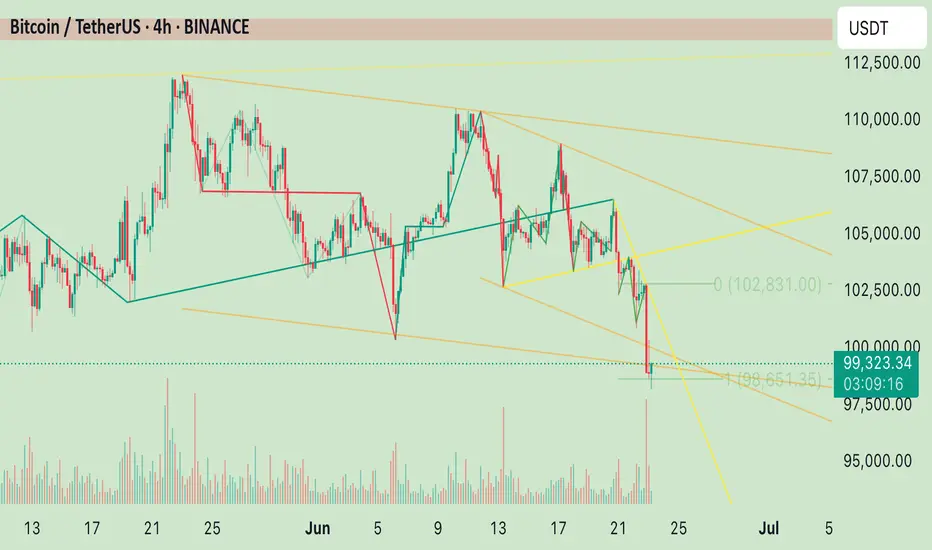
The end of Triangle?If yes, trend is over.
But, not sure where is the end of triangle.
06/17 or 06/20?
We should check this through analyzing afterward movements.
Low probability that it was not triangle.
If it wasn't, big ending diagonal will be made.
It means there will be more dip but high potential to make new ath(historical top/reversal point).
Let's check trend line/channel of these posts.
Checking retest is the key.
Still, short position has attractive price points.
Bitcoin Still Bullish Above $93K — Don’t Trade with Emotion🟢 Bitcoin Still Bullish Above $93K — Don’t Trade with Emotion
I still believe Bitcoin is in a bullish trend as long as it holds above $93,000. The recent drop seems mostly driven by external factors and geopolitical uncertainty. If Iran responds to the U.S. or closes the Strait of Hormuz, there’s a strong chance this short-term downtrend could continue.
But here’s the key: don’t trade emotionally. If you’ve bought spot positions and your stop-loss was hit, it’s okay to exit. You can always re-enter later when conditions improve. The most important part is to trust your analysis and the stop you originally set.
As for futures, I’m personally not trading right now — the market is too reactive to headlines. However, I’ve noticed BTC outflows from exchanges have increased, which is often a bullish long-term sign. This means the price can recover just as fast once fear subsides.
📉 In uncertain times, patience is a strategy too — sometimes watching is better than chasing trades.
---
💬 What’s your take on Bitcoin during this geopolitical mess? Let me know in the comments — I’d love to hear your thoughts. 👇
BTC outlook Just as analysed , Bitcoin delivered nicely , and still delivering, now we expect to see a full drop to 74k