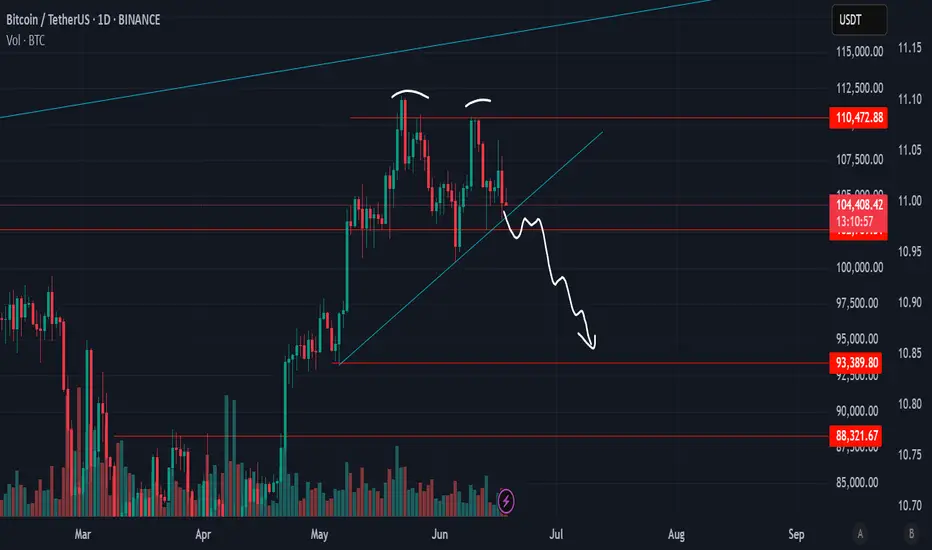
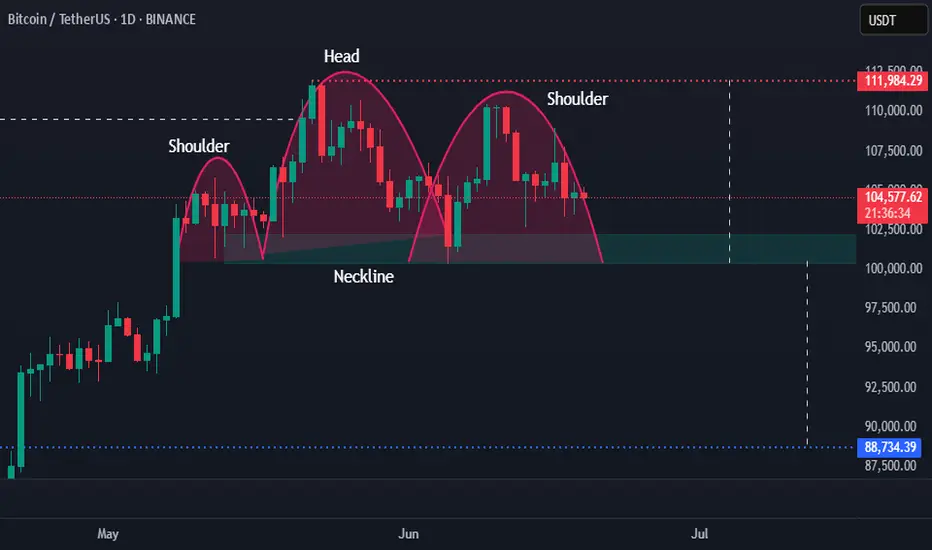
Classic H&S pattern in Daily chart of BTCHello Good Morning everyone:
Are your preapared for this classic pattern of Head and Shoulder of BTC at daily chart??
BTCUSDT.PS trade ideas
US entering the war,~25% drop will happen if it's gonna escalateUS about to enter the war with Iran, as long the war finish quickly with US destory Fordow nuclear site and other facilities, we can stop around 94k$ zone,
war escalating more, will engage a bigger drop in markets.
Likely they will announce it after markets close on Friday. stay updated.

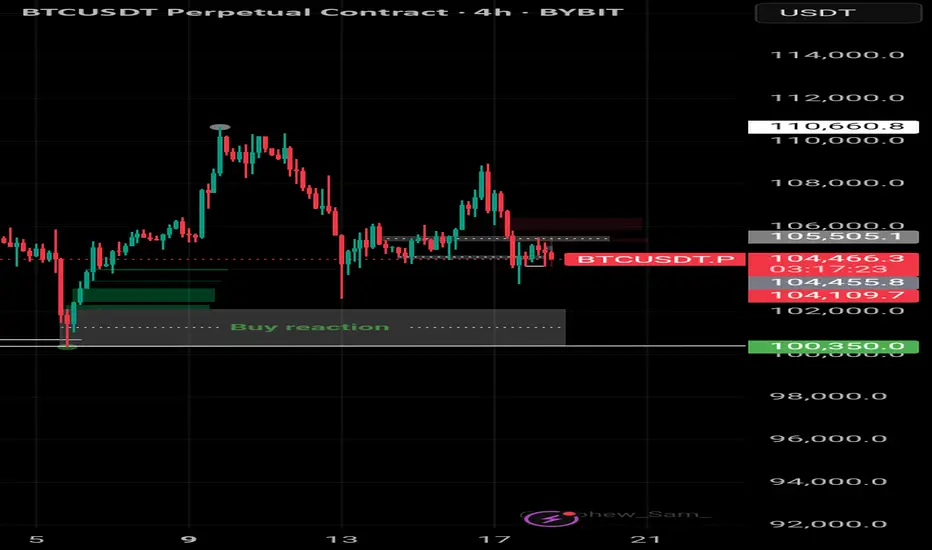
Bitcoin buy ideaBitcoin (BTCUSD) had a challenging week of consolidation, but it remains stable above $100,000 despite losing some weekly gains. On the 4-hour chart, demand is holding above $102,000. With the Fed maintaining interest rates at 4.50%, if Bitcoin consolidates above $102,000-$103,000, we could see short-to-mid-term growth towards $106,000-$110,000.

H&S $92K Short + CME Gap Fill Towards Support LineCurrently CME Gap already hit H&S with are target towards Gap Fill

Bitcoin Crash to $93k is Progressing Well! But be Careful Now!I have explained the price action of Bitcoin, shared my insights on what will happen next, and updated my previous idea on $BTC!
Smash the rocket button if you feel the Bitcoin bearish vibe!

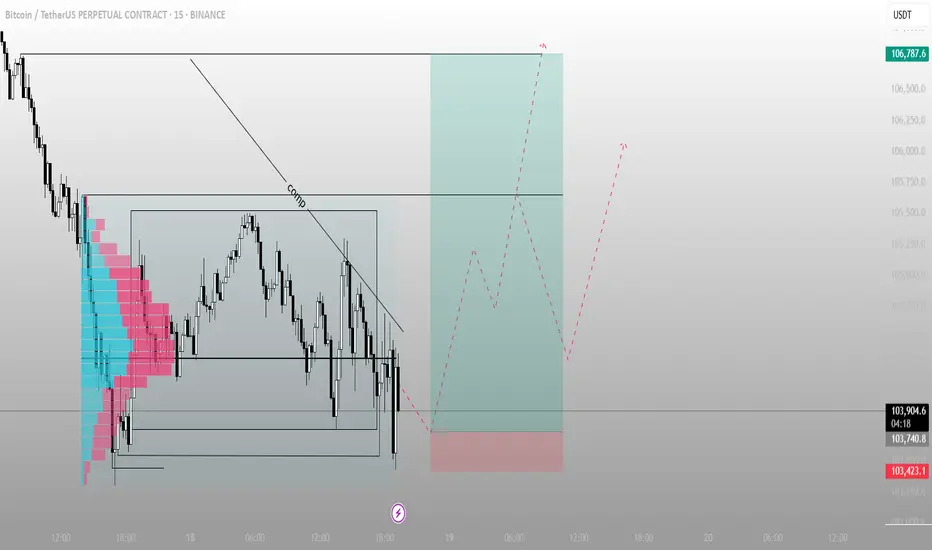
BTC – Stop Hunt at the Edge of ValueThis is what a liquidity raid looks like.
Price just swept the bottom of the range, tapped into the low-volume zone (as seen on the volume profile), and reclaimed — classic sign of a trap sprung.
Key points:
The downtrend line labeled “comp” = compression — bulls forced to capitulate into a thin zone
High probability deviation with stop run and reclaim — this fuels the next move up
The green box shows risk-defined entry off the sweep low
Targeting the prior high: 106,787
Volume imbalance filled = no inefficiency above — price can now move cleanly
Execution mindset:
Trap spring → retrace into structure → expansion
Risk is clear, liquidity is engineered, structure remains
Late shorts just became the fuel.
Watch the reclaim of the box top. If that flips support, we ride momentum.
📈 For more setups like this — including pre-breakout traps — check the description in the profile.
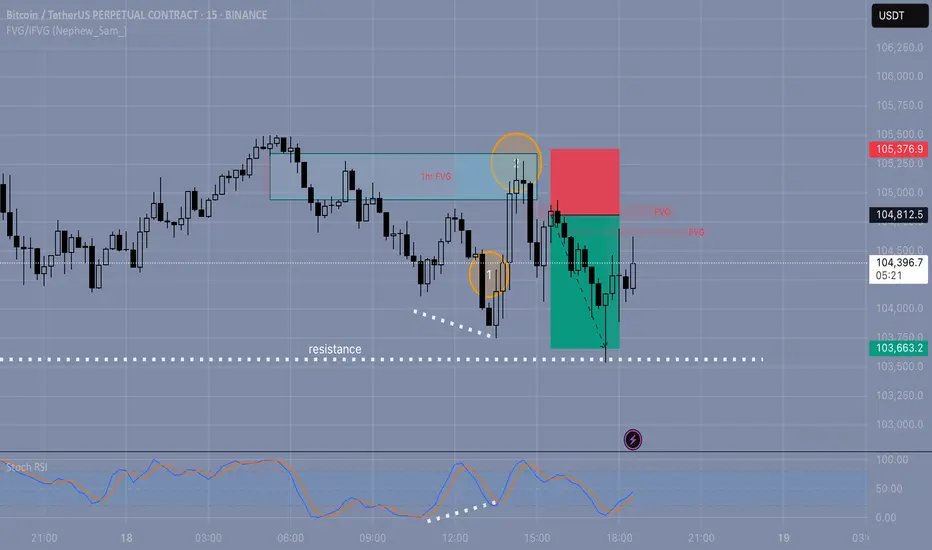
BTC Short | FVG Setup + RSI Filter | 18.06
Smart Money Concept | Intraday Trade | 1:2 RR
🔍 The setup:
Today I was watching for a short opportunity.
Price reached a key level and formed a bearish FVG — looked clean at first.
But I held off entering because I noticed RSI divergence — a red flag I always consider when expecting a potential level break.
💡 Why it matters:
RSI divergence often signals weakness in momentum.
For me, it's a key filter that helps avoid fake breaks — this was a good example of how I apply it.
📈 What happened next:
Price moved up to test the 1H FVG (zone #2) and formed another FVG slightly lower.
That second one was my entry point for the short.
🎯 Target:
I exited at a 1:2 risk-reward, which is my minimum.
The day was ending, and I didn’t want to hold the position longer — I’m not convinced the down move would continue cleanly (possible wicks or traps).
🤔 Question to the community:
How do you filter FVG entries?
Do you also use RSI or wait for structure shifts?
And what’s your outlook on BTC from here?
BTC H4 Range Play: Patience Until One Side Breaks✅ Price contracting within well-defined H4 range
✅ Clear lower highs and higher lows — coiled, ready to break either side
⚠️ FOMC incoming — possible volatility/surprise rate cut rumors
🎯 Trading Plan:
Short Setup:
If price spikes RH ($105,500) and H4 FVG (~$106,000), then re-accepts back inside the range
Entry on confirmation back below RH/FVG
Target: RL ($103,300) and $102,600
Stop: Above $106,300
Long Setup:
If RL ($103,300) or $102,600 gets swept then reclaimed (M15/H1 SFP or strong reclaim)
Entry on confirmation reclaim of RL/W
Target: RH ($105,500) and beyond
Stop: Below $102,200
🔔 Triggers & Confirmations:
Only enter trades on confirmed sweeps/reclaims or acceptance back inside after spike
No trade if price stays in chop between levels
📝 Order Placement & Management:
Sell Limit: $105,500–$106,000
🛡️ Stop: $106,300
🎯 Target: $103,300 / $102,600
Buy Limit (on sweep/reclaim): $102,600
🛡️ Stop: $102,200
🎯 Target: $105,500 / $106,000
🚨 Risk Warning:
Market coiled — can rinse either side
FOMC could be a catalyst; manage risk, don’t overtrade

Bitcoin's Latest Market AnalysisThe recent escalation of the situation in the Middle East has triggered a surge in risk - aversion sentiment across global financial markets. As a risk - on asset, Bitcoin has faced certain selling pressure in a market environment dominated by risk - off sentiment.
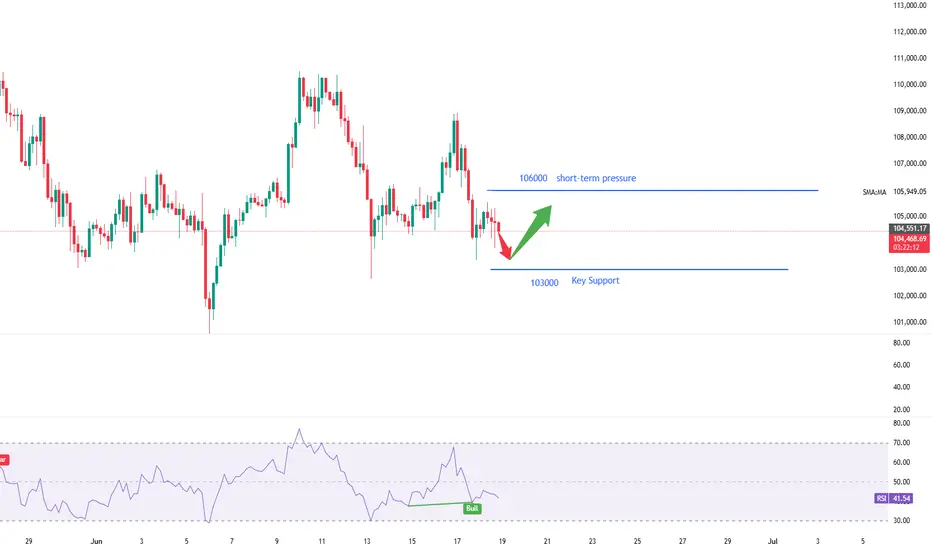
From a technical chart perspective, Bitcoin has made multiple attempts to break through the key resistance range of $108,800 - $110,000 in the recent period, but has encountered significant selling pressure each time. On the other hand, the area between $105,000 - $103,000 forms an important support zone. When the price drops to this area, it attracts some bargain - hunting capital inflows, which provides a certain degree of support for the price.
The price of Bitcoin is expected to fluctuate within a relatively narrow range. If it can hold the key support level of $105,000 and the bulls can regain strength, the price is likely to rebound to the range of $106,000 - $108,000. However, if the $105,000 support level is effectively breached, it may trigger additional selling pressure, potentially driving the price down further to $103,000. In extreme cases, if market panic sentiment spreads further, it may test the psychological threshold of $100,000.
you are currently struggling with losses,or are unsure which of the numerous trading strategies to follow,You have the option to join our VIP program. I will assist you and provide you with accurate trading signals, enabling you to navigate the financial markets with greater confidence and potentially achieve optimal trading results.
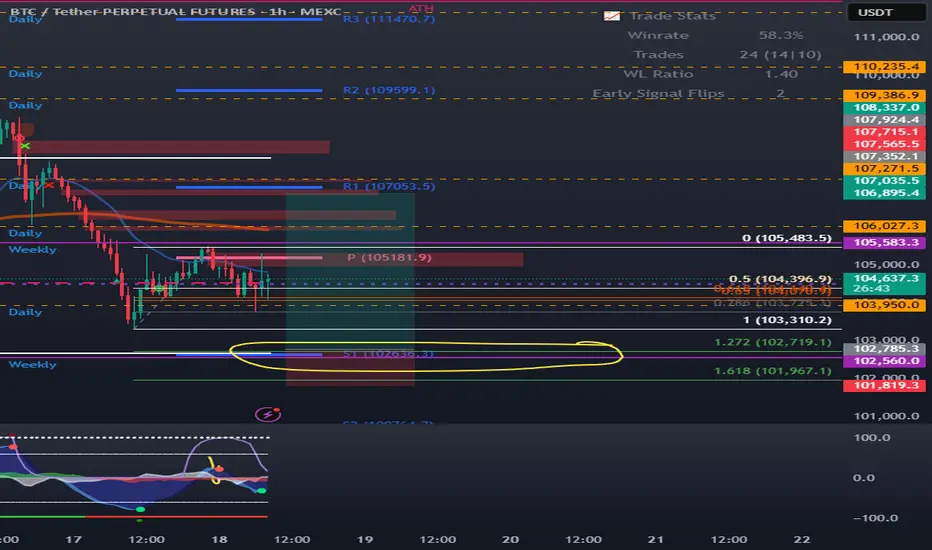
BTC Bitcoin VAL, S1, Weekly, 1.27 confluence at $102,700BTC Bitcoin VAL, S1, Weekly, 1.27 confluence at $102,700
If we do drop more, this is where I'm looking to buy. Lots of support in this area for a bounce back to the POC. A rejection of POC means we may be looking at 100k. Get past it, then target is VAH around 106k.
Bitcoin Eyes $110K or $94K – Depends on Global HeadlinesBitcoin (BTC/USDT) – 4H Technical Outlook
📅 Update: June 18, 2025
🧭 Current Market Status:
Bitcoin is currently trading around $105,296, sitting in a tight consolidation above key support ($104K). The price has respected both demand and supply zones over the past few sessions but remains sensitive to macro-driven events, especially geopolitical instability.
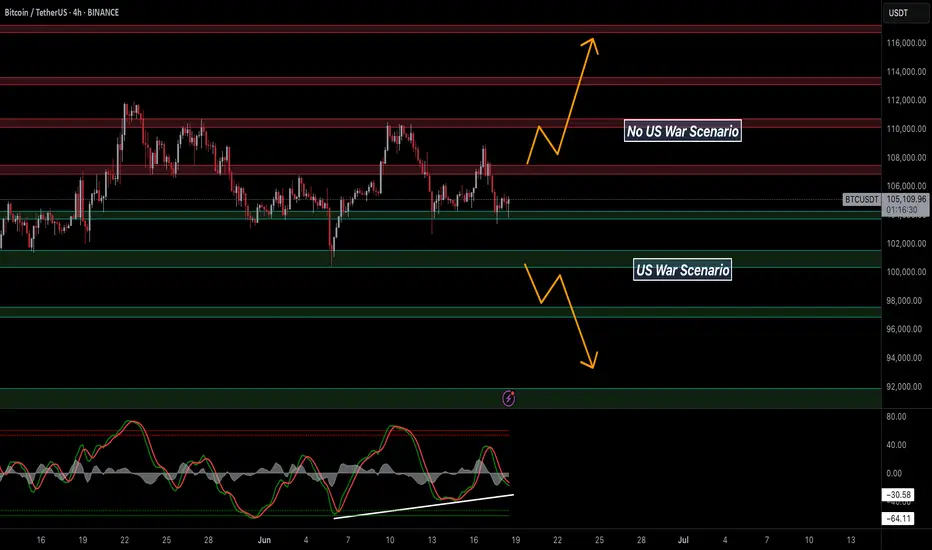
We can clearly see BTC is caught between strong support around $100K–102K and resistance around $108K–110K, awaiting a directional break.
📊 Key Technical Levels:
Resistance Zones (Red):
$108K–110K – intraday resistance block
$112K – short-term breakout target
$114K–116K – final bullish extension zone
Support Zones (Green):
$102K–104K – immediate demand
$100K – psychological round number + previous breakout base
$98K / $96K / $94K – downside targets if panic sets in
🔺 Scenario 1: No US-Iran War (Bullish Case)
If no escalation occurs:
BTC could bounce from current support or even dip to $102K before pushing higher.
A clean break above $108K may trigger a move toward $112K and then $114K–116K.
Stochastic shows bullish divergence forming (see trendline), supporting a possible upside breakout if momentum strengthens.
🟢 Look for breakout candle + volume confirmation above $108K.
🔻 Scenario 2: US-Iran War Escalates (Bearish Case)
If military conflict breaks out:
Safe-haven rotation may favor cash or gold short-term; BTC could lose traction.
Breakdown below $102K may lead to panic drop toward $98K, followed by potential flush into $94K.
Watch for failure to hold $100K — this would mark a major shift in sentiment.
🔻 BTC has historically struggled during initial shock of war-related uncertainty.
🔁 Neutral/Bounce Scenario:
If price holds $104K–102K range but no major trigger emerges, expect sideways consolidation.
Traders can scalp range levels until a confirmed breakout or breakdown.
🛡️ Risk Management Notes:
BTC remains headline-driven — adjust position size based on volatility spikes.
If trading directionally, place tight SLs below key support or above resistance, depending on side.
Consider hedging with stablecoins or options if holding long-term spot.
📢 If you found this analysis valuable, kindly consider boosting and following for more updates.
⚠️ Disclaimer: This content is intended for educational purposes only and does not constitute financial advice.
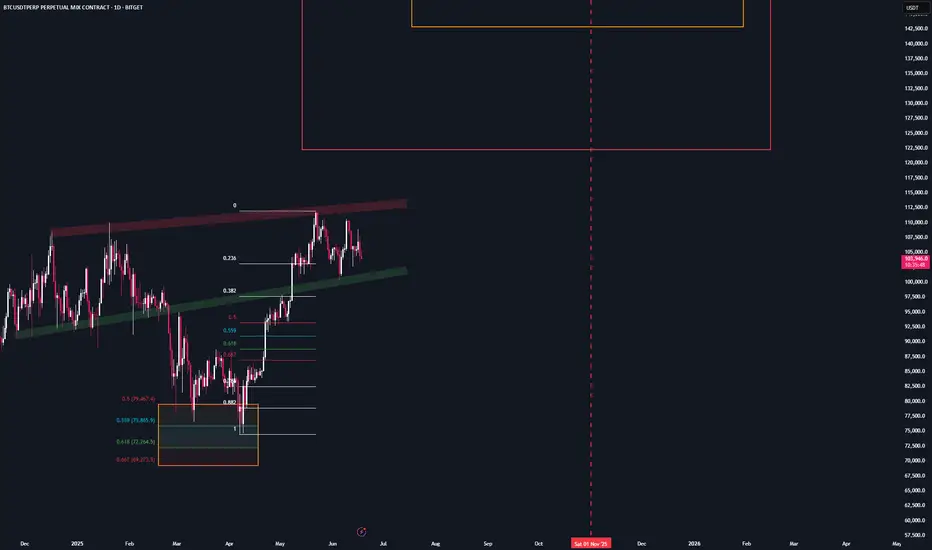
It's an Evacuation Through Green Candles💥 "One Last Leap of Faith?" - What Bitcoin Might Be Hiding Before September
The world’s on fire: Israel, Iran, Strait of Hormuz, oil, elections, the dollar, rates, black swan whispers.
And someone’s out here saying Bitcoin might still go up?
Yes. We are. Not because we believe - but because we see.
📉 Everyone’s afraid. The whales aren’t.
When the crowd goes into survival mode, the real game begins.
Whales aren’t exiting - they’re accumulating.
ETFs aren’t pausing - they’re inflowing.
The technical setup isn’t breaking - it’s compressing like a spring.
$104,000. Coil building.
If we break out - targets at $132K–$140K are absolutely in play.
👉 But that’s not the point.
The point is why this is happening while the world is burning.
🧠 The idea: Bitcoin isn’t a safe haven. It’s a distribution machine.
Gold is for panic.
Bitcoin is for structure.
Institutions don’t ask “is it scary?” - they ask “where’s liquidity?”
Everything is aligning for one last upside move.
Until September. After that - chaos is back on the table.
💣 The Global Playbook:
Now (Summer) - Consolidation, ETF flows, geopolitical fear - Strategic entries, low exposure
Breakout - FOMO panic, retail rushes in - Profit-taking via options
September–Fall - Macro/geopolitical shock - Already in cash or hedged
📌 Bottom Line
Yes, Bitcoin might pump. Not because the world is fine - but because someone needs to exit beautifully.
If you're reading this - you're early enough to think.
Markets don’t reward justice. They reward positioning.
🛠 What to do right now:
Watch the $104,000 level - it's the pivot
Breakout = final upside push to $132K–140K
Keep your eyes on September - reversal zone
Think in scenarios: entry, exit, protection
Follow EXCAVO - we don’t guess, we read the game
I've been talking about this scenario for a long time
Bitcoin Long Setup: Two Potential Entry Zones After The DropHello, traders! As predicted, Bitcoin is perfectly following Scenario #2 from my previous analysis.
📉 What Happened?
The instrument showed a fake rally, luring impatient traders into premature long positions, only to liquidate them with a sharp downward move. The primary Point of Interest (POI) remains below us — this is where the "whale" aims to deliver the price to fill their orders and close the shorts they used for the initial SSL manipulation.
My Trading Scenarios & Entry Plan
1️⃣ Scenario 1: Mitigation of the Primary POI
My expectation remains the same: a reaction upon the mitigation of the 4h order block , which aligns with the 78.6% Fibonacci level.
Entry Condition: The level must hold on at least the 4H timeframe, confirmed by a bullish reversal and an order flow shift on the Lower Timeframe (LTF).
Zone: $102,745 - $103,868
Invalidation: A clear break and close below the 78.6% Fib level would invalidate this scenario.
2️⃣ Scenario 2: Deeper Liquidity Grab
If the liquidity at the 4h OB isn't enough for the whale to continue the uptrend, they might trigger a more aggressive decline to grab liquidity from the low at $100,370.
Entry Condition: A swift sweep of this low, followed by a sharp reclaim of the level and the beginning of a bullish order flow on the LTF.
Zone: $100,700 - $102,000
Invalidation: A candle close below the $100,370 liquidity level would invalidate this scenario.
Final Thoughts
Do not open positions just because the price has reached a POI. Wait for a clear reversal reaction and LTF confirmation for more conservative and safer entries. Always use stop-losses to protect your capital; no setup has a 100% win rate, and for every whale, there can always be a bigger one.
To be consistently profitable, you just need to find setups with a win rate greater than 50% — this is how casinos and professional traders operate.
Happy hunting with the whales — don't be the plankton. Follow their tracks.

BTC: Scalp Long 18/06/25Trade Direction:
Long BTC Scalp BINANCE:BTCUSDT.P
Risk Management:
- Risk 0.1% (very low risk due to market conditions)
- Target approx 0.5% gain
Reason for Entry:
- 0.618 retracement
- Sweep of recent low
- M30 Fair Value Gap tapped (partially mitigated earlier)
- Multi time frame Oversold
- Market structure holding key support level
Additional Notes:
- Confidence level low low likely hood this succeeds but trading my plan
- Very cautious trade in a volatile unpredictable market environment

Everybody is trying to sell due too todays news No one want too risk trading today whiles news are inbound for today

My thoughts on Bitcoin long-term, as well as mid- to short-termLONG-TERM / THE BIG PICTURE:
Regarding the big picture, we couldn’t be more bullish. We’re currently fighting our way through the cycle as usual—despite the fact that this cycle has had way too many chop phases, flushing out far too many participants.
Just a few weeks ago, we got our bullish crossover on the weekly MACD—a signal that has triggered a major BTC rally every single time this cycle.
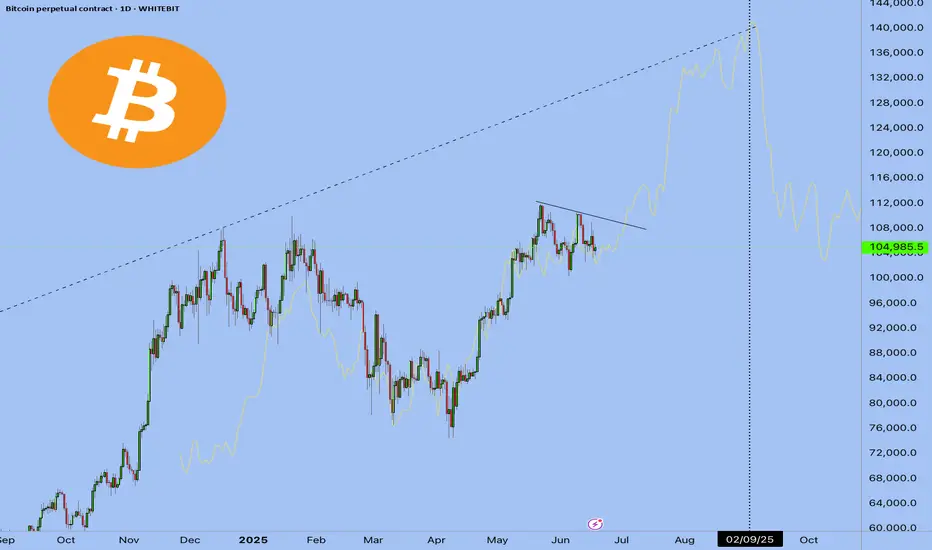
At no point in this cycle has #BTC been overheated. The blow-off top is still coming.
LOCAL PRICE ACTION:
CRYPTOCAP:BTC remains in this vertical ascending channel and remains macro bullish what imo is another huge re-accumulation range lasting more than 200 days since November, that will lead to an impulsive breakout TO THE UPSIDE in the weeks to come
MACRO LANDSCAPE:
Due the last crash we potentially got an bulllish structure, wich if the price breaks the high at $110.000 is confiraed and can bring us to 120k on #Bitcoin
On the lower TF we currently see an oversold RSI + a bounce from the 0.667 level
RECOMMENDATION:
Watch the high at 110k and the low at 100k, we have to break either one of these 2 levels.
Have an eye on the current conflict with israel & iran and dont forget the FOMC meeting tmwr, where we can expect some important news due the current situation
Either way, I'm long and mid-term bullish despite the current accumulation by long-term holders (which just peaked)...
Always watch the big picture from above - maintain perspective and don't focus too much on smaller timeframes...
But most importantly: Survive.
Thanks for reading, let me know your thoughts about the current market situation & price action👇
Bearish btcLooking at the market and what is going on around the globe 🌍
From my technical stand point btc would drop (80k)
How Bitcoin can impact alt coins like sol and sui This video is a very quick update on the potential for bitcoin to drop into the 96/97k region and the effect it will have on alt coins .
If you hold altcoins and you see them bleed in price then its important to know and understand whats ahead for Bitcoin .
Understanding this will help you with your entry's and your exits on all altcoins .

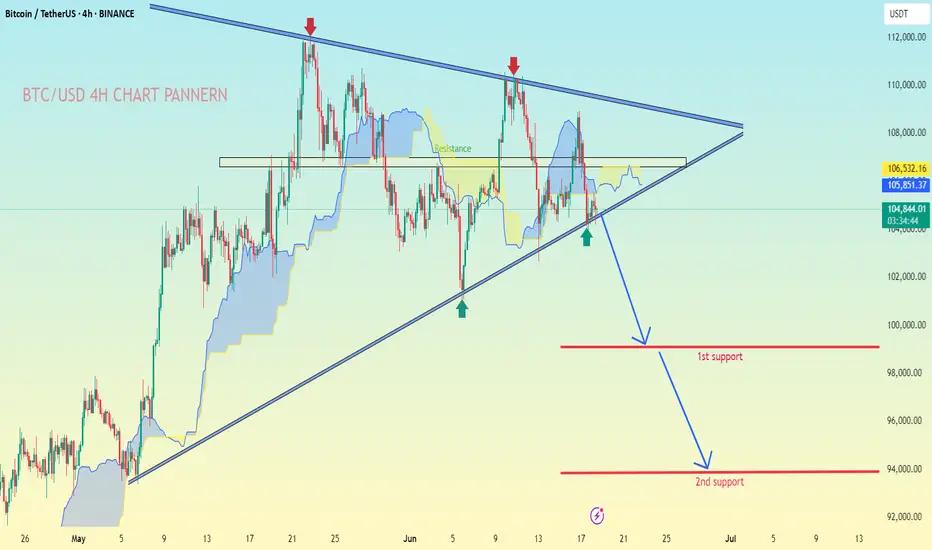
BTC/USD.4H CHART PATTERN.Based on MY BTC/USDT 4H chart the following analysis and price targets apply:
---
📉 Chart Pattern:
A symmetrical triangle pattern is visible, with price nearing a potential breakdown.
You’ve marked a breakdown scenario, supported by the Ichimoku cloud turning bearish and resistance rejection.
The market has respected both support and resistance trendlines multiple times, increasing pattern validity.
---
🎯 Bearish Targets After Breakdown:
1st Support Target:
Level: Around $98,000
This is the first zone where buyers might step in. It aligns with previous consolidation and structural support.
2nd Support Target:
Level: Around $94,000
This is a deeper support level and likely final target if selling pressure continues.
---
🔍 Summary:
Sell below: ~$104,000 (on breakdown confirmation)
Target 1: ~$98,000
Target 2: ~$94,000
Stop-loss suggestion: Above upper triangle trendline (~$106,500 or above recent high)
Let me know if you want a trading strategy with risk/reward ratio or SL/TP management tips.
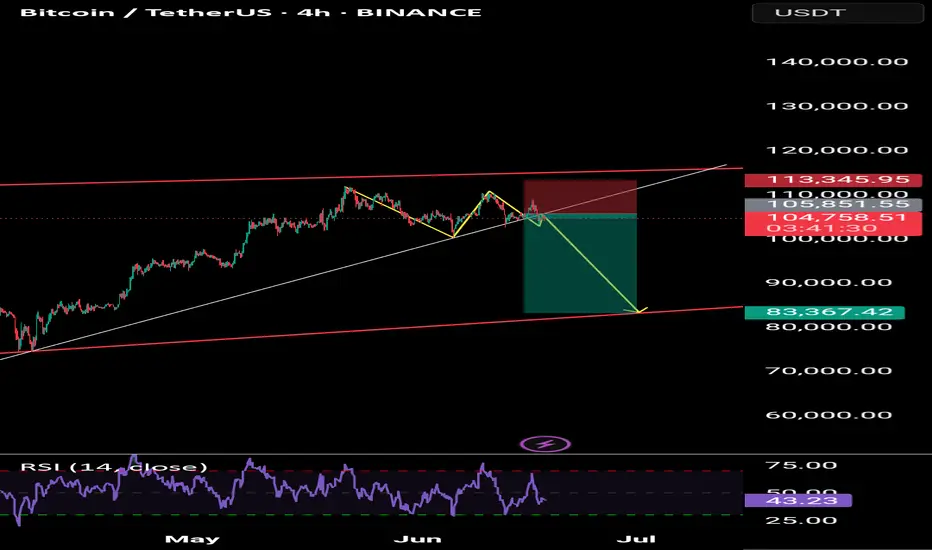
Bitcoin sell short go 83kBitcoin is ready for a heavy drop, just sell.
Do not take any buy or sell trades.
Technical Analysis of Bitcoin
From a market analysis perspective, the daily chart of the large cycle has closed with consecutive declines, the price is below the moving averages, and the indicator is in a death cross, indicating a bearish trend. However, it is necessary to be wary of the stimulation from the news and data caused by the current unstable national situation. In operation, risk control should be paid attention to, and the moving average pressure level near 106,000 on the daily chart should be focused on.
In the hourly chart of the short cycle, the decline continued in the European session after the morning decline yesterday, the U.S. session broke the low of the previous day, and the price rebounded and corrected at the support in the early morning. Currently, it is still in a corrective trend. Today, focus on the high pressure level in the 106,000 area, as well as the impact of the strength of the European session and the unemployment benefit data in the evening on the trend.
you are currently struggling with losses,or are unsure which of the numerous trading strategies to follow,You have the option to join our VIP program. I will assist you and provide you with accurate trading signals, enabling you to navigate the financial markets with greater confidence and potentially achieve optimal trading results.

HTF Consolidation: Key Alerts, Vital Supports, FOMC & Geopolitic__________________________________________________________________________________
Technical Overview – Summary Points
__________________________________________________________________________________
Momentum: Strong bullish signal across sector indicators (Risk On / Risk Off Indicator), especially on daily and 12H. Momentum remains robust within consolidation.
Support/Resistance : Key zone at 104429–102600 (short- and long-term pivots); major resistance at 106000–109950.
Volume : Normal to high, with peaks at major supports on 1H/2H (potential sign of absorption/defensive buying).
Behavior across timeframes :
ISPD neutral on most TFs, only 2H gives a buy signal (possible tactical bounce).
All LTFs (≤1H) are down, HTFs (≥1D) are up → corrective structure, awaiting catalyst.
__________________________________________________________________________________
Strategic Summary
__________________________________________________________________________________
Overall bias : Underlying bullish, but market consolidates on key technical zones.
Opportunities : Swing buy at 104429/102600, tight stop below 100k, take profit 109950+.
Risk zones : Clear break below 100350/100000 invalidates the setup (risk-off or tactical short).
Macro catalysts : FOMC, Iran–Israel tensions, economic calendar (monitor Jobless Claims, Crude, Fed statement).
Action plan :
Capital preservation before FOMC.
Tactical entries only on key support; tight stops, prudent sizing.
No breakout chasing without macro/fundamental validation.
Hedge/volatility play via options possible (IV low, caution for post-event spike).
__________________________________________________________________________________
Multi-Timeframe Analysis
__________________________________________________________________________________
1D/12H/6H :
Supports: 104429, 102626, 100353.
Resistances: 106000–109952.
Risk On / Risk Off Indicator = Strong Buy.
No extreme volume, ISPD neutral; mature range.
HTF consolidation, bullish underlying momentum.
4H/2H :
Key zone at 104429–102600 (technical defense); 2H is the first true behavioral buy signal.
Very high volume at support, favoring a "spike bounce" scenario.
“Up” confluence on Risk On / Risk Off Indicator, volume, and ISPD for short-term bounce.
MTFTI: 2H is one of the “Up” TFs; LTFs remain Down.
1H/30min/15min :
Structurally bearish, elevated volume (absorption/protection) on 1H.
No behavioral excesses.
Intraday weakness but supports tested and defended.
__________________________________________________________________________________
Macro / Fundamental analysis
__________________________________________________________________________________
Market in wait-and-see mode : FOMC upcoming, no hike expected but high impact from tone/forward guidance (increased volatility risk).
Geopolitics : Iran–Israel escalation, risk-off climate, nervous risk assets.
On-chain : Supports tested (STH ~97.6k). Persistent LTH accumulation. Low option IV → underpriced volatility risk.
Risk/Reward swing : 2:1/3:1 buying 104429–102600, stop < 100k, take profit 109950+.
__________________________________________________________________________________
Final synthesis: Bias, Opportunities, Risks
__________________________________________________________________________________
Directional bias : Bullish on HTF, neutral/undecided on short-term. Wait-and-see until strong catalyst confirmed (FOMC, geopolitical de-escalation).
Opportunities : Tactical buy on supports, profit-taking on resistance or confirmed breakout.
Risks : Invalidation below 100k; sudden spike in FOMC/Israel–Iran escalation = risk-off or selloff.
Recommended action : Protect capital before FOMC. Swing tactical entry only on confirmed support. No breakout chasing without macro validation. Leverage potential post-FOMC vol spike via options.

Bitcoin Double TopDouble top formation and now in support line and support trendline
if this line break, it will give rug and rug in altcoin, and maybe bitcoin can heading to 94k
But if bitcoin can solid above the lines, we can expect sideway with resist in 110k