BTCUSDT Long-Term Roadmap: From Capitulation to a $310K BreakoutAfter a confirmed breakdown from both the ascending trendline and the horizontal support near $110,000, BTCUSDT has entered a bearish phase. However, the projected green candles in your forecast suggest a long-term recovery structure—a potential accumulation phase, followed by a breakout cycle toward a new all-time high at $310K.
📈 Long-Term Phases in the Projection:
1. Phase One: Capitulation & Accumulation (~$65K–$90K)
BTC breaks down below $100K, potentially finding support between $65K and $90K.
This becomes a classic accumulation zone, where smart money begins to position.
Volatility decreases, and price action flattens while volume builds.
2. Phase Two: Recovery & Structure Break (~$105K–$110K reclaim)
Price reclaims the broken support at $105K–$110K, now acting as resistance.
A successful flip of this level into support signals the start of a new bullish cycle.
Market sentiment starts to shift from fear to cautious optimism.
3. Phase Three: Expansion Phase ($110K → $180K)
Once past $110K, BTC enters a momentum-driven rally.
Important psychological levels like $120K, $150K, and $180K are reached.
Institutions and retail FOMO begin re-entering the market.
4. Phase Four: Mid-Cycle Reaccumulation (~$180K–$210K)
BTC consolidates in a wide range, forming a reaccumulation base.
This becomes the launchpad for the final parabolic leg upward.
Market disbelief turns into euphoria.
5. Phase Five: Parabolic Rally to $310K
Once $230K–$250K resistance is cleared, BTC enters parabolic mode.
Targeting the macro top at $310,000, aligning with a future cycle peak (likely post-halving cycle).
Could happen within 12–24 months, depending on macro and cycle momentum.
🔍 Key Technical Conditions to Watch:
Successful reclaim of $110K on high timeframe (weekly close)
Formation of a higher low above $90K
Volume confirmation during breakout of $150K and $180K
Break and hold above $230K confirms macro breakout
BTCUSDT.PS trade ideas
BTC- Can it reach 97Kish?As thing suggests the move can only be done when heavy fall is there, but as suggests lets small scalp things to our best!
BTC/USDT Long Trade Setup – 1H Chart AnalysisBTC/USDT Long Trade Setup – 1H Chart Analysis
BINANCE:BTCUSDT
Hello traders! Sharing a recent long entry I took on Bitcoin (BTC/USDT) based on price action and liquidity concepts. This trade is taken on the 1-hour timeframe and aligns with my strategy of combining liquidity sweeps, support zones, and market structure shifts.
---
🔍 Trade Overview:
Entry Price: 104,704 USDT
Stop Loss: 103,660 USDT
Take Profit (Target): 108,349 USDT
Risk-to-Reward Ratio (RRR): Approximately 1:3
---
🧠 Trade Idea Behind the Entry:
As you can see on the chart, BTC had been in a downtrend and recently made a strong move into a key liquidity zone. This zone had previously seen multiple touches and rejections, making it an area of interest for both buyers and sellers.
The price swept liquidity below the previous low (labelled as “Liquidity Sweep $$$”), grabbing stop losses of early buyers and triggering limit orders of smart money. This move into the liquidity zone was followed by a strong bullish reaction – a signal that buyers may be stepping in.
Additionally, the "Break of Structure" (BOS) confirms a potential shift in market direction. The reaction from the liquidity zone indicates that this level is holding as new support.
---
🛠️ Why I Took the Trade:
1. Liquidity Sweep: The wick that pierced the liquidity zone signals stop-hunting and accumulation. These moves often precede a strong reversal.
2. Demand Zone Reaction: After the sweep, the candle closed bullish inside the demand box. This shows buyer strength.
3. Risk Management: The stop loss is set just below the liquidity zone to protect from deeper sweeps while keeping the RR healthy.
4. High Probability Target: The target is placed near the next resistance level around 108,349, which also aligns with a clean imbalance that price may want to fill.
---
📊 Technical Confidence:
Confluence Factors:
✅ Liquidity sweep
✅ Demand zone reaction
✅ Market structure shift
✅ High RR
✅ No immediate resistance till target
This type of setup reflects smart money behavior – first pushing price below structure to grab liquidity and then reversing sharply. The bullish momentum after the sweep gave extra confirmation.
---
🧭 What I’m Watching Now:
I will continue monitoring how price reacts around the 105,500–106,000 range. If momentum continues with higher highs and higher lows, I may trail my stop loss to lock in profits.
---
Let me know what you think of this setup! Have you taken a similar trade or are you waiting for confirmation? Drop your thoughts or charts below 👇
Stay disciplined, manage your risk, and trust the process. 🚀
#Bitcoin #BTCUSD #PriceAction #LiquiditySweep #SmartMoney #CryptoTrading #TradingSetup #TechnicalAnalysis #TradeJournal

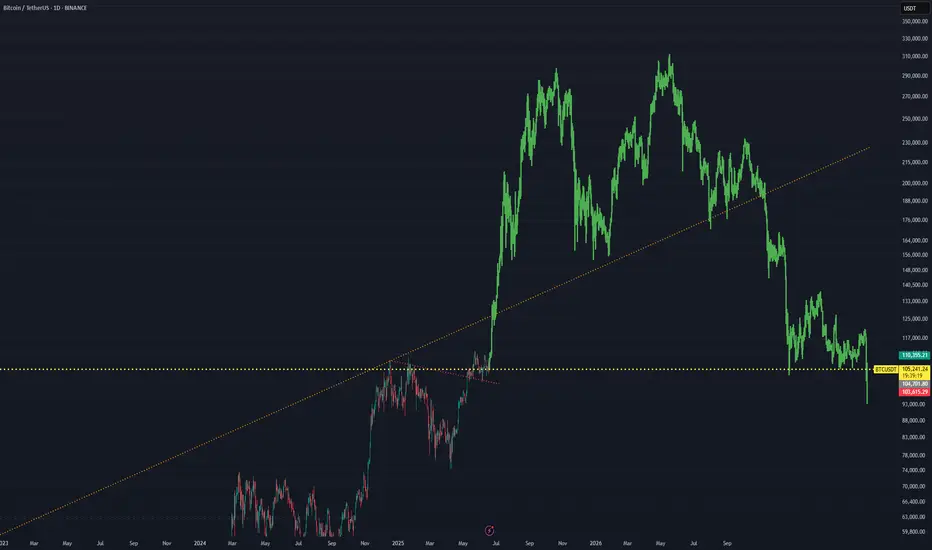
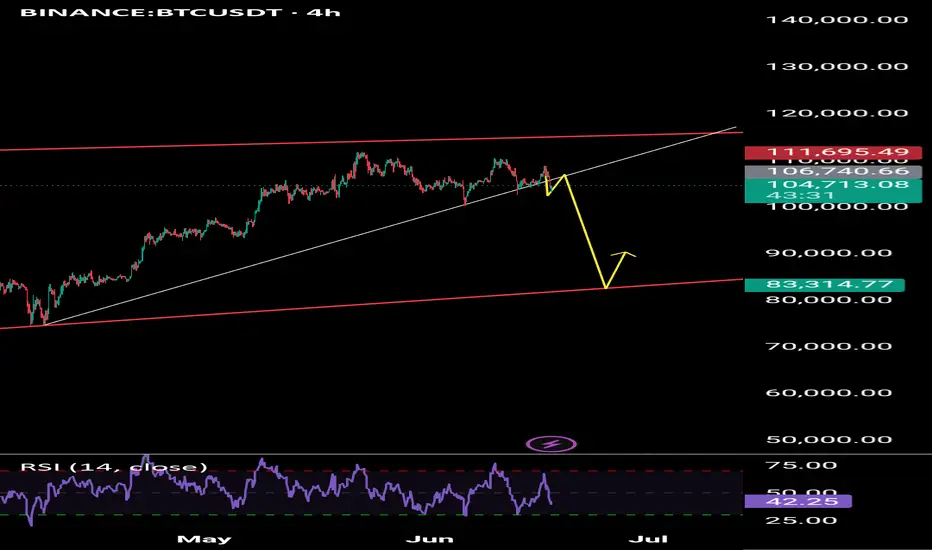
#Bitcoin Roadmap for 2025–2026 A Deep Corrective Scenario UnfoldI believe the major top for Bitcoin was already printed on May 21st, at $111,000.
From here, I expect a three-wave corrective structure to unfold:
• 🔻 First drop to $69,000
• 🔼 Then a relief bounce to $85,000
• 🔻 Followed by a deeper decline to $46,000
If Bitcoin breaks the historical ascending trendline after reaching $46,000, I anticipate a five-wave bearish structure to continue:
• Further drop to $33,000
• Temporary correction up to $45,000
• And finally, a capitulation wave towards $19,000
I know this may sound early or even extreme to some, but if you review my previous Bitcoin outlooks going back to 2014, you’ll notice that many of these scenarios—however bold—have eventually played out with precision.
📌 Invalidation Level:
This scenario would be invalidated if Bitcoin closes a weekly candle above $115,000.
Good luck, fellow traders—stay sharp and prepared. 🧠📉
⸻

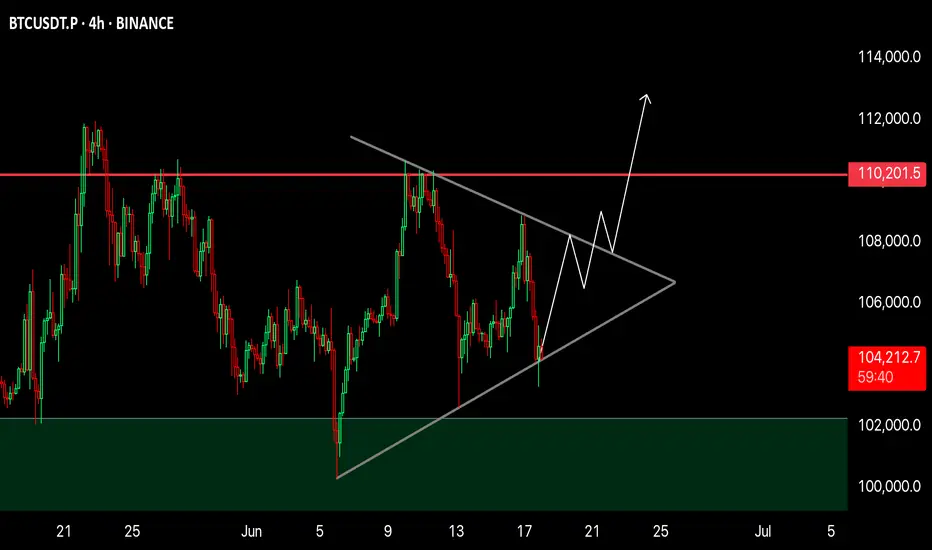
BTC 4H Analysis📈 BTC 4H Analysis – Symmetrical Triangle Breakout Loading
Bitcoin is currently consolidating inside a Symmetrical Triangle, forming higher lows and lower highs – a classic sign of volatility compression.
🔹 Structure: Symmetrical Triangle
🔹 Support Holding Strong – bulls defending the zone
🔹 Breakout Expected Soon
🔹 Major Resistance: $110,200
🔹 Breakout Target: $112,000+
Price is coiling up. Break above the triangle = strong bullish continuation likely.
🚀 Eyes on breakout — next move could be explosive!
NFA | DYOR
Next Volatility Period: Around June 22
Hello, traders.
If you "Follow", you can always get new information quickly.
Have a nice day today.
-------------------------------------
(BTCUSDT 1M chart)
The morning star candle that we often heard about when studying candles appeared.
However, since the candle has not closed yet, the shape of the candle may change.
In stock charts, there were cases where the movement could be predicted with the shape of these candles, but in the coin market, it is impossible to predict.
The reason is that trading is possible 24 hours a day.
Most candle shapes occur with gaps, allowing for a comprehensive interpretation, but in the coin market, gaps are not likely to occur, so I think there is nothing that can be known from the shape of the candles.
Therefore, it is recommended not to try to analyze the chart with the actual shape or pattern of the candles.
However, you need to study to be able to read the arrangement of the candles in order to set support and resistance points.
Even this is not difficult to indicate support and resistance points because there are indicators that indicate support and resistance points.
-
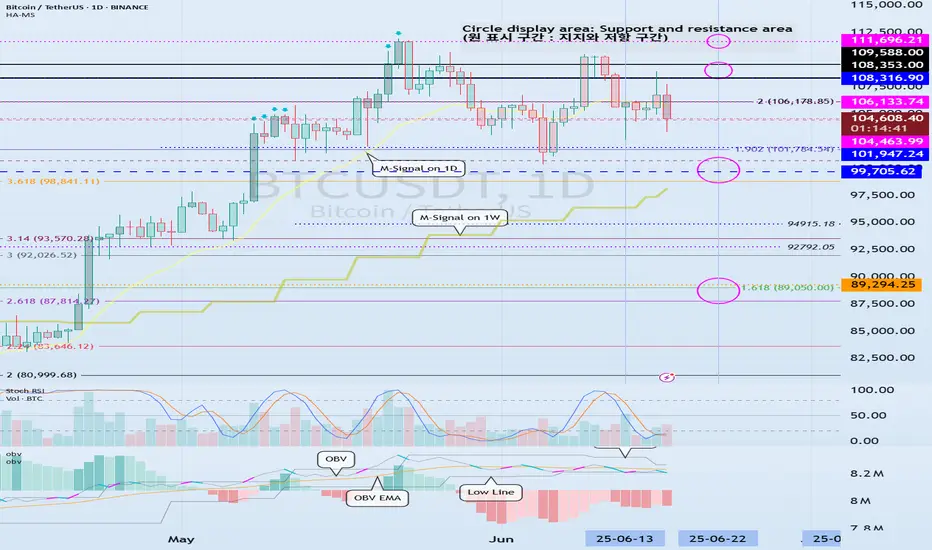
(1W chart)
The 104463.99 point is the DOM (60) indicator point, which corresponds to the end of the high point.
Also, the 99705.62 point is the HA-High indicator point, which corresponds to the middle of the high points.
Therefore, the 99705.62-104463.99 section can be interpreted as the high point boundary section.
The actual trend is likely to occur while falling from 99705.62.
The importance of the 99705.62 point is increasing because the M-Signal indicator on the 1W chart is rising near the HA-High indicator point.
If it falls below the M-Signal indicator on the 1W chart, it is possible that the trend will be determined again when it meets the M-Signal indicator on the 1M chart.
Also, if it falls from the HA-High indicator, it can meet the HA-Low indicator.
Therefore, if the price starts to fall, you should check whether the HA-Low indicator is generated.
The fact that the HA-Low indicator was created means that it rose from the low range.
That is, just as the HA-High indicator corresponds to the midpoint of the highs, the HA-Low indicator corresponds to the midpoint of the lows.
The end point of the lows corresponds to the DOM(-60) indicator point.
-
(1D chart)
For this reason, it is important to see support around 104463.99-106133.74.
The trend is likely to appear after the next volatility period, around June 22nd (June 21st-23rd).
Therefore, we should consider the 104463.99-106133.74 range as the middle range,
- and see if it falls below 99705.62,
- or rises above 108316.90.
Accordingly, we should create a response strategy and be prepared not to panic when a trend appears.
-
The OBV is currently below the Low Line.
Therefore, if it does not receive support at the 104463.99 point, it is likely to fall again.
Since the OBV oscillator is still below the 0 point, we can see that the selling pressure is strong.
However, looking at the overall movement of the oscillator, we can see that the selling pressure is decreasing.
Therefore, if there is another decline, the key issue is whether there is support near 99705.62.
-
In summary, the area around 104463.99 is playing an important role as support and resistance.
Therefore, after the next volatility period, around June 22, we need to check and respond to the direction in which it deviates from the 99705.62-108316.90 range.
-
Thank you for reading to the end.
I hope you have a successful trade.
--------------------------------------------------
- This is an explanation of the big picture.
(3-year bull market, 1-year bear market pattern)
I will explain more details when the bear market starts.
------------------------------------------------------
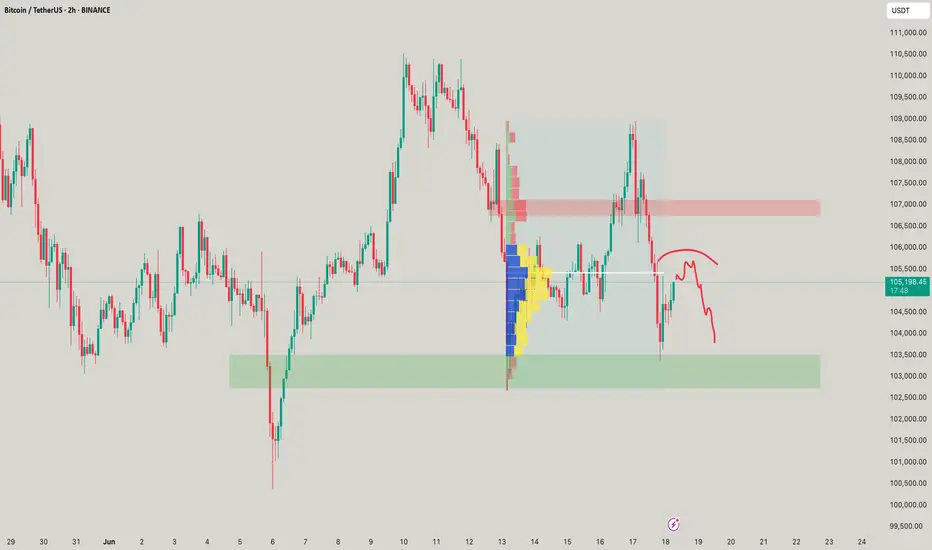
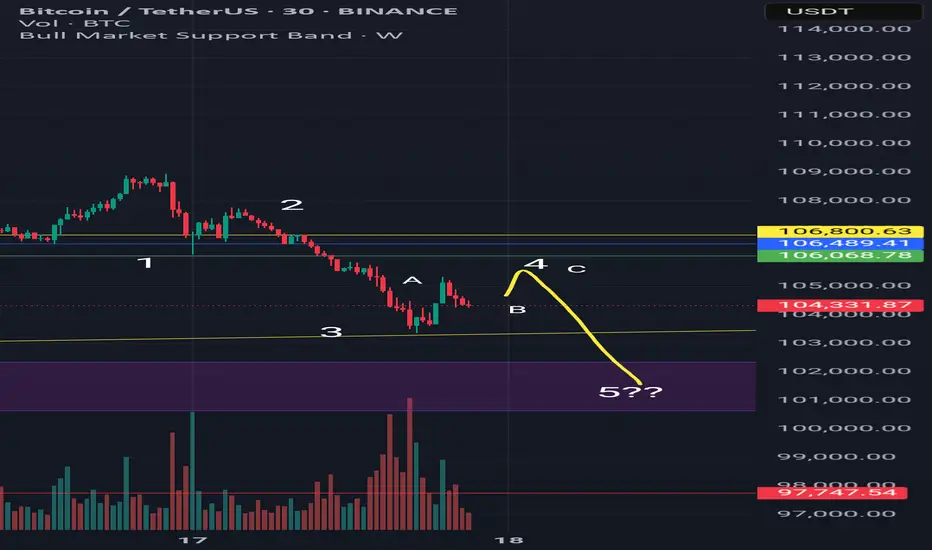
Most likely scenario for BitcoinI am tired of all analysts just saying that we are going down to 70k or up to 200k in one go.
So let me add a small informative chart for all people new or lost.
Don't get me wrong, i am bullish mid and long term but right now we are in the middle of a strong correction but shouln't last long.
We could have been super bullish above 106k but the price broke down with strength.
Now we see a super clear 5 wave movement down.
Currently we are in the 4 wave, trying to bounce back to the 106k area and doing a classic 4 wave ABC correction.
The bounce lacks volume so the most likely scenario is completing the 5 wave. We might get to the 101k area and ONLY THEN we can see what could happen.
If you are a futures trader, do it with caution and small leverage.
If you are a long term investor, these are perfect areas to buy more.
Good day to everyone.
Bitcoin Short-Term 4H Timeframe, Still Bullish But...Bitcoin continues bullish on the 4H timeframe and we have some positive signals coming out of the most recent swing and shakeout.
» The action went below 0.618 but is back above this level.
» The higher low did not reach 0.786 Fib. retracement support, which is a signal of strength.
» Trading volume continues to rise and as the action happens above $100,000, this signal works in favor of the bulls.
Short-term, Bitcoin continues green with the bulls in full control of the chart. When in doubt, zoom out; Crypto is going up.
This is obviously a consolidation pattern because we have higher lows but also lower highs. The revealing signal of course comes from the altcoins, look at Bitcoin Cash and you can get a good example.
The market will resolve bullish once the consolidation ends.
I say this based on market data and the charts.
If you agree leave a comment.
Thank you for reading.
Namaste.
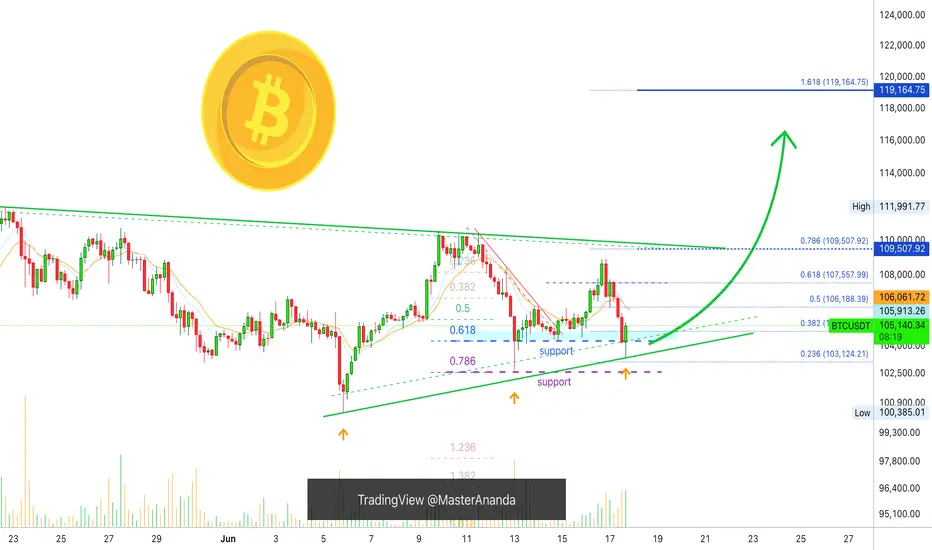
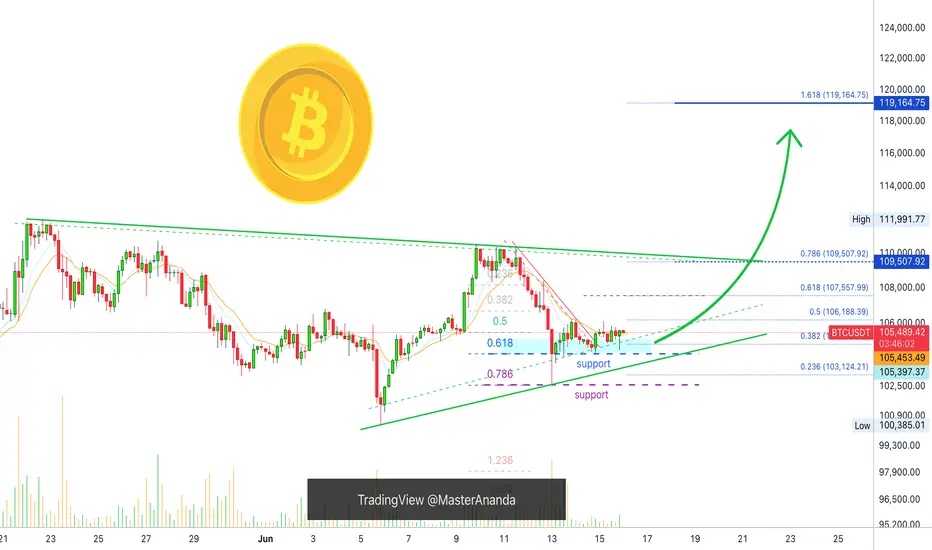
Bitcoin Mid-Term, 4H Timeframe, Bullish ($119,165 Next Target)On the 4H timeframe we have a consolidation pattern with a bullish bias. Bitcoin is aiming higher after a close above EMA8 & 13 with higher lows.
The drop 13-June found support perfectly at 0.786 Fib. retracement on a wick. The session closed above 0.618. The action turned bullish immediately and we are seeing slow but steady growth.
The recent drop was a market reaction due to a geopolitical situation. As soon as the event is priced in, the market seeks balance and goes back to its previous trend.
Bitcoin's bullish bias is not only supported by strong prices, $105,600 is very strong, but also by the altcoins and the cyclical nature of the market.
While Bitcoin already produced several new all-time highs this year the altcoins are yet to do the same. A bull market happens every four years or the year after the halving. For Bitcoin this is already true but this is a marketwide event and the altcoins are yet to go there and this is a bullish factor and soon this will be obvious on the chart.
We are 5-6 days away only from very strong bullish action. Notice that this isn't a long time, it is less than a week. The altcoins will reveal this bullish bias much sooner than Bitcoin but Bitcoin will also grow and hit a new all-time high soon. This new all-time high will be the catalyst for everything to boom.
» Ignore the short-term it is all noise—crypto is going up.
The next target is $107,558, followed by $109,508 on this timeframe. The latter being a mild resistance.
The main target here is $119,165 and this is a good resistance zone. It can be rounded up to $120,000. If this level gets hit it will only confirm additional growth. The target that follows is $130,000 and the minimum for this cycle is $160,000 but we are aiming higher.
Feel free to follow for more.
I will continue to detail Bitcoin on all the timeframes as well as many of the top, mid- and small altcoins.
Thank you for your support.
It is appreciated.
Namaste.
BTC for long *The content on this analysis is subject to change at any time without notice, and is provided for the sole purpose of assisting traders to make independent investment decisions.
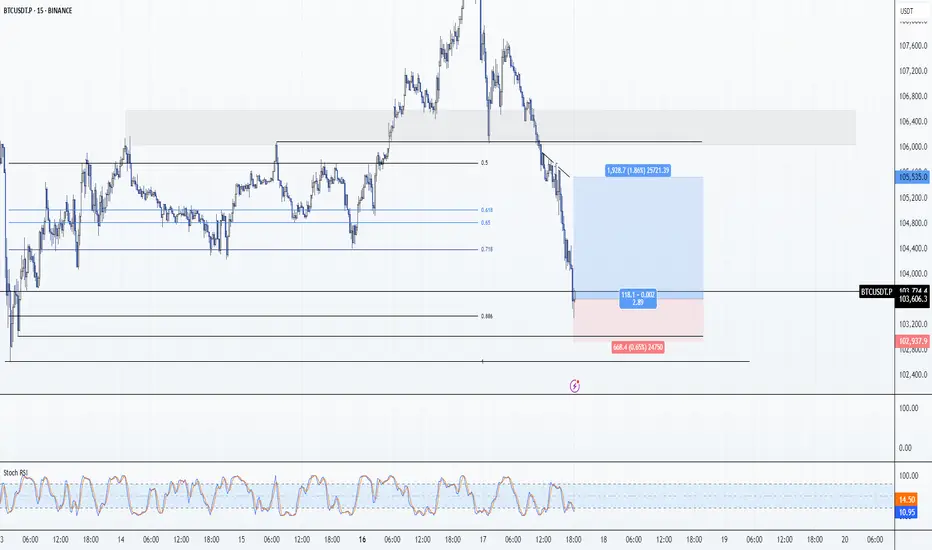
BTC long if it reclaims or holds ### 🔍 Breakdown of Chart:
* Timeframe: 15m BTCUSDT (Bybit)
* Current Trend: Sharp downtrend from the recent highs
* Zone Marked in Blue: Bullish Order Block / Demand Zone
* Yellow Path: Anticipated reclaim and reversal scenario
* White Curve: Possible double bottom (liquidity sweep)
---
### ✅ Why Long Plan Makes Sense:
1. Demand Zone (Blue Block):
This zone has previously caused a strong bullish reaction. It's likely institutional demand may rest here again.
2. Liquidity Grab Below:
Price might sweep the recent low (creating a trap for shorts) before reclaiming. That’s your “double bottom” logic.
3. Reclaim = Confirmation:
Waiting for a reclaim above the zone before longing shows patience and discipline — a smart move to avoid catching a falling knife.
4. Clear Invalidations:
If price fails to reclaim and breaks below the blue zone with momentum, your setup is invalidated — perfect risk control.
---
### ⚠️ Caution:
* If the red bearish OB above (around 104.6–104.8K) is respected, you might face rejection there. Consider partial profits before that area.
* Use confirmation (like a bullish engulfing, BOS, or FVG fill) after reclaim.
* If breaks blue zone then we might enter short

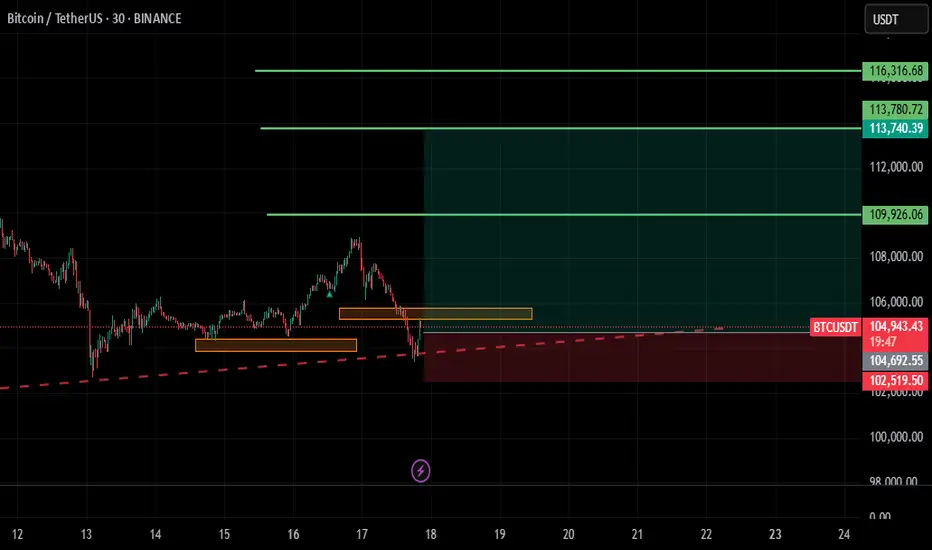
BTC: Scalp Long 17/06/25Trade Direction:
BTC Scalp Long
Risk Management:
- 0.25% Risk
- High risk knife catch trade
Reason for Entry:
- 0.886 Retrace
- Weekly Open ideal area for short entries also lines up with a 0.5 corrective move for this leg.
- Oversold on 4 Macro TFs (M15,M30,H1,H2)
Additional Notes:
- Target Weekly Open
- High High Risk which = A very tiny risk on SL. My only trade of the day.
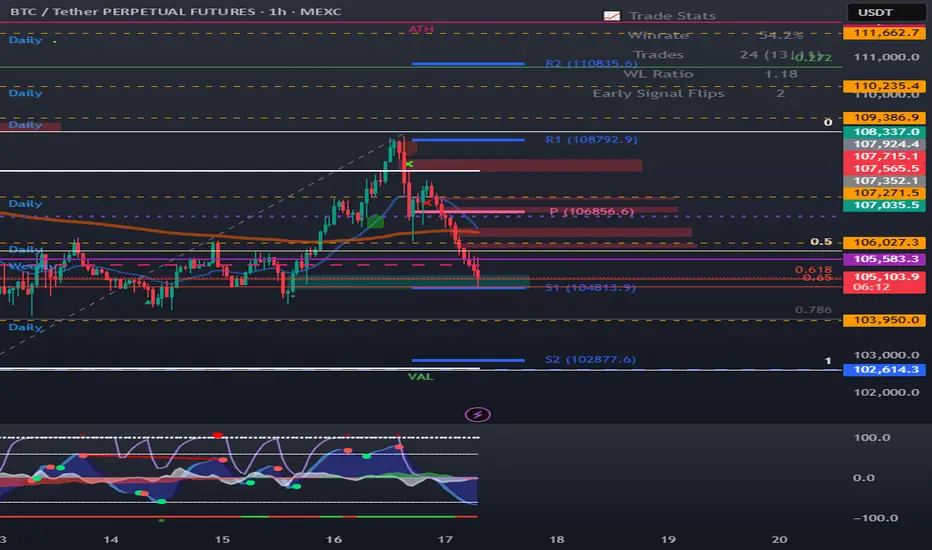
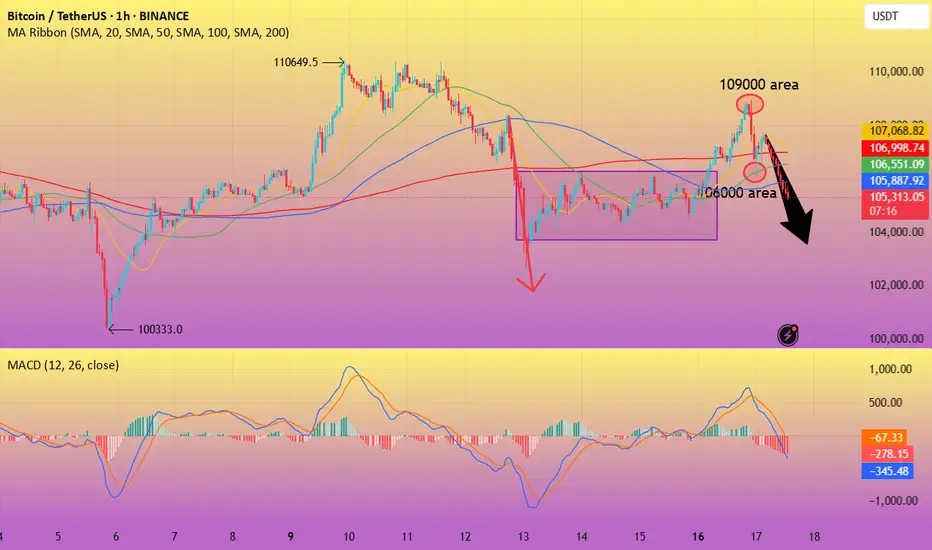
BTC-----Sell around 105500, target 104000 areaTechnical analysis of BTC contract on June 17:
Today, the large-cycle daily level closed with a small positive line yesterday, and the K-line pattern was a single positive line with continuous negative lines. The price was consolidating at a high level, but the attached indicator was dead cross, and the closing line yesterday was a long upper lead, and the high point was near the 109,000 area. Why is it difficult to continue the rise? The price did not break the previous high point, the continuity was poor, the technical indicators were not obvious, etc., which are all reference data; the short-cycle hourly chart showed that the European session rose yesterday, and the US session continued to break the weekend correction high position. The price fell under pressure, the intraday high was 109,000 area, and the intraday retracement low was 106,000 area. There is no obvious direction at present, so the European and American sessions are the focus, so pay attention to the strength and weakness of the European and American sessions and the breakout situation, and then we will layout according to the real-time trend. The European and American sessions are currently showing a downward trend.
Today's BTC short-term trading contract strategy:
The current price is 105,500 and directly short, stop loss in the 106,000 area; the target is the 104,000 area;
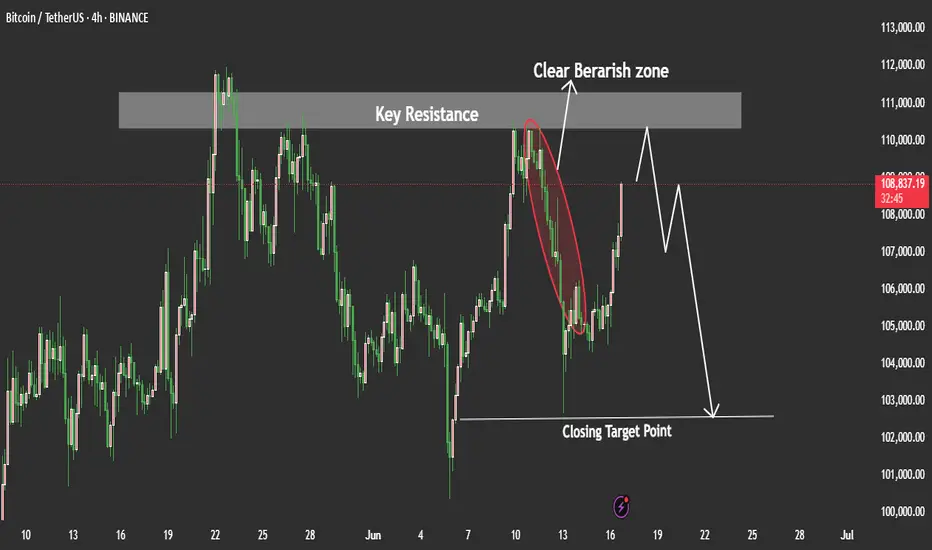
BTCUSDT Price may Test as Short TermBTC/USDT Price Analysis (Interpretation):
BTC/USDT recently tapped into a well-defined rejection zone on the 4H and Daily timeframes. This zone has previously acted as strong resistance.
Given this, we could expect a potential move to the downside unless the price breaks above that rejection zone with strong momentum. However, before the downside move fully plays out, there is a chance the price may retest the 102,500 level again — possibly as a liquidity grab or a false breakout — before resuming a bearish push. My Goal is 102,500 lets we see how how the price will plays out.
if you like tis idea and if you find good thing in this analysis share in comments we need support from you Guys.
#BTC Update Urgent. CRYPTOCAP:BTC Update:
Bitcoin is making another attempt to test the $102K support level.
Expecting a bounce around the 100k area if we reach there.
This level is holding strong, backed by two key EMAs and high liquidity concentration.
Just be careful with longs.
Monday’s pump faded quickly, a clear sign of weakness.
This is exactly why staying on the sidelines was the right call.
If you're holding stables, you're not losing in this volatility.
I’ll continue monitoring the price action closely.
It’s better to enter higher with solid confirmations than to gamble on local dips.
Altcoins are still struggling; stay cautious.
More updates soon.
Stay tuned.
Do hit the like button if you like it.
Thank you
#PEACE
Test the crucial round-number threshold of $100,000.Affected by sudden news factors, the Bitcoin market has seen sharp fluctuations. The price started a significant downward trend from the $108,900 level and has dropped to around $104,000 as of now. This decline has caused Bitcoin to break through multiple key support levels.
On the daily timeframe, the originally important support range of $106,000 - $107,000 was easily breached, with market bearish forces gaining absolute dominance. Bitcoin is facing significant downward risks and is highly likely to continue falling to test the crucial psychological level of $100,000.
you are currently struggling with losses,or are unsure which of the numerous trading strategies to follow,You have the option to join our VIP program. I will assist you and provide you with accurate trading signals, enabling you to navigate the financial markets with greater confidence and potentially achieve optimal trading results.
Trading Strategy:
sell@104000-104500
TP:102000-1025000

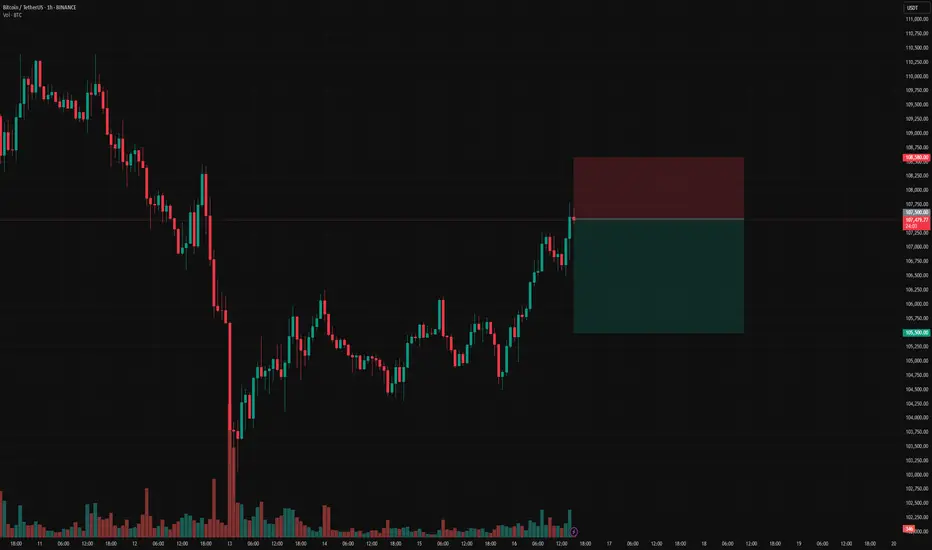
BTCUSDT ShortSet-up: Fade breakouts inside 2‑day 1 % VWAP band
Entry: $107 k‑$107.5 k
Stop: 0.5% -> 108k
Target: Re‑enter VWAP mean $105.5 k
R:R: 3:1
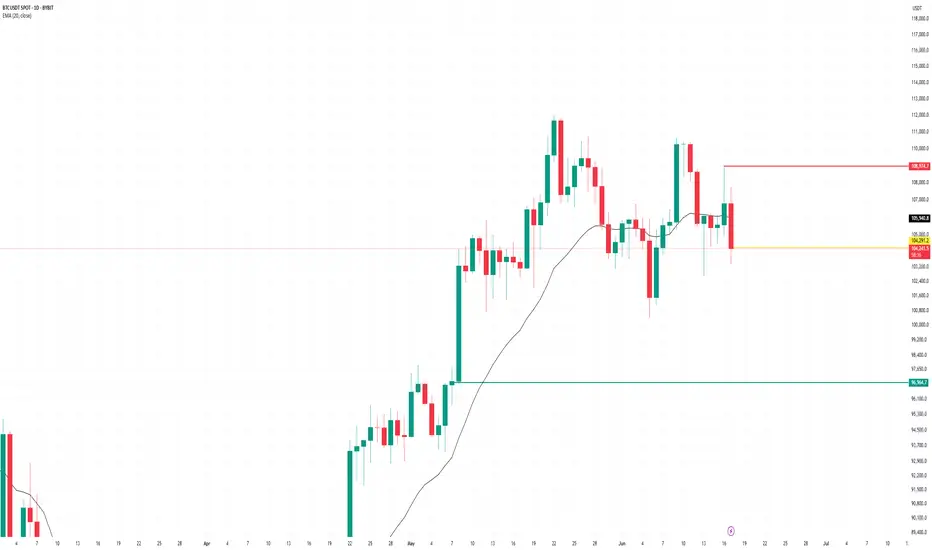
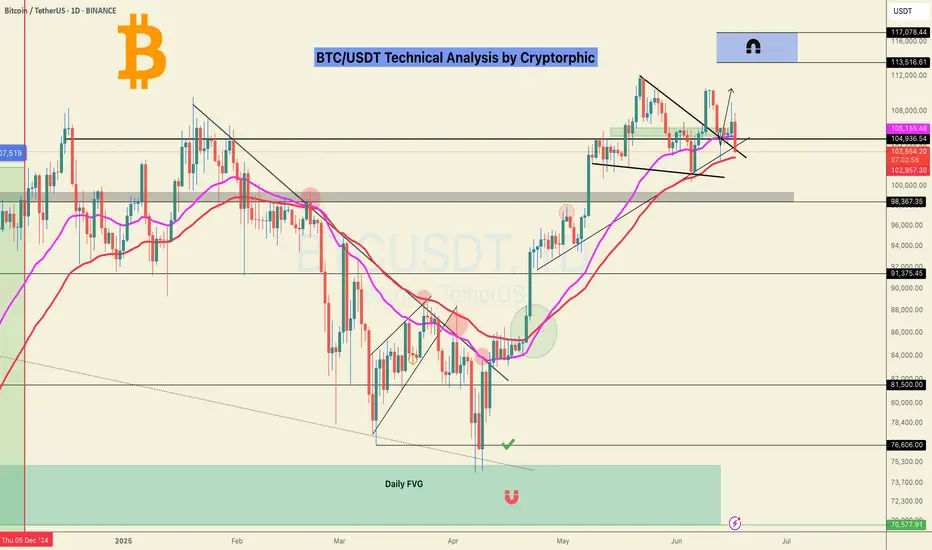
Bitcoin running the tables since launching from 84k base on 4/20After forming a base of $84K, Bitcoin departed this level on April 20th and has held the 50 Day SMA ever since.

As I said earlier, the real correction is STARTING right now!Hello, everyone! I started writing this review when Bitcoin was at $105,200, and I'm finishing it at $104,150.
⚡️ So far, my thesis is completely correct — we filled the GAP at $104,763 and are going lower to collect liquidity and close the GAPs.
But let's take a look at where and when something might change:
➡️ Today, there is a vote on the stablecoin bill. It is being hyped up a lot and in the short term, it could be a catalyst for a small rebound. But in reality, it has no global value right now. And it will take a very long time to truly feel its impact. But this law is definitely a breakthrough.
➡️ June 18 — the Fed's interest rate decision. The market expects the rate to remain at 4.5%. But in a bearish momentum, anything other than a rate cut (and even that is not always the case) is a bearish catalyst. Remember April, when positive news came out in droves, but Bitcoin at $75,000 didn't care.
However, if the rate is lowered, we can definitely expect a rebound. But I don't think it will be very high.
⚙️ Metrics and indicators:
Money flow - in complete harmony with the price. Position closing and liquidity outflow continue. It is clear that most of it has flowed into ETH and altcoins. But don't forget that if Bitcoin goes down, this liquidity from altcoins will evaporate even faster.
Support/Resistance Zones - as we can see, the level of 105,500 - 106,000 is still key, and without consolidating above it, we are going down. As long as the price is below this level, it is a bearish signal.
Liquidation Levels - just look at the amount of liquidity from below. As we know, the price moves from one liquidity to another; it is literally its fuel. And now, there is simply no liquidity from above, but there is plenty of it from below.
📌 Conclusion:
So far, everything is quite predictable for me and my subscribers. So, leaning back in our chairs, we continue to enjoy the show and wait for real discounts!
Have a great week, everyone!

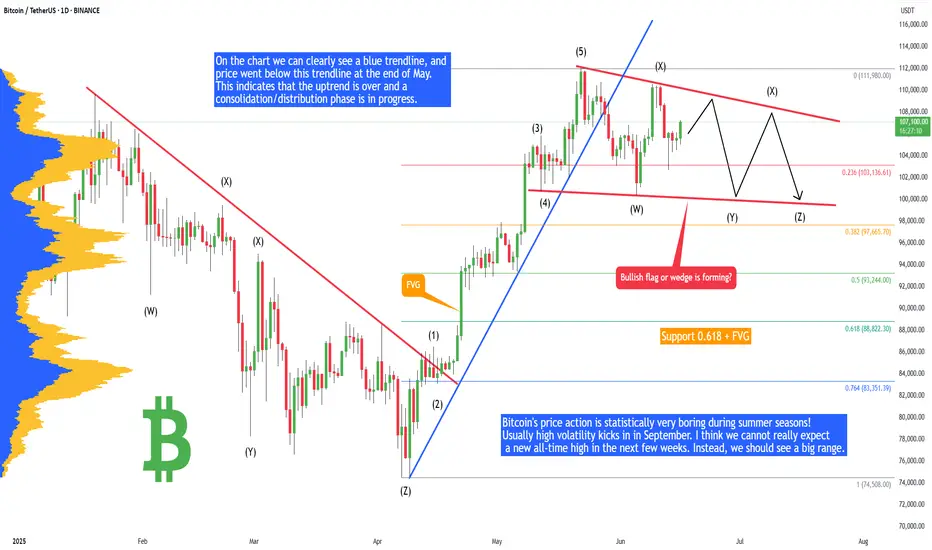
Bitcoin - Plan for summer 2025 (no new ATH, big range!)Bitcoin's price action is statistically very boring during summer seasons! Usually high volatility kicks in in September. I think we cannot really expect a new all-time high in the next few weeks. Instead, we should see a big range. Why? Let's take a look at technical analysis.
On the chart we can clearly see a blue trendline, and price went below this trendline at the end of May. This indicates that the uptrend is over and a consolidation/distribution phase is in progress. This phase is usually represented as a bull flag, triangle, rectangle, or wedge. When we look at the current price action, it looks like a bullish flag consolidation pattern. In this case we will probably see multiple liquidity sweeps below the previous swing lows to kick out early longs.
There are 2 types of traders. The first one they love to trade ranges, and the second they love to trade breakouts and higher volatility environments. Currently I think Bitcoin is creating a range, so do not expect any crazy movements until this range is valid.
Bullish flags are usually bullish patterns, but often they break down and act like bearish patterns. So what would happen if this bullish flag breaks down? That would send the price of Bitcoin to the 0.618 FIB, which is at 88,882 USDT. What is this bullish flag breaks out? That would send the price of Bitcoin to 116,000 to 125,000, but to establish this price we first need to see low of the bull flag, which is not confirmed yet. I will definitely inform you in one of my next analyses, so write a comment with your altcoin + hit the like button, and I will make an analysis for you in response.
At the end of each post, I share my professional trading tips: "If you realize you’ve made a poor trading decision, exit before the stop loss forces you out." Trading is not hard if you have a good coach! This is not a trade setup, as there is no stop-loss or profit target. I share my trades privately. Thank you, and I wish you successful trades!
BTC POC, Golden Pocket, S1, FVG confluence @ 105kBTC POC, Golden Pocket, S1, FVG confluence @105k
Nice confluence here for a bounce. I would take profit quickly though with bearish momentum still strong.