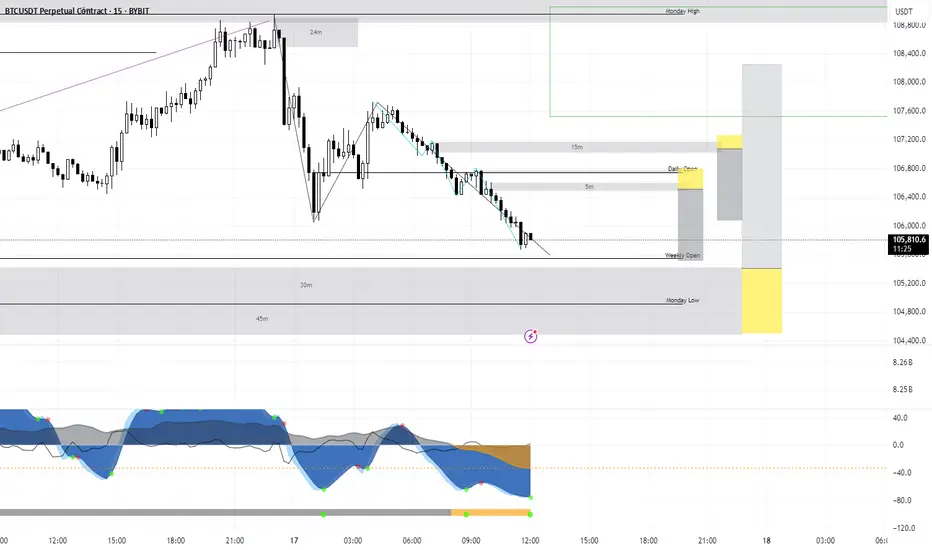
BTC long if it reclaims or holds ### 🔍 Breakdown of Chart:
* Timeframe: 15m BTCUSDT (Bybit)
* Current Trend: Sharp downtrend from the recent highs
* Zone Marked in Blue: Bullish Order Block / Demand Zone
* Yellow Path: Anticipated reclaim and reversal scenario
* White Curve: Possible double bottom (liquidity sweep)
---
### ✅ Why Long Plan Makes Sense:
1. Demand Zone (Blue Block):
This zone has previously caused a strong bullish reaction. It's likely institutional demand may rest here again.
2. Liquidity Grab Below:
Price might sweep the recent low (creating a trap for shorts) before reclaiming. That’s your “double bottom” logic.
3. Reclaim = Confirmation:
Waiting for a reclaim above the zone before longing shows patience and discipline — a smart move to avoid catching a falling knife.
4. Clear Invalidations:
If price fails to reclaim and breaks below the blue zone with momentum, your setup is invalidated — perfect risk control.
---
### ⚠️ Caution:
* If the red bearish OB above (around 104.6–104.8K) is respected, you might face rejection there. Consider partial profits before that area.
* Use confirmation (like a bullish engulfing, BOS, or FVG fill) after reclaim.
* If breaks blue zone then we might enter short
BTCUSDT.PS trade ideas

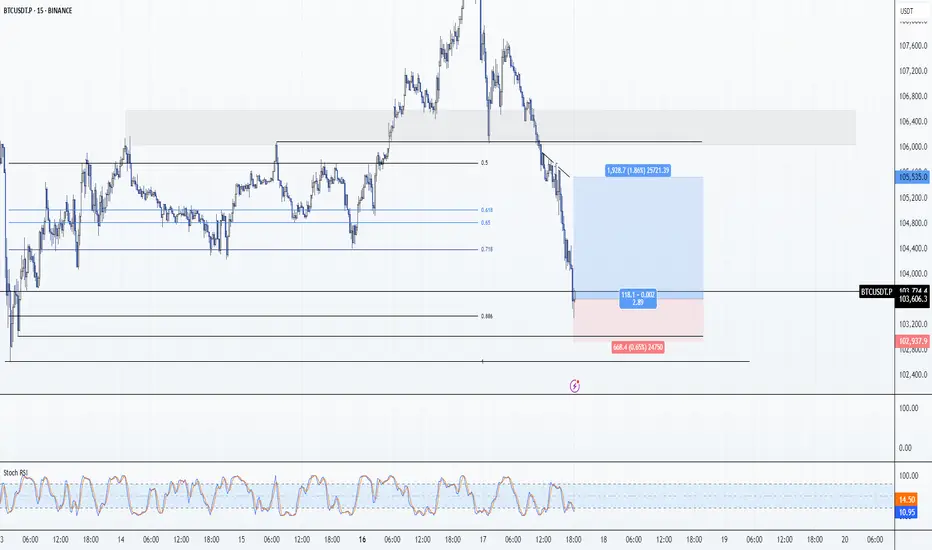
BTC: Scalp Long 17/06/25Trade Direction:
BTC Scalp Long
Risk Management:
- 0.25% Risk
- High risk knife catch trade
Reason for Entry:
- 0.886 Retrace
- Weekly Open ideal area for short entries also lines up with a 0.5 corrective move for this leg.
- Oversold on 4 Macro TFs (M15,M30,H1,H2)
Additional Notes:
- Target Weekly Open
- High High Risk which = A very tiny risk on SL. My only trade of the day.
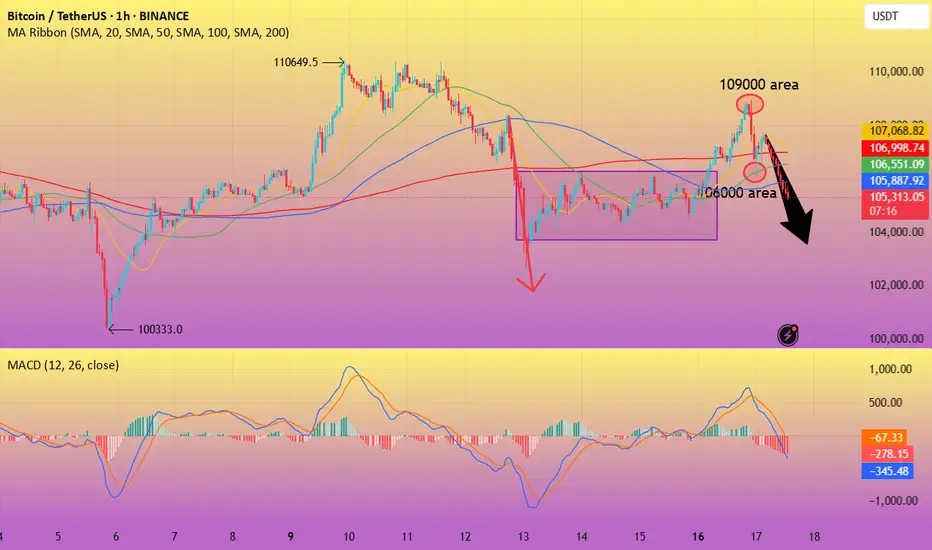
BTC-----Sell around 105500, target 104000 areaTechnical analysis of BTC contract on June 17:
Today, the large-cycle daily level closed with a small positive line yesterday, and the K-line pattern was a single positive line with continuous negative lines. The price was consolidating at a high level, but the attached indicator was dead cross, and the closing line yesterday was a long upper lead, and the high point was near the 109,000 area. Why is it difficult to continue the rise? The price did not break the previous high point, the continuity was poor, the technical indicators were not obvious, etc., which are all reference data; the short-cycle hourly chart showed that the European session rose yesterday, and the US session continued to break the weekend correction high position. The price fell under pressure, the intraday high was 109,000 area, and the intraday retracement low was 106,000 area. There is no obvious direction at present, so the European and American sessions are the focus, so pay attention to the strength and weakness of the European and American sessions and the breakout situation, and then we will layout according to the real-time trend. The European and American sessions are currently showing a downward trend.
Today's BTC short-term trading contract strategy:
The current price is 105,500 and directly short, stop loss in the 106,000 area; the target is the 104,000 area;
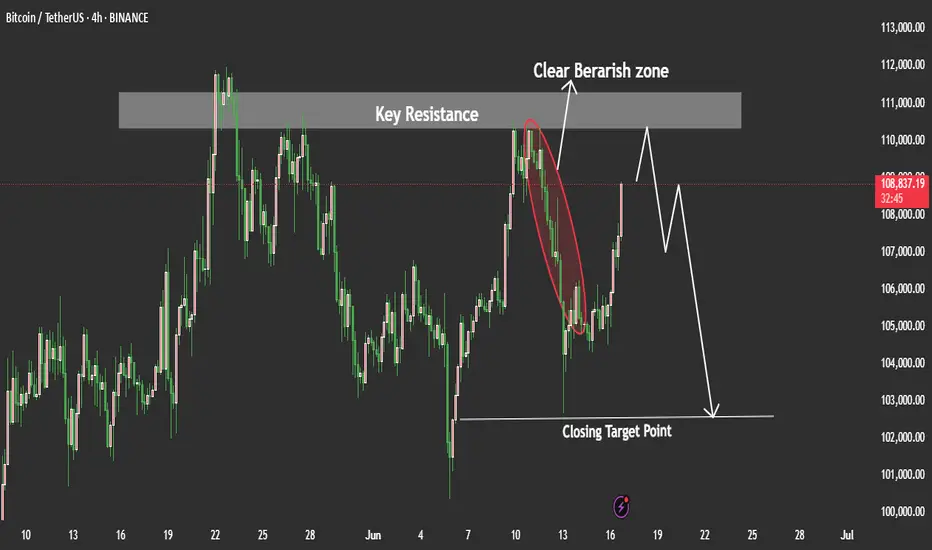
BTCUSDT Price may Test as Short TermBTC/USDT Price Analysis (Interpretation):
BTC/USDT recently tapped into a well-defined rejection zone on the 4H and Daily timeframes. This zone has previously acted as strong resistance.
Given this, we could expect a potential move to the downside unless the price breaks above that rejection zone with strong momentum. However, before the downside move fully plays out, there is a chance the price may retest the 102,500 level again — possibly as a liquidity grab or a false breakout — before resuming a bearish push. My Goal is 102,500 lets we see how how the price will plays out.
if you like tis idea and if you find good thing in this analysis share in comments we need support from you Guys.
#BTC Update Urgent. CRYPTOCAP:BTC Update:
Bitcoin is making another attempt to test the $102K support level.
Expecting a bounce around the 100k area if we reach there.
This level is holding strong, backed by two key EMAs and high liquidity concentration.
Just be careful with longs.
Monday’s pump faded quickly, a clear sign of weakness.
This is exactly why staying on the sidelines was the right call.
If you're holding stables, you're not losing in this volatility.
I’ll continue monitoring the price action closely.
It’s better to enter higher with solid confirmations than to gamble on local dips.
Altcoins are still struggling; stay cautious.
More updates soon.
Stay tuned.
Do hit the like button if you like it.
Thank you
#PEACE
Test the crucial round-number threshold of $100,000.Affected by sudden news factors, the Bitcoin market has seen sharp fluctuations. The price started a significant downward trend from the $108,900 level and has dropped to around $104,000 as of now. This decline has caused Bitcoin to break through multiple key support levels.
On the daily timeframe, the originally important support range of $106,000 - $107,000 was easily breached, with market bearish forces gaining absolute dominance. Bitcoin is facing significant downward risks and is highly likely to continue falling to test the crucial psychological level of $100,000.
you are currently struggling with losses,or are unsure which of the numerous trading strategies to follow,You have the option to join our VIP program. I will assist you and provide you with accurate trading signals, enabling you to navigate the financial markets with greater confidence and potentially achieve optimal trading results.
Trading Strategy:
sell@104000-104500
TP:102000-1025000

BTCUSDT ShortSet-up: Fade breakouts inside 2‑day 1 % VWAP band
Entry: $107 k‑$107.5 k
Stop: 0.5% -> 108k
Target: Re‑enter VWAP mean $105.5 k
R:R: 3:1
Bitcoin running the tables since launching from 84k base on 4/20After forming a base of $84K, Bitcoin departed this level on April 20th and has held the 50 Day SMA ever since.

As I said earlier, the real correction is STARTING right now!Hello, everyone! I started writing this review when Bitcoin was at $105,200, and I'm finishing it at $104,150.
⚡️ So far, my thesis is completely correct — we filled the GAP at $104,763 and are going lower to collect liquidity and close the GAPs.
But let's take a look at where and when something might change:
➡️ Today, there is a vote on the stablecoin bill. It is being hyped up a lot and in the short term, it could be a catalyst for a small rebound. But in reality, it has no global value right now. And it will take a very long time to truly feel its impact. But this law is definitely a breakthrough.
➡️ June 18 — the Fed's interest rate decision. The market expects the rate to remain at 4.5%. But in a bearish momentum, anything other than a rate cut (and even that is not always the case) is a bearish catalyst. Remember April, when positive news came out in droves, but Bitcoin at $75,000 didn't care.
However, if the rate is lowered, we can definitely expect a rebound. But I don't think it will be very high.
⚙️ Metrics and indicators:
Money flow - in complete harmony with the price. Position closing and liquidity outflow continue. It is clear that most of it has flowed into ETH and altcoins. But don't forget that if Bitcoin goes down, this liquidity from altcoins will evaporate even faster.
Support/Resistance Zones - as we can see, the level of 105,500 - 106,000 is still key, and without consolidating above it, we are going down. As long as the price is below this level, it is a bearish signal.
Liquidation Levels - just look at the amount of liquidity from below. As we know, the price moves from one liquidity to another; it is literally its fuel. And now, there is simply no liquidity from above, but there is plenty of it from below.
📌 Conclusion:
So far, everything is quite predictable for me and my subscribers. So, leaning back in our chairs, we continue to enjoy the show and wait for real discounts!
Have a great week, everyone!

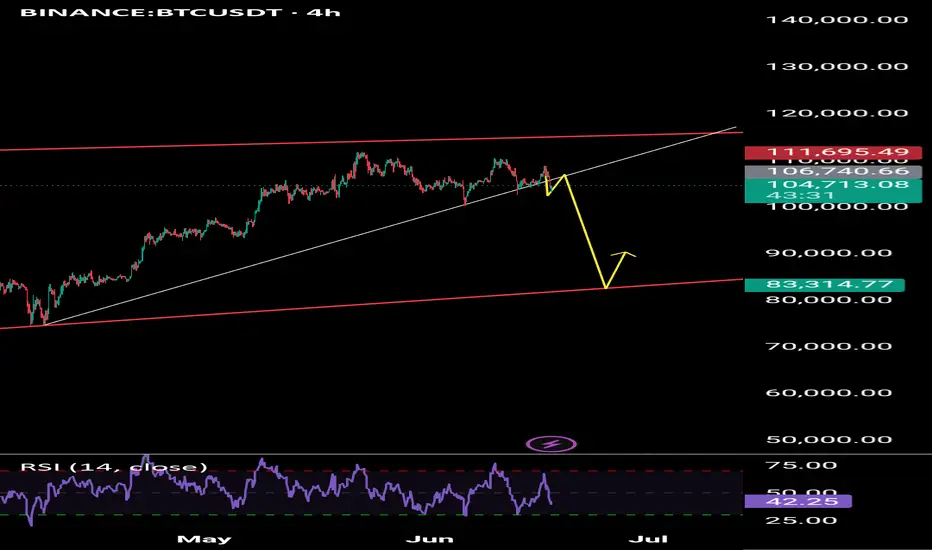
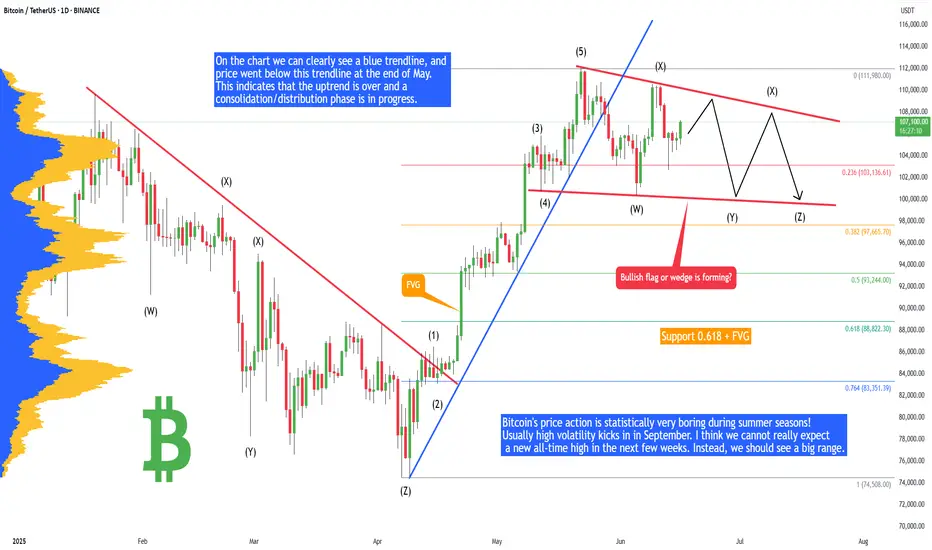
Bitcoin - Plan for summer 2025 (no new ATH, big range!)Bitcoin's price action is statistically very boring during summer seasons! Usually high volatility kicks in in September. I think we cannot really expect a new all-time high in the next few weeks. Instead, we should see a big range. Why? Let's take a look at technical analysis.
On the chart we can clearly see a blue trendline, and price went below this trendline at the end of May. This indicates that the uptrend is over and a consolidation/distribution phase is in progress. This phase is usually represented as a bull flag, triangle, rectangle, or wedge. When we look at the current price action, it looks like a bullish flag consolidation pattern. In this case we will probably see multiple liquidity sweeps below the previous swing lows to kick out early longs.
There are 2 types of traders. The first one they love to trade ranges, and the second they love to trade breakouts and higher volatility environments. Currently I think Bitcoin is creating a range, so do not expect any crazy movements until this range is valid.
Bullish flags are usually bullish patterns, but often they break down and act like bearish patterns. So what would happen if this bullish flag breaks down? That would send the price of Bitcoin to the 0.618 FIB, which is at 88,882 USDT. What is this bullish flag breaks out? That would send the price of Bitcoin to 116,000 to 125,000, but to establish this price we first need to see low of the bull flag, which is not confirmed yet. I will definitely inform you in one of my next analyses, so write a comment with your altcoin + hit the like button, and I will make an analysis for you in response.
At the end of each post, I share my professional trading tips: "If you realize you’ve made a poor trading decision, exit before the stop loss forces you out." Trading is not hard if you have a good coach! This is not a trade setup, as there is no stop-loss or profit target. I share my trades privately. Thank you, and I wish you successful trades!
BTC POC, Golden Pocket, S1, FVG confluence @ 105kBTC POC, Golden Pocket, S1, FVG confluence @105k
Nice confluence here for a bounce. I would take profit quickly though with bearish momentum still strong.
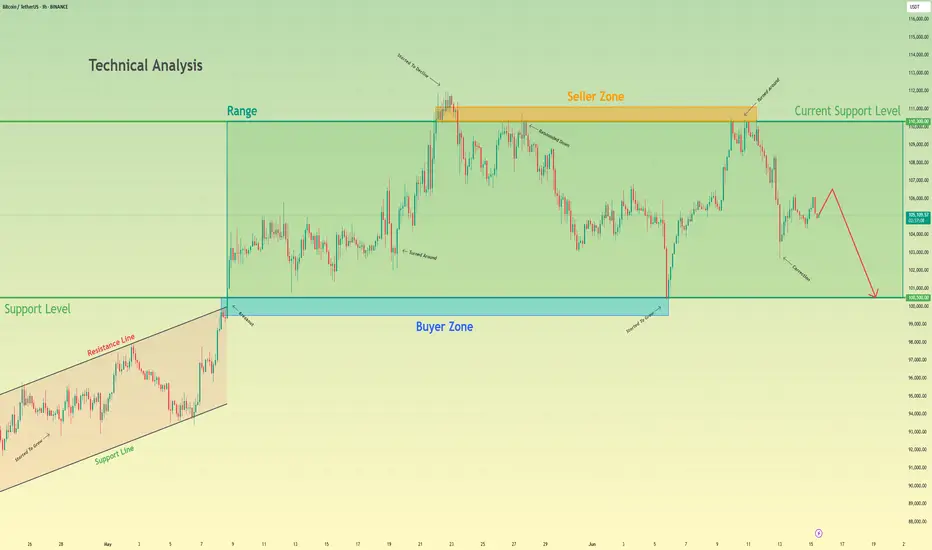
Bitcoin will make a small upward move and then continue to fallHello traders, I want share with you my opinion about Bitcoin. Earlier, the price was confidently growing inside an Upward Wedge, showing a series of higher highs and higher lows. This rising structure was supported by consistent momentum until BTC reached the seller zone between 110300 and 111100, where the growth slowed down and started to fade. From there, the price rejected this resistance and shifted into a Range, bounded by 100500 and 110300. BTC has been fluctuating inside this horizontal structure for some time, unable to break above the seller zone or below the buyer support. Now BTC is showing signs of weakness, forming a minor correction and struggling to reclaim previous highs. Given this structure and rejection from the seller zone, I expect BTC to make a small upward move and then start a decline toward the support level at 100500, which also coincides with the bottom of the range and acts as a strong psychological level. For this reason, I set my TP at 100500 points. Please share this idea with your friends and click Boost 🚀
BTC - AnalysisWe’re currently back at the short-term trend reversal zone,
which has been reactivated after price moved 3% away from it.
The zone itself spans 1.6%, so a new reaction from this level is likely.
If the bottom at $102,500 holds,
we’ve activated a valid bullish structure that could take us up to the $119,000 target zone —
which also overlaps with a weekly target region.
We’ll see what the next few days bring...
Key events to watch right now:
1️⃣ Israel & Iran – Will the conflict escalate or calm down?
2️⃣ Tomorrow’s FOMC meeting – Will QT be addressed?
Feel free to drop any questions or feedback —
I’ll read and respond to everything.
LFG 🚀

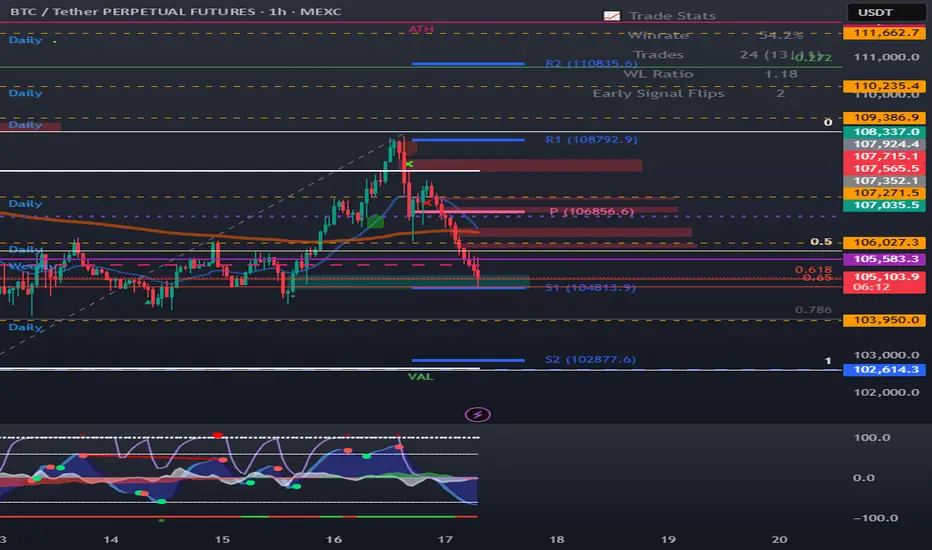
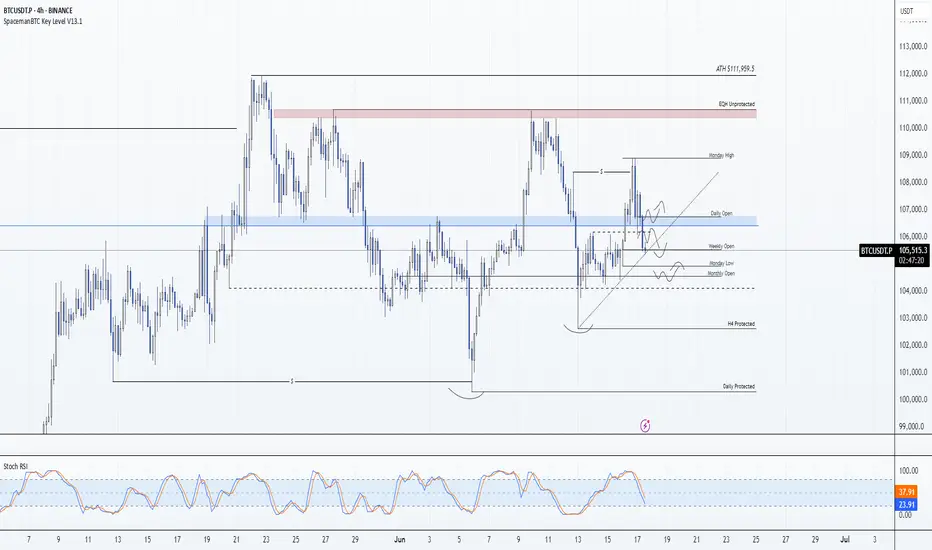
BTC Bias Map: 17/06/25Daily Bias Map:
- Bitcoin lost key support at 106,500
- I am leaning more bearish now that this key support is lost.
- Market is heavily driven by news and uncertainty.
- Key levels like Monday low and monthly low cluster in the same region — likely last bastions of support.
- Expecting a possible larger shakeout toward weak lows nearby, which don’t look appealing for entries.
- Will watch for potential long scalp triggers around monthly open or Monday low but will likely stay side-lined. Unless I see a potential good short setup form.
- With FOMC news tomorrow I’m avoiding heavy involvement the risk is not worth it in this volatile environment.
Discipline means knowing when to step back. In all likelihood I'll let the market develop today unless a extremely clean trade develops.
HolderStat┆BTCUSD forming a triangleBINANCE:BTCUSDT is bouncing from the 104 k pennant foot on trend support, turning squeeze into bullish advance. Holding the rising line preserves upside bias; clearing 111 k unlocks 121 k and ATH chase 🏆

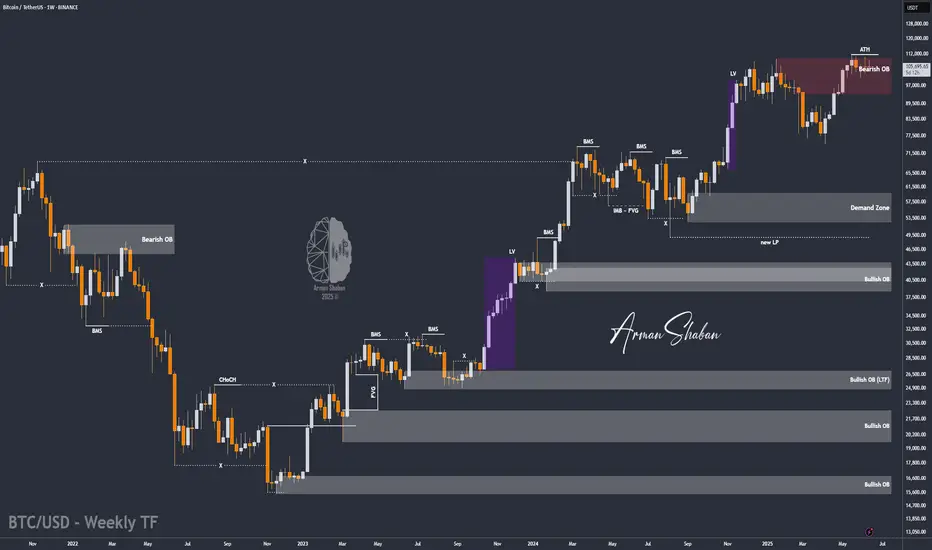
BTC Dips After ATH – $100K Support in Focus Amid TensionsBy analyzing the #Bitcoin chart on the weekly timeframe, we can see that after rallying to $111,980 and printing a new all-time high, price faced a correction down to $100,000.
Currently, Bitcoin is trading around $105,700, and with geopolitical tensions escalating, particularly the risk of war, we could see further downside — potentially taking price as low as $90,000.
However, if BTC manages to hold above the $100,000 level, there’s a strong chance we’ll see a short-term rally toward $120,000.
This analysis will be updated as the situation evolves. Stay tuned!
Please support me with your likes and comments to motivate me to share more analysis with you and share your opinion about the possible trend of this chart with me !
Best Regards , Arman Shaban
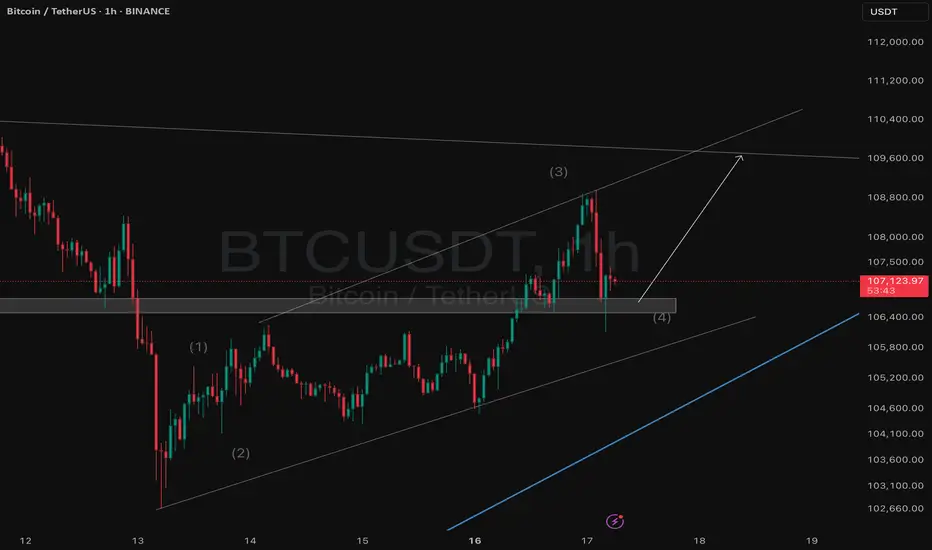
BTC bullish rally before the fall?I am expecting a bullish Rally to the previous high since it's a third wave of current impulse I'm expecting BUY from here to the target mentioned. Will be exciting if any reversal signs occur. (BTC should touch 140,000+ in 2 months.)
entering buy from 107400
*A fall still pending* BITSTAMP:BTCUSD
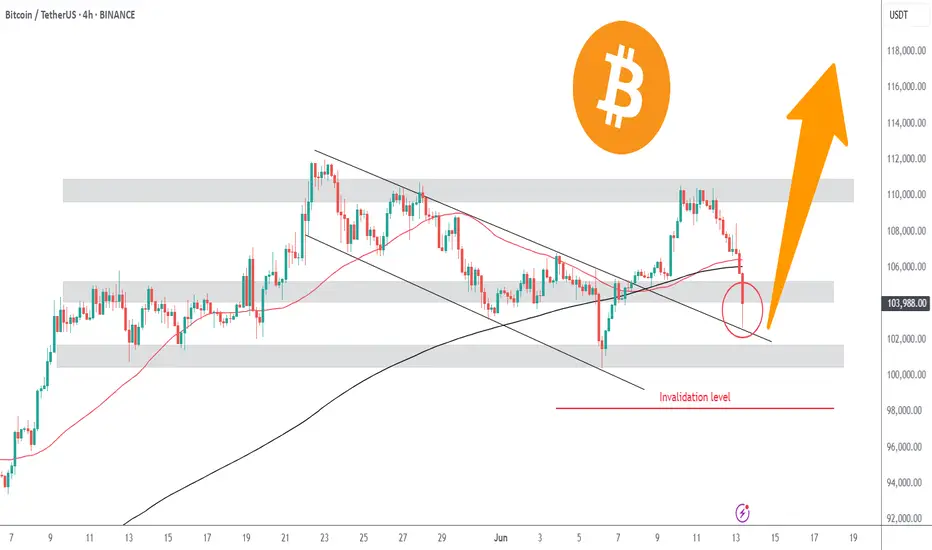
Bitcoin Retests Broken Channel | Bounce to $110k?Bitcoin is currently retesting the broken downward channel. This selloff was a market shock reaction due to Israel's airstrikes on Iran. Price found support around $103k, at the daily timeframe 50SMA. The daily 50SMA also served as support in the previous drop to $100k last week.
In the chart's red circle is likely where many long leveraged positions had their stop losses or liquidation levels. We can safely assume this event was a liquidity hunt as Bitcoin remains strong above $100k. A healthy pullback to retest.
Historically, we have seen similar market shock selloffs like this. One example is the 1st of October 2024 Iran strikes on Israel. Bitcoin crashed 5% from $63k to $60k. What followed after was a recovery to over $100k, never seeing $60k again.
Will Bitcoin recover?
We still have multiple bullish developments. Institutions are becoming increasingly interested in Bitcoin, the US Bitcoin reserve, SEC x Ripple case settlement, SOL ETF approval, Fed rate cuts, among others.
Provided that the conflict does not escalate, once the market panic reaction is over, we can expect a healthy bullish continuation, as long as Bitcoin remains above $100k.
We also have a massive pool of short liquidity above $111k. Once we break above this level it will be a short-squeeze to $120k.
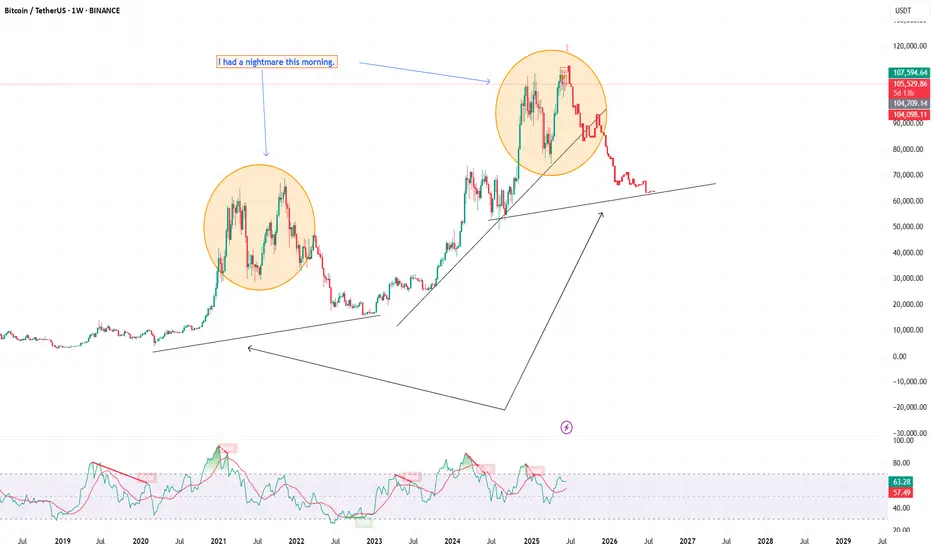
I had a nightmare this morning.Recently, I published my analysis about BTC and found that BTC is following a rising channel and is being supported by fib retracement.
But unfortunately, BTC hasn't shown any remarkable movement so far, and came back again the the support area.
I feel this is not a good sign for BTC.
ON a weekly view, It May repeat its previous movement.
I am publishing my reservation about BTC, be careful about BTC.
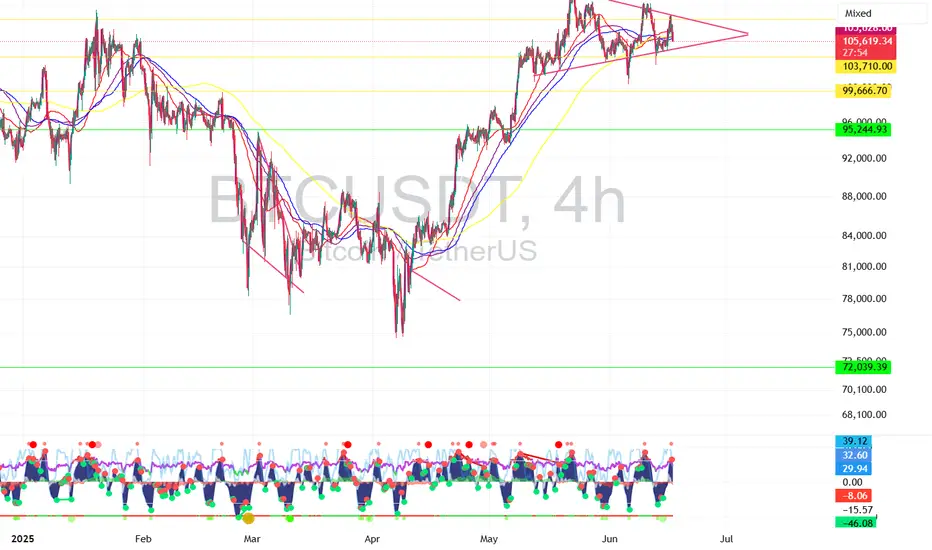
$BTC 4hr - The Calm Before Bitcoin’s Next Move💡 In bull markets, triangles break UP more often than down.
But volume + macro + ETF flows > patterns.
Set alerts, manage risk, stay nimble.
#BTC #CryptoAlpha #RiskManagement
🎯 Key Levels Analysis:
✅ Resistance: 106.3K
→ This level matches the upper bound of the symmetrical triangle and is reinforced by multiple recent rejections. Also aligns with previous highs.
✅ Support: 103.7K
→ Mid-range horizontal support. Price reacted here multiple times. It's also near the triangle base.
✅ Support: 99.6K
→ Clean psychological + technical level. A previous consolidation zone. Would likely trigger a strong reaction.
✅ Last Line of Bull Defense: 95.2K
→ Major horizontal support from the April/May breakout structure. Losing this would likely invalidate the bullish structure.
Excellent Trade yesterday! Today's PlayHere are the scalp plays I am watching today. A few continuation plays in to demand and a reaction off supply. Lets see what the NY brings.
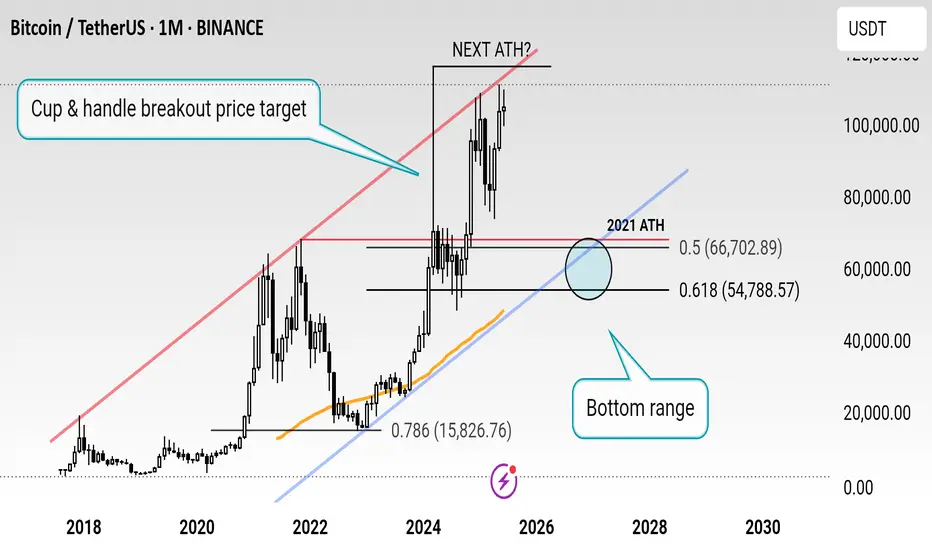
$BTCUSD Predictions support line
Bitcoin traders, get ready for an epic ride! This chart shows BTC still has to hit the price target from the Cup & Handle breakout, pushing it toward a major channel resistance! Once it peaks, a bear market could kick in, driving prices down to the support line. Buckle up for the volatility ahead!