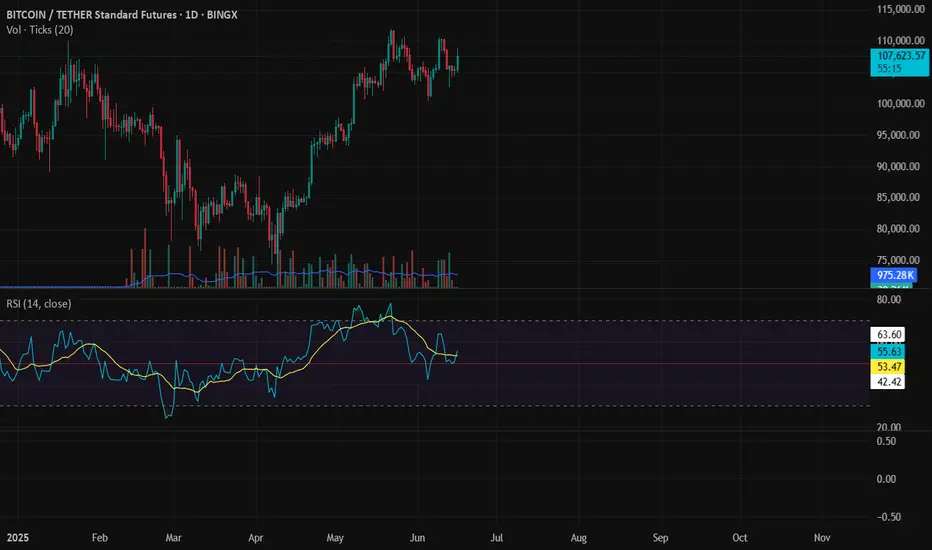
BTC long now ! Bullish divergence confirm ! Bullish divergence in daily timeframe. It might be good for take long position on btc .
#DYOR
BTCUSDT.PS trade ideas
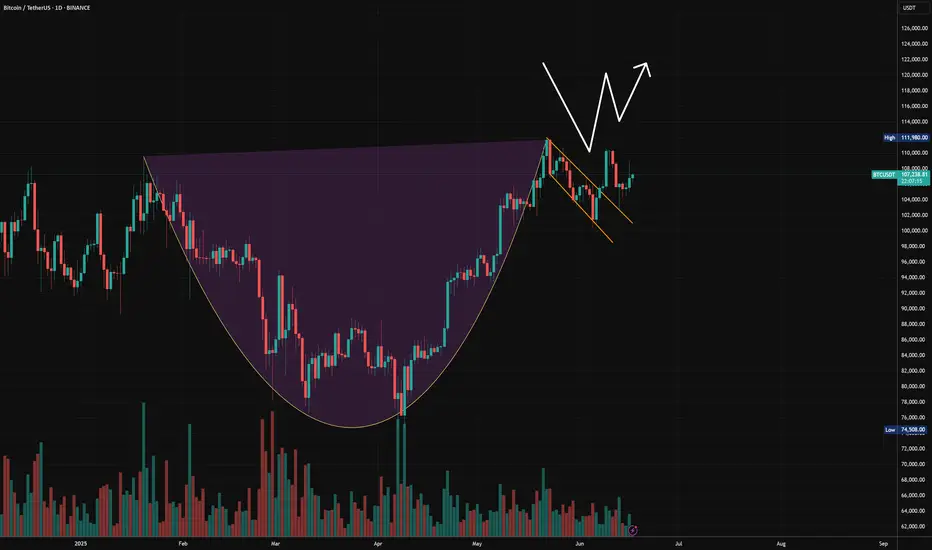
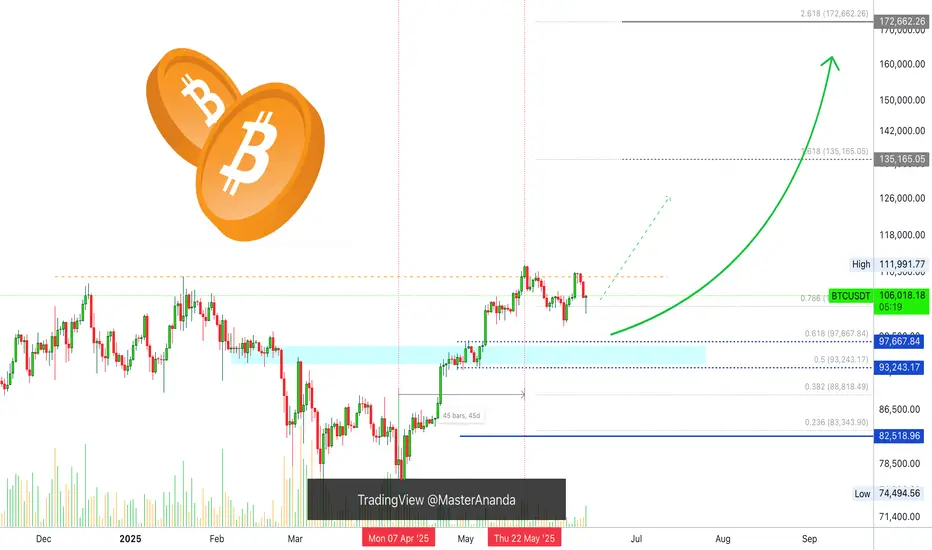
W pattern off the handle. #Bitcoin to 168K.From my most recent post of the Cup & Handle I see a W pattern. Price broke out of the handle to retest to confirm support creating a double bottom.
This is a very good sign to confirm the C&H for this bullish near future.
If we continue upwards and break the psychological resistance zone at 111K, I expect 168K within 3-6 months.
I attached the Cup and Handle analysis to the current.
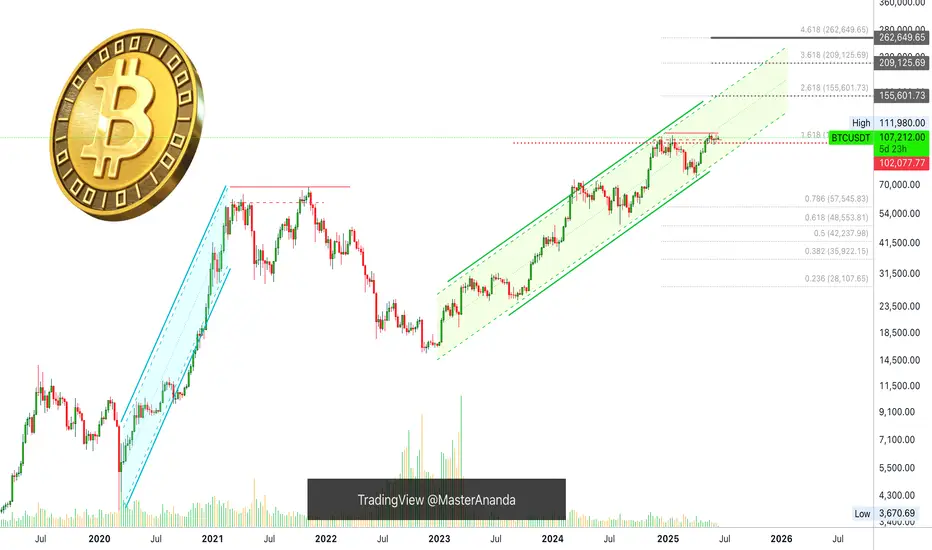
Bitcoin Will Continue Rising —Long-Term Chart —$200,000+ New ATHIn November 2021, the week after the all-time high was a crash. The weeks that followed were a continuation and the market went full red and didn't stop dropping until November 2022, a year later.
In May 2025, the week after the all-time high is neutral, sideways. Four weeks later and Bitcoin continues sideways consolidating near resistance, ready to break to new highs and continue rising.
Market conditions now are very, very different compared to 2021. Right now, we are only halfway through the current bull market, for Bitcoin, and we have room left available for plenty of growth.
In a matter of days, maybe 5-6 days, we get a new all-time high and this means not the end of the bull market but the start of the next and final bullish wave.
These targets on the chart are the most accurate of all numbers because they are based on almost 5 years of data.
Next target and minimum price for Bitcoin in the coming months is $155,601 but we know there is likely to be more, much more. With the institutional wave now in full force, banks opening to crypto because they have no other choice and the world evolving faster than anything we thought possible, we are aiming for $200,000 or more.
The next relevant level after $155,600 is $209,125. Which one is your target for this new 2025 all-time high?
Do you think Bitcoin will peak in late 2025 or early 2026?
Do you think you will manage to be successful in this round or are you bound to make the same mistakes? Over-trading, over-leverage, no being patient enough; not waiting for the right time to enter and not selling when the market is trading very high, greed; What will it be?
Do you think you have what it takes to succeed? You do!
Even if you made mistakes in the past or even if you are already doing good, you have what it takes.
If you are doing bad, this experience can be used to improve your game. If you are doing great, great, let's do better. There is never enough growth; we are happy, we are grateful but we accept abundance because we receive abundance thanks to hard work.
It is still very early but the market is starting to heat up. Once the bullish action starts, there is nothing that can stop us. The world will change for us. We will adapt to all market and geopolitical conditions, we will continue to improve and evolve.
The best one is not the one that makes no mistakes but the one that can extract learning from all experiences. Success is not being right all the time, success is never giving up.
Will you give up? Or, will you continue to trade long-term?
» Bitcoin is going up!
Namaste.
sellsell
Iron dome is hacked & Iran is hacking nuc sil.Tela vvv is going to be de stroiiiiied this night
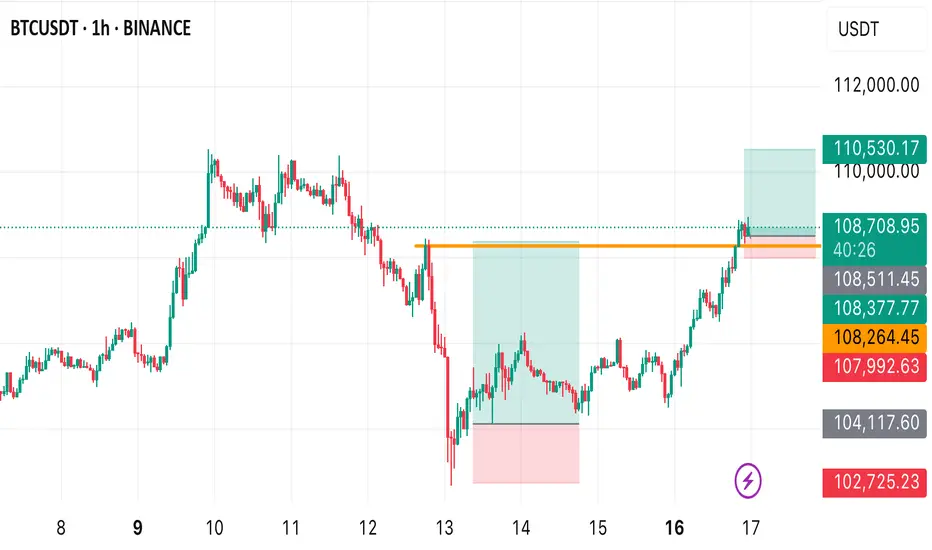
BTC BUY OPPORTUNITY From the H1 perspective, more buy entries are made as price closed at 108712 today. A buy. Opportunity is envisaged from the current market price. Our target profit is the all time high. Take advantage of this opportunity now.
BTC VAH, Golden pocket, R3, confluence resistance at 108kBTC VAH, Golden pocket, R3, confluence resistance at 108k
We had a nice up move but now hitting a confluence of resistance. I'm looking for shorts for the correction before moving up again.
Looking at bearish divergence on smaller time frames for entry.

be ready for it this for educational purpose comment for any stock analysis name and take risk on ur on action
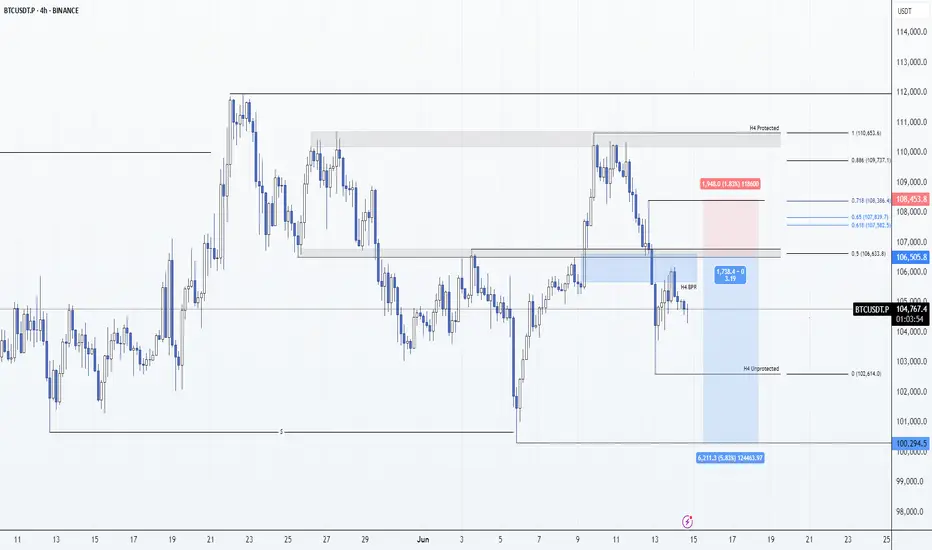
BTC: H4 14/06/25Bearish DOL @ $100,300
HTF Remains bearish
Any scam move Sunday would be my trigger to short.
Invalidation would be taking $100,300 before that or if structure changes between then and now.
That said, I think its a very high likelihood we just roll over here and we don't take that level. IMO the cleaner short was the H4 BPR but I was unavailable at the time to take that trigger.
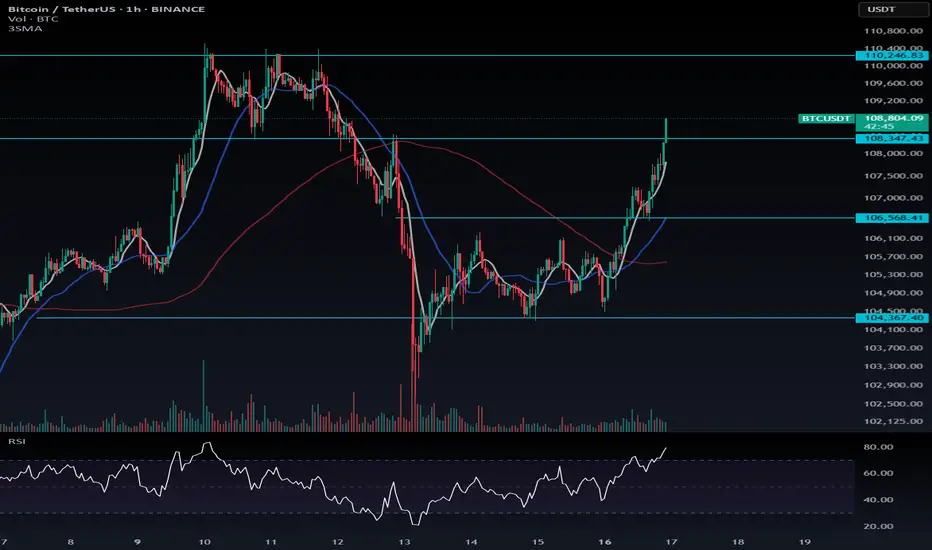
BTC Rally in Play — Time to Lock In Profits and Wait for FOMC?📈 Bitcoin Rally in Play — Time to Lock In Profits and Wait for FOMC?
After the expected upward move, I believe now is a good time to either close your positions or secure partial profits, whether you're in Bitcoin or altcoins. The market will offer new opportunities, so there’s no rush.
With the upcoming FOMC meeting on Wednesday, I suggest holding off on new entries until the news is out and volatility settles.
Currently, the resistance at $108,347 isn’t confirmed as valid yet — but if we see a rejection from that level, it could become a short-term barrier. On the downside, to maintain this recent bullish momentum, the support at $106,568 must hold.
---
💬 How are you managing your trades ahead of the FOMC? Took profits already or still holding? Drop a comment below — always good to hear your plan!
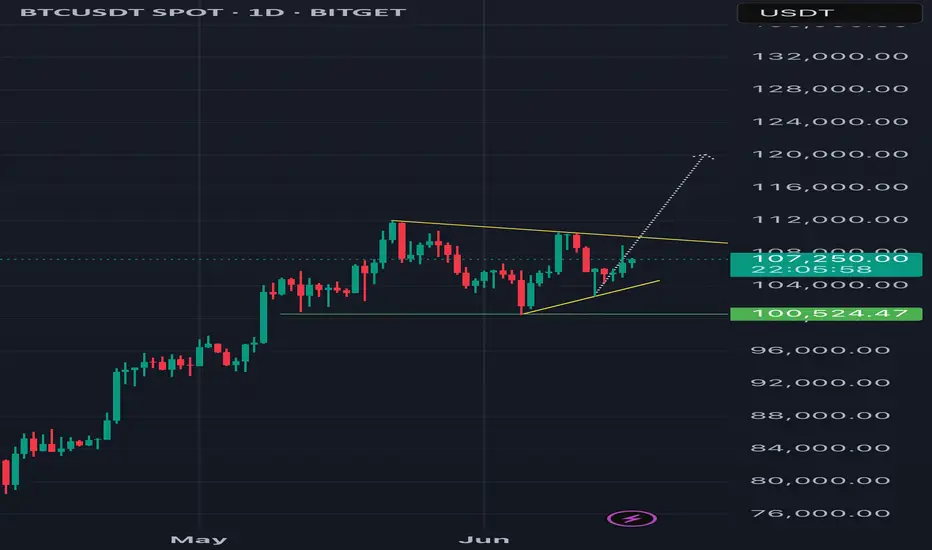
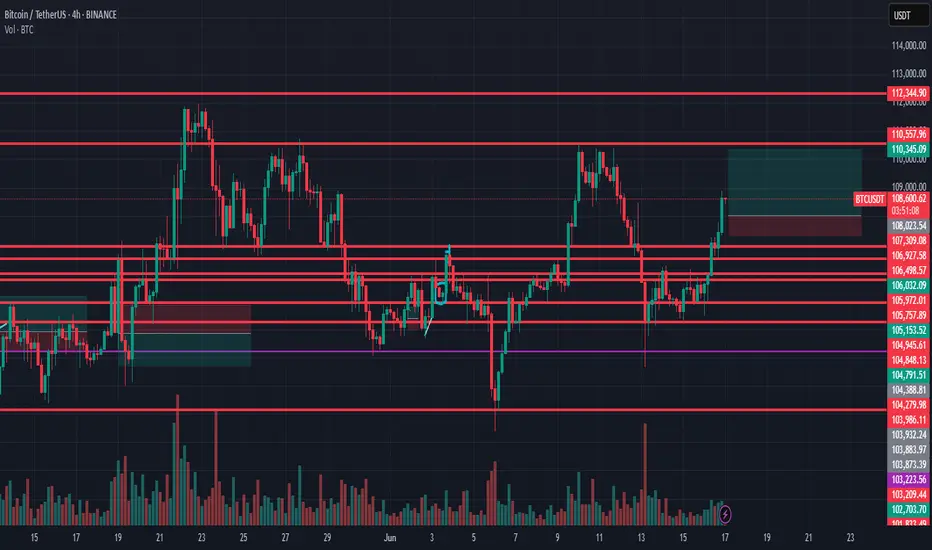
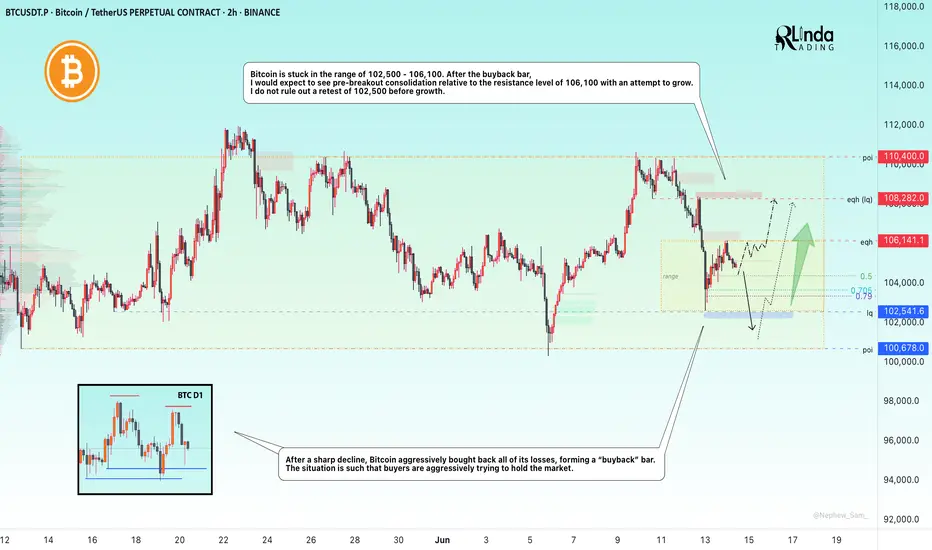
BITCOIN → Buyback bar. Chance of growth to 108,000BINANCE:BTCUSDT is trading in a fairly wide range of 100,600 - 110,400. The market is stagnating due to fundamental uncertainty, but the risks of a decline are quite high...
After the escalation of the conflict in the Middle East, Bitcoin broke the bullish structure on the market and managed to test the local level of 102500, from where a fairly aggressive phase of buying out the fall began within one trading session. The market is defending the structure quite aggressively. The chart shows a local range forming with strong levels at 102500 and 106200. Accordingly, the price may remain in this range for a long time (in which case an intraday trading strategy can be considered). However, if Bitcoin starts to stick to one of the boundaries, then we can consider the price leaving the range, but based on the structure of the uptrend, correction, and the formation of a buyback bar, it would be logical to see an attempt to break through resistance with the aim of continuing growth.
Resistance levels: 106200, 108200, 110400
Support levels: 102500, 100600
On D1, there are no prerequisites for a strong decline. The market is buying up knives and trying to stay afloat (in consolidation). In the medium term, there may be an attempt to retest 102500 - 100600 due to the liquidity pool. But locally, the market may form an attempt to grow to 108200
Best regards, R. Linda!
POC, Daily, Golden Pocket, S1 confluence support @ 104000POC, Daily, Golden Pocket, S1 confluence support @ 104000
Very strong support here. I'm putting a limit order anticipating a quick bounce.

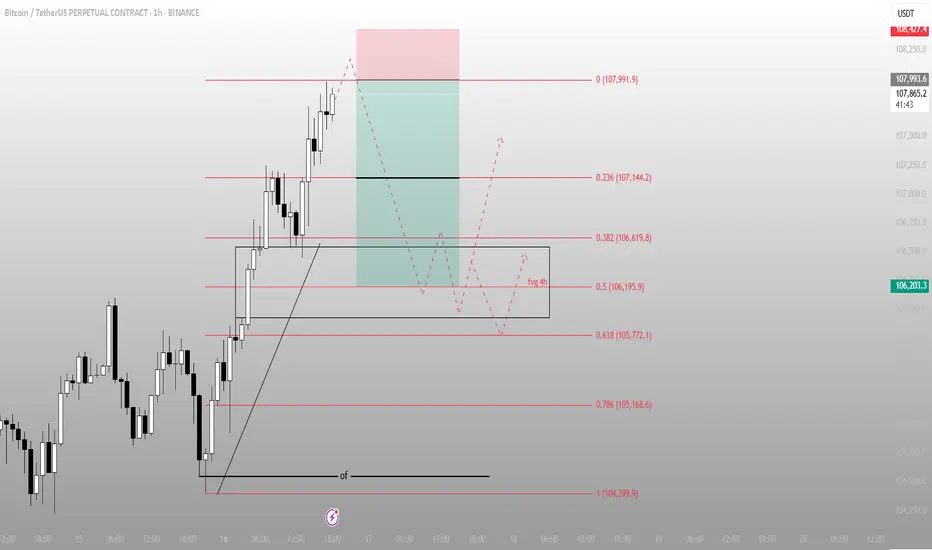
That wasn’t a breakout. That was the stop runBTC swept the high into 107,991 — precision tap of the premium fib. Now the delivery shifts. Price has already done its job: take liquidity, trigger late longs, and set up the real move.
Here’s the execution breakdown:
Price tagged the 0 level of the fib extension — 107,991 — and rejected
A clean 4H FVG sits just below around 106,195.9 (0.5), aligned with 0.382 and 0.618 fib levels (106,619.8 to 105,772.1)
This is the re-entry zone for Smart Money — not the top chasers
Expectations from here:
→ Rebalance into the 106.6–105.7k region
→ If that zone holds and price shifts structure bullish again, we retest 107.1 → 107.9 → break higher
→ If we lose 105.7 cleanly, I’m watching 104,399.9 — the deeper inefficiency magnet
This isn’t about confirmation. It’s about preparation.
More trades like this — clean, controlled, conviction-based — live in the profile description.
Bitcoin Market Analysis and Future Trend ForecastThe Bitcoin market has once again become the focus of investors. The price of Bitcoin has shown a significant upward trend, successfully breaking through the key resistance level of $106,000 per coin with an intraday increase of over 2%, demonstrating the strong vitality of the market. This price movement not only reflects the warming of positive sentiment in the cryptocurrency market but also indicates the gradual recovery of investor confidence, which has become the core driving force behind Bitcoin's current rally.
Currently, the Bitcoin price is at a critical juncture. From a daily chart perspective, after reaching an intraday high of $107,265, Bitcoin failed to effectively break through the key resistance level of $108,000 and has since retracted to fluctuate around $106,940. On the 4-hour timeframe, the MACD indicator shows that the histogram remains in positive territory, but the rate of increase has slowed, suggesting a short-term weakening of bullish momentum. Meanwhile, the RSI indicator stands at around 65, approaching the overbought zone, indicating that the market faces short-term correction pressure.
you are currently struggling with losses,or are unsure which of the numerous trading strategies to follow,You have the option to join our VIP program. I will assist you and provide you with accurate trading signals, enabling you to navigate the financial markets with greater confidence and potentially achieve optimal trading results.
Trading Strategy:
sell@107500-108000
TP:106000-106500
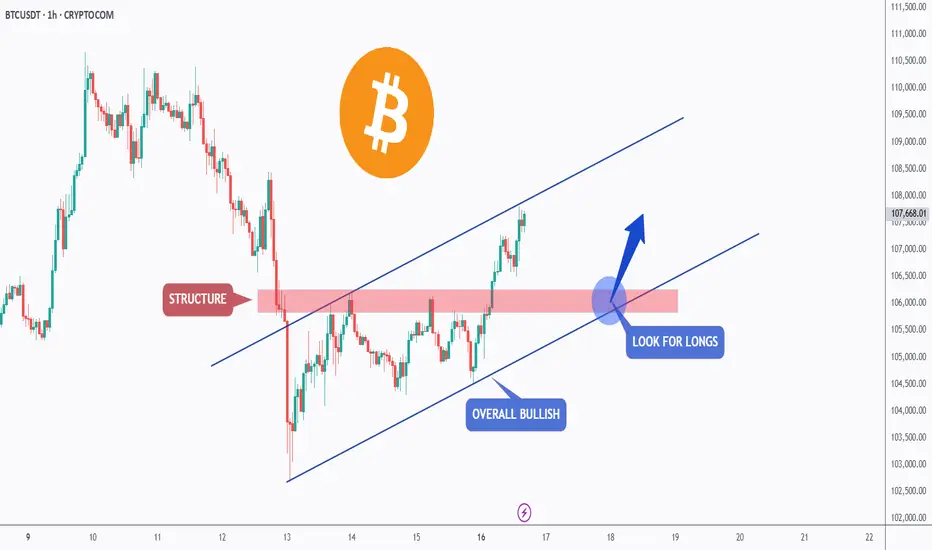
BTC is Bullish!Hello TradingView Family / Fellow Traders. This is Richard, also known as theSignalyst.
📈BTC has been overall bullish trading within the rising channel marked in blue.
Moreover, the red zone is a strong structure!
🏹 Thus, the highlighted blue circle is a strong area to look for buy setups as it is the intersection of structure and lower blue trendline acting as a non-horizontal support.
📚 As per my trading style:
As #BTC approaches the blue circle zone, I will be looking for bullish reversal setups (like a double bottom pattern, trendline break , and so on...)
📚 Always follow your trading plan regarding entry, risk management, and trade management.
Good luck!
All Strategies Are Good; If Managed Properly!
~Rich
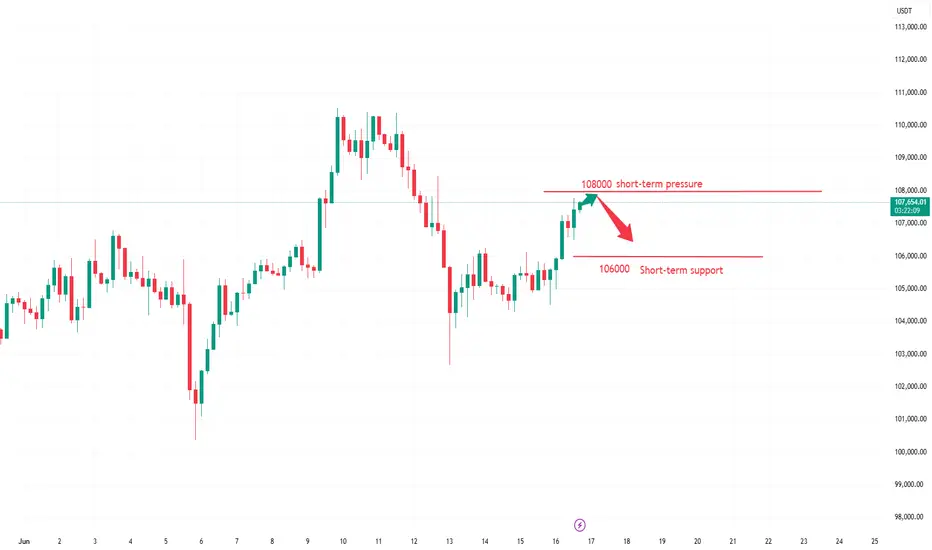
BTC-----Buy around 107500, target 108000-109000 areaTechnical analysis of BTC on June 16:
Today, the general trend is still relatively obvious, so the trading strategy is to buy at a low price.
Today's BTC short-term contract trading strategy:
Buy in the 107500 area, stop loss in the 106500 area, and target the 108000-109000 area;

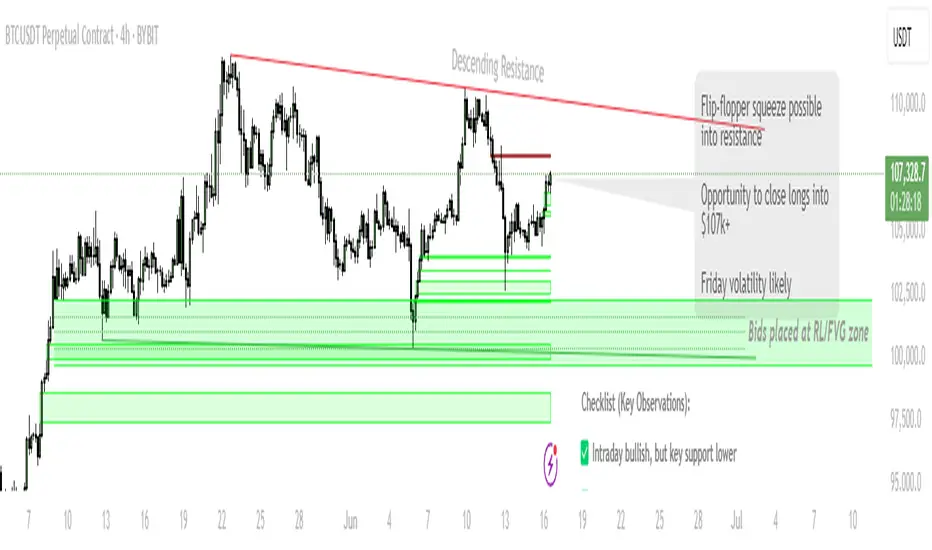
BTC Setup: Watching for a Trap — Bids Below, Flip Above!Scenario 1 (Fakeout & Reversal):
Watch for push to $107,000–$108,000 (potential bull trap)
Close longs on move into resistance zone
Look for reversal signals (SFP, strong rejection) to re-enter lower
Scenario 2 (Sweep and Bounce):
Place bids at/just below $100,272 (1D Support) and within $98,000–$100,000 (FVG)
Target: Move back toward trendline resistance ($107k+)
Stop: Below $97,200
Invalidation:
Structure flips bearish on a clean break/close below $97,200
🔔 Triggers & Confirmations:
Enter longs only on SFP or strong bounce confirmation in FVG zone
Avoid chasing if price is between $102k–$106k (“no-trade chop”)
📝 Order Placement & Management:
🔼 Buy Limits: $100,300 / $99,000 / $98,000 (staggered bids in FVG)
🛡️ Long Stop: $97,200
🎯 Target: $107,000–$109,000 (trendline resistance)
📝 Take profits on spike to $107k+
🚨 Risk Warning:
Friday volatility, news risk
Avoid new longs above $107k — watch for failed breakout/fakeout
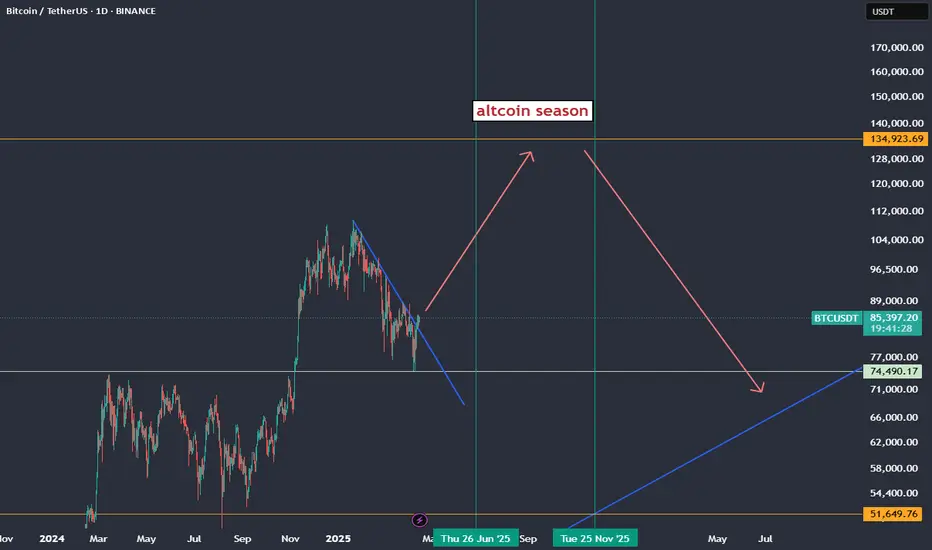
BTC doing a 1.618 means altcoin season is on🔥 Why 1.618 on BTC = Altcoin Season Coming
The 1.618 Fib extension is a common target for wave 3 or wave 5 in Elliott Wave theory. Once BTC hits it:
Many traders start taking profit on BTC.
That capital usually flows into ETH and major alts, then mid/small caps.
BTC dominance often peaks or stalls after hitting 1.618, which historically signals:
ETH/BTC starts rising
Altcoins gain strength against BTC and USDT
Retail and sidelined liquidity get attracted by BTC gains, but then chase faster % returns in alts.
🧠 Example Playbook
BTC breaks out → Runs hard → Hits 1.618 (e.g., from last correction low to current high)
ETH/BTC bottoms → ETH/USDT starts to run
Majors like SOL, AVAX, MATIC, DOT follow
Mid/small caps explode last (aka “altseason” proper)
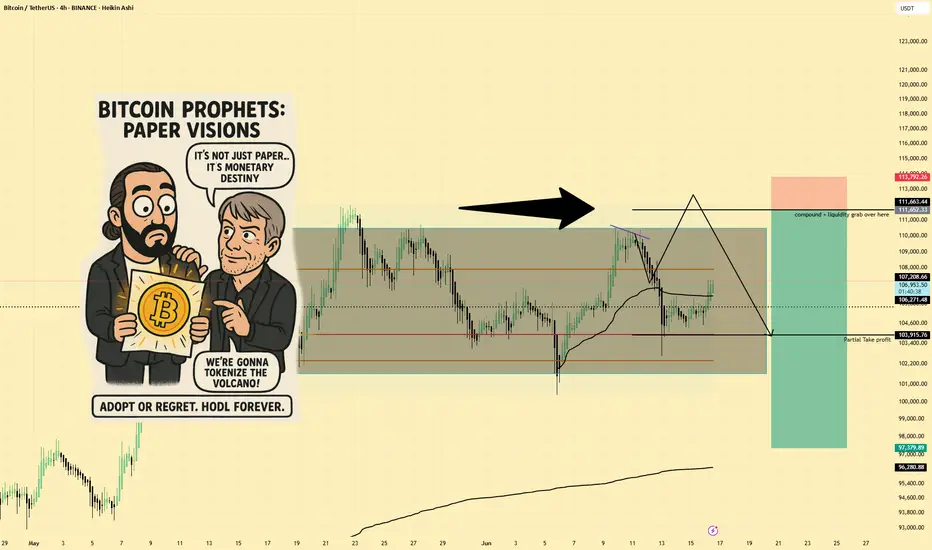
BTCUSD | Short Bias | Liquidity Grab | (June 16, 2025)BTCUSD | Short Bias | Liquidity Grab Setup | (June 16, 2025)
1️⃣ Short Insight Summary: Bitcoin hit a solid take-profit earlier, but now I’m watching for a potential liquidity grab near the highs to set up a short opportunity. The next key zone to watch is around 1:11 PM if price quickly spikes and reverses.
2️⃣ Trade Parameters:
Bias: Short
Entry: Around 113 (after a confirmed liquidity grab at the top)
Stop Loss: Just above the liquidity grab zone
TP1: Around 103900 (Point of Control zone)
TP2: Final target at 97900
Partial Exits: Possible scaling out at POC zone
3️⃣ Key Notes: Spot selling is active, but there's also a lot of buying interest—especially from those trying to long this dip. That mix can lead to a fast liquidity grab, flushing out early shorts before a reversal. Open interest suggests there's still a lot of activity, so I’m being patient and only acting on confirmation.
4️⃣ Optional Follow-up: I’ll keep an eye on this setup and update if the reversal confirms after the grab.
Please LIKE 👍, FOLLOW ✅, SHARE 🙌 and COMMENT ✍ if you enjoy this idea! Also share your ideas and charts in the comments section below! This is best way to keep it relevant, support us, keep the content here free and allow the idea to reach as many people as possible.
Disclaimer: This is not financial advice. Always conduct your own research. This content may include enhancements made using AI.
BTC Plan: 16/06/25Bitcoin Bias Map – Monday BINANCE:BTCUSDT BINANCE:BTCUSDT.P
Current Context:
- Impulsive leg up completed.
- Reclaimed 106,400–106,500 on 4H timeframe with displacement.
- Higher low established on 4H.
- Equal highs around 110,700 on 4H, immediate draw on liquidity for bulls. Beyond that, all-time highs as targets.
Key Levels:
- Support: 106,400–106,500 region.
- Risk: Loss of this region H4 likely triggers a fast revisit to ~100k.
Price Action Signals:
- H4 overbought; M30 oversold — potential scalp long entry for move toward equal highs.
- H12 neutral but moving out of oversold.
- Daily neutral but price sitting in a daily bearish fair value gap.
Trade Plan:
- No interest in shorting unless 106,400 breaks decisively.
- No confirmed swing failure point yet to justify short trigger.
- Looking to enter long on pullback when H1 becomes oversold.
- Ready to flip short if wrong with clear structure break.
Personally, looking for longs. Until 106,500 is lost my bias is up now till EQHs. this is a strong reaction

Bitcoin, Good News & Good News —Bullish Confirmed (Retrace Over)First, the good news is that we have a higher low and a strong recovery in place. The current candle has a long lower wick and is already trading green, at the top of the session.
The second good news is how far down the retrace went. Last time Bitcoin bottomed around $100,300, this time the bottom happened at $102,660. This is an early signal of course because the week is not yet over. It can happen that prices move higher today and tomorrow they move back down, crash on Sunday and we get a bearish close. But, looking at short-term price action and other altcoins, also the volume—notice the volume—we can say that the retrace is over and we are set to experience immediately additional growth.
The volume is the most revealing signal right now.
The drop had no volume compared to today. Today's session has more volume than the last three red-days combined.
Another signal to consider is the amount of over-leveraged gamblers that were liquidated, a total of 1 billion dollars. When this much greed is removed from the market, there is no need for lower prices.
I will call it early, the retrace is over. Time to go bullish again.
Thanks a lot for your continued support.
I will show you several more altcoins that are also looking ready to grow.
Namaste.
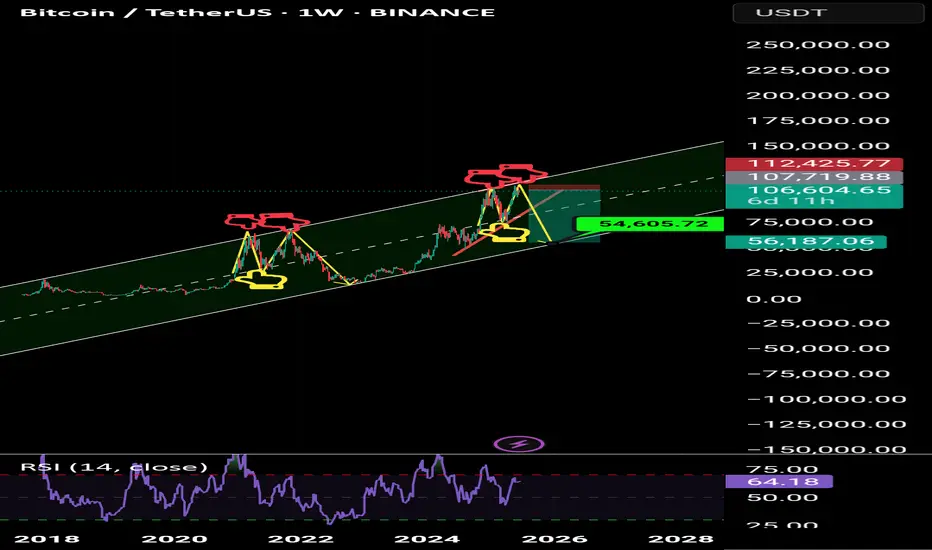
Bitcoin sell short go 50k Bitcoin is ready to correct towards $56,000 after the double-top pattern on the weekly time frame.
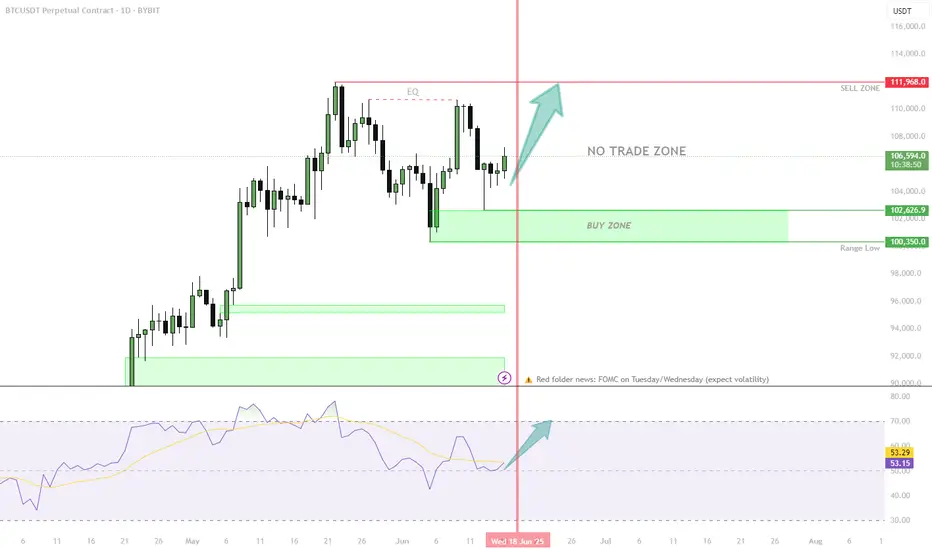
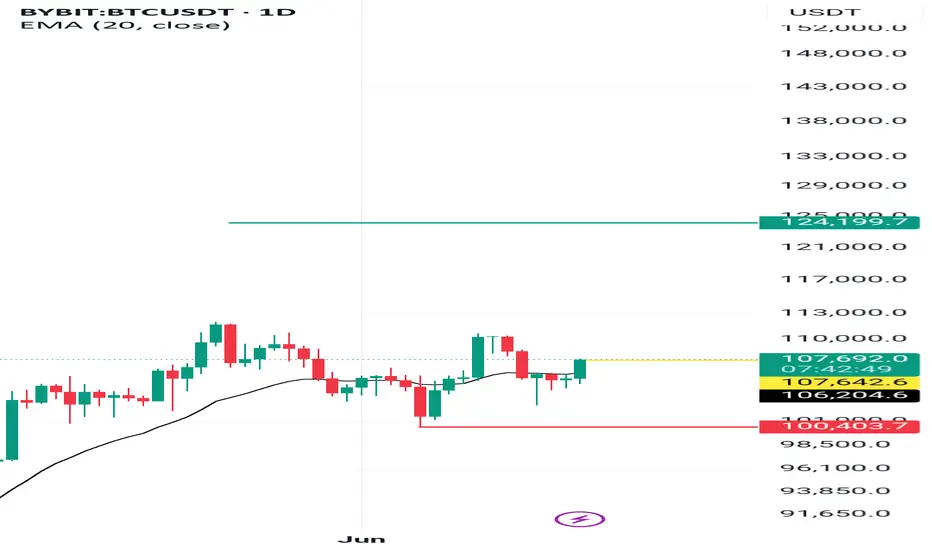
BTC Weekly Game Plan: Key Levels & Clear Setups!Short Scenario:
Enter on confirmed rejection (SFP or bearish MSB) from Equal Highs ($110,700) or BPR ($108,000)
Targets: $105,000 → $102,600 (Weekly Draw)
Invalidation (stop): Above $112,000 (Range High)
Long Scenario:
Enter on confirmed bounce (bullish MSB or SFP) at Weekly Draw ($102,600) or Range Low ($100,300)
Targets: $108,000 → $110,700
Invalidation (stop): Below $99,500 (under Range Low)
🔔 Triggers & Confirmations:
M15/H1 confirmation required: SFP or clear MSB before entry.
Avoid entries if price slices through levels without a reaction.
📝 Order Placement & Management:
🔻 Sell Limits: $110,700 & $108,000
🛡️ Short Stop: $112,100
🎯 Short Targets: $105,000 → $102,600
🔼 Buy Limits: $102,600 & $100,300
🛡️ Long Stop: $99,500
🎯 Long Targets: $108,000 → $110,700
🚨 Risk Warning:
Shorts are against HTF bullish momentum, increasing risk.
High volatility expected due to FOMC meetings (Tuesday/Wednesday).