Bitcoin Price Update📊 Bitcoin Price Update: Key Resistance Zone Between $110K and $111.7K — Range-Bound Potential Ahead
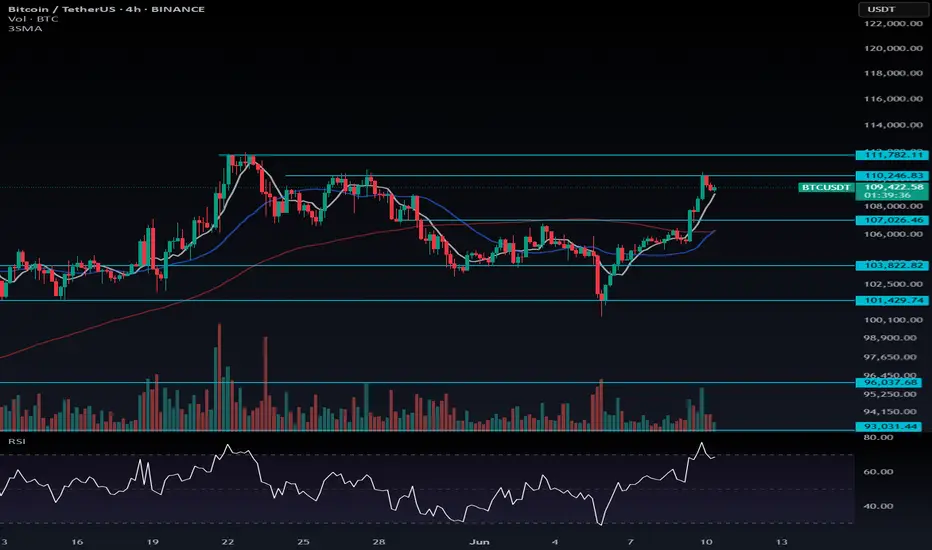
As previously mentioned, Bitcoin's price action suggests that a break above $106,355 would signal the start of a bullish trend, and so far, we've seen upward momentum maintained while staying above $107K.
Now, Bitcoin has reached a critical resistance zone between $110,246.83 and $111,782.11. This area presents a potential for market hesitation, as it aligns with a strong resistance level. Given the significant movement over the past few days, it’s possible the market may enter a range-bound phase as it consolidates and structures itself for the next move.
---
📉 Possible Short-Term Range:
Range Between: $110,246.83 to $111,782.11
Expect possible sideways consolidation before continuing the trend
---
📈 Bullish Continuation:
As long as Bitcoin remains above $107K, the bullish trend remains intact
Break above $111,782.11 may signal continuation toward higher targets
BTCUSDT.PS trade ideas
#BTC/USDT#BTC
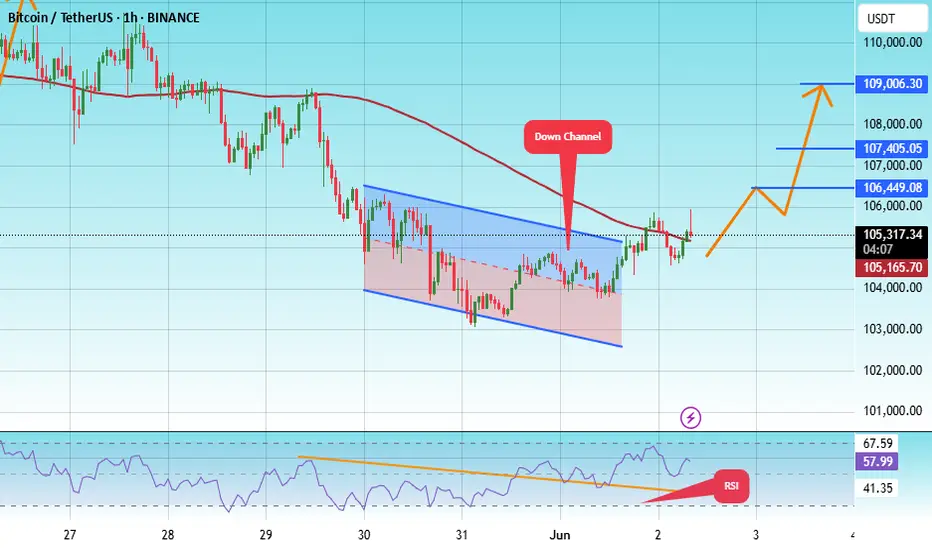
The price is moving within a descending channel on the 1-hour frame, adhering well to it, and is heading for a strong breakout and retest.
We are experiencing a rebound from the lower boundary of the descending channel, which is support at 103141.
We are experiencing a downtrend on the RSI indicator, which is about to break and retest, supporting the upward trend.
We are looking for stability above the 100 moving average.
Entry price: 105268
First target: 106500
Second target: 107405
Third target: 109006
Tuesday Scalps! 🔥 These are the scalps I’ve got my eye on today. 🔥
Mostly looking at continuation longs — unless structure tells a different story.
💡 Key Plan:
For each long setup, I’ll wait for an internal market structure (MS) flip before pulling the trigger. No confirmation, no entry. Precision is the priority.
📅 Class Schedule:
Tuesday | After 6 PM

DeGRAM | BTCUSD held the $100k level📊 Technical Analysis
● Bounce from 99.8-100 k confluence (violet trend-line + former wedge top + horizontal demand) confirms the zone as fresh support.
● Price coils in a tight pennant under 106 k; 1.618 target of the pattern meets the rising-channel roof and red supply at 111-112 k, while RSI prints higher lows, flagging hidden bullish momentum.
💡 Fundamental Analysis
● CME futures basis widened above 10 % annualised as softer US claims cooled dollar bids, boosting carry appetite; meanwhile, on-chain reserves keep shrinking, hinting at supply squeeze.
✨ Summary
Buy 100-103 k; pennant break >106 k aims 111 k → 115 k. Bull view void on an H16 close below 99 k.
-------------------
Share your opinion in the comments and support the idea with a like. Thanks for your support!
Bitcoin Rally Overextended: Patience is Key for the Next Move💹 BTC/USDC – Bullish Outlook, heres my Trade Plan.
Bitcoin (BTC/USDC) is currently maintaining a strong bullish trajectory 🚀, showing impressive momentum after breaking through recent resistance levels 🔓.
However, price is now overextended from the last swing low, and I’m anticipating a pullback into value 🔄 — specifically targeting the 50%–61.8% Fibonacci retracement zone drawn from the latest swing low to swing high 📐. This zone often acts as a rebalancing point for institutional traders and provides confluence for smart entries 🎯.
I’ll be closely watching this retracement area for signs of support forming, and more importantly, a bullish break in market structure 🧠📊. Only after that confirmation, would I consider executing a long position — no structure break, no trade ✅.
This isn’t about predicting — it’s about reacting with discipline.

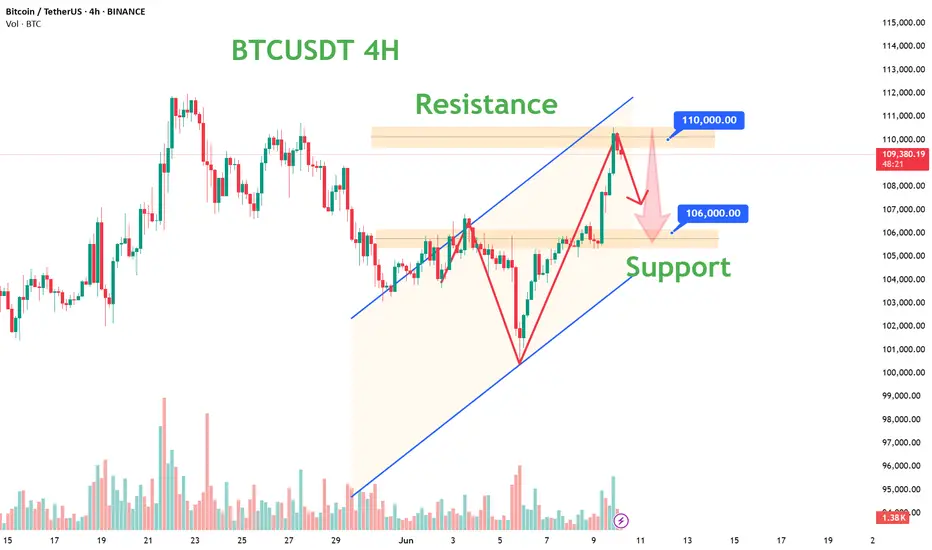
Bitcoin Approaches Resistance as Momentum Cools: What’s Next?Bitcoin has been on a strong upward trend 🚀, but recent moves show signs of exhaustion as it approaches major resistance zones 🛑. The appearance of a three-drive pattern on the 4-hour chart, suggests the market could be due for a healthy correction 🔄. While the broader trend remains bullish, I'm watching for a potential pullback and then looking for renewed strength (bullish BoS) before considering new long positions. Patience and confirmation are key in these conditions! 👀✨

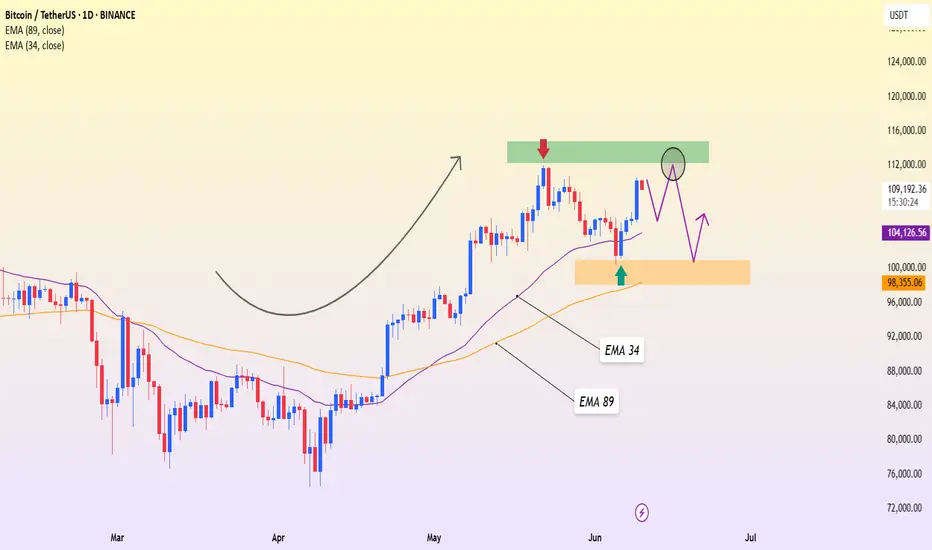
BTCUSDT – Uptrend Intact, Resistance Still in PlayBitcoin is currently moving within a healthy uptrend, showing a strong rebound from the 101,332 USDT support zone—aligned with the EMA 89 on the daily chart. Following an impressive recovery, the price is now approaching the 111,892 resistance area, which previously halted the bullish momentum and triggered a deep correction.
However, recent price action shows signs of stalling, suggesting a possible consolidation phase. If BTC fails to break above 111,892, a mild pullback toward the 104,000–101,000 zone may occur to build fresh momentum for the next bullish leg.
From a news perspective, the crypto market is buoyed by improving sentiment after weak U.S. job data, increasing the odds of an earlier-than-expected Fed rate cut. Additionally, continued capital inflows into Bitcoin ETFs are supporting medium-term upside potential for BTC.
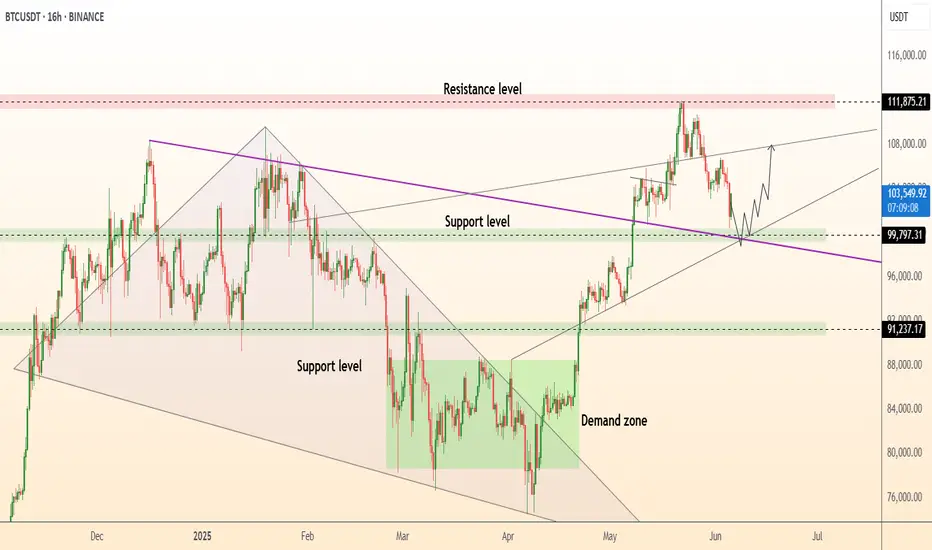
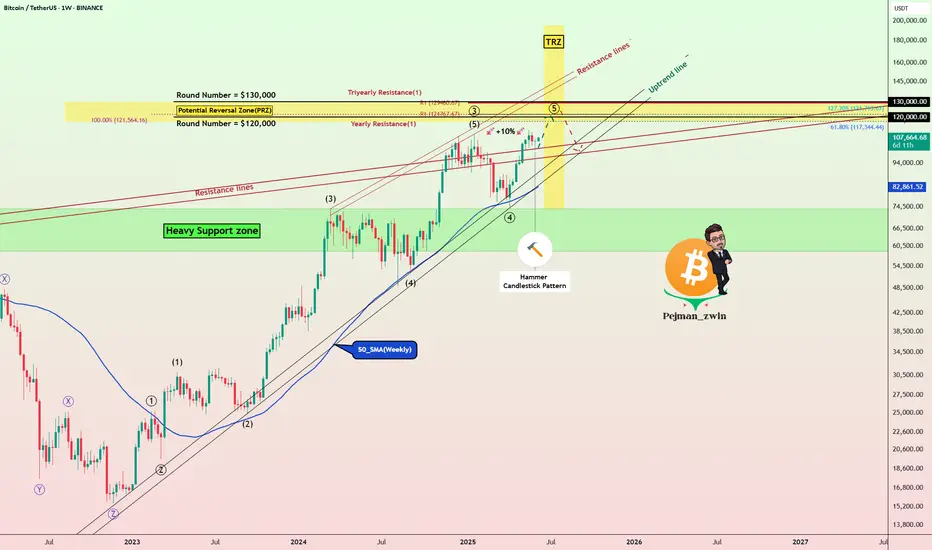
Bitcoin’s Final Wave & Time Reversal Zone _ New ATH Loading?Today, I want to analyze Bitcoin ( BINANCE:BTCUSDT ) on the weekly time frame and answer these questions :
Can Bitcoin create a new All-time High(ATH) or not!?
At what price range can Bitcoin's uptrend end!?
When can we expect the uptrend to end!?
Please stay with me.
Bitcoin appears to have managed to break the Resistance lines , although we saw a fake break a few months ago , and it also appears to have a Hammer Candlestick Pattern in the previous weekly candle , which could signal the completion of Bitcoin's pullback to the Resistance lines(broken).
In terms of time , if we want to analyze the Bitcoin chart and look at Bitcoin's past, in general, the months of June(Average=-0.13%/Median=+2.20%) and especially July(Average=+7.56%/Median=+8.90%) have been among the most productive months for Bitcoin , and the months of August(Average=+1.75%/Median=-8.04%) and September(Average=-3.77%/Median=-4.35%) were the months when Bitcoin had a correction . Technical analysis tools show the end of the upward trend and the beginning of Bitcoin's correction at the Time Reversal Zone(TRZ=June 23 to August 4) .
In terms of Elliott Wave theory , Bitcoin appears to be completing the main wave 5 , as the main wave 3 was extended .
I expect Bitcoin to trend higher(+10%) in the coming weeks and create a new ATH . New ATH could be created in the Potential Reversal Zone(PRZ) and TRZ , and then we can wait for the start of the main correction .
What do you think about Bitcoin’s future movement? Can Bitcoin create a new ATH? When and at what price?
Note: If Bitcoin falls below $100,000, we should expect further declines.
Please respect each other's ideas and express them politely if you agree or disagree.
Bitcoin Analyze (BTCUSDT), weekly time frame.
Be sure to follow the updated ideas.
Do not forget to put a Stop loss for your positions (For every position you want to open).
Please follow your strategy and updates; this is just my Idea, and I will gladly see your ideas in this post.
Please do not forget the ✅' like '✅ button 🙏😊 & Share it with your friends; thanks, and Trade safe.
BTC/USDT Long PositionAfter a strong bullish impulse, price pulled back and formed a clear demand zone (OB) near the origin of the move.
The market is now retesting this zone after breaking short-term structure to the upside.
Entry:
Long from demand zone (OB) at the base of the bullish impulse.
Confluences:
✔️ Clean bullish BOS (Break of Structure)
✔️ Strong rejection wick from demand
✔️ Lower time frame liquidity grab
✔️ Favorable R:R setup
SL: Below the OB
TP: Targeting previous supply zone above
Bias: Bullish until structure shifts again
FOLLOW ME FOR MORE SIGNAL
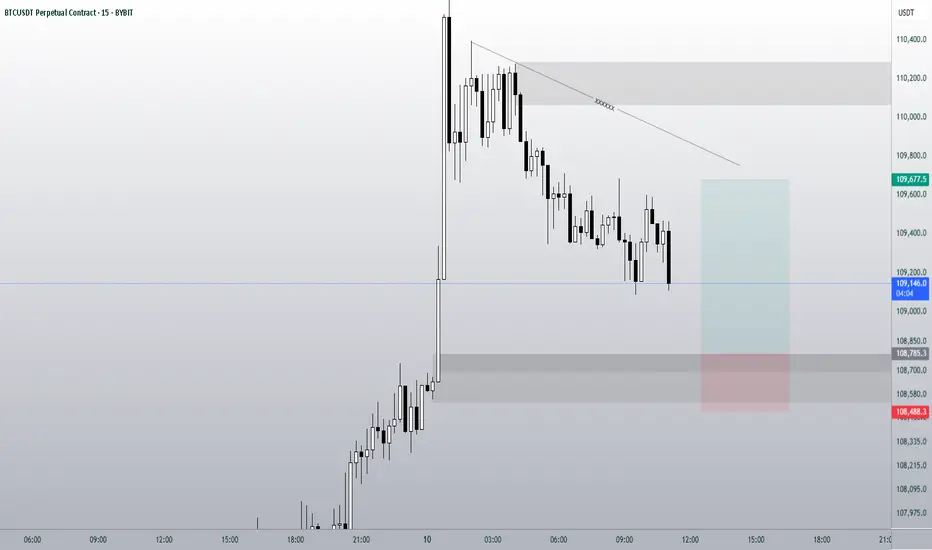
BTC/USDT Analysis (15m) – Short Position Setup📌 BTC/USDT Analysis (15m) – Short Position Setup
🔍 After a sharp rally, the market started a corrective phase and formed a bearish structure with lower highs.
A sell limit order is placed at the 110063 supply zone, targeting potential continuation to the downside.
🎯 Target: 108578
⛔️ Stop Loss: 110557
⚠️ Risk/Reward: Favorable and aligned with current market structure.

Bitcoin (BTC) Technical Analysis and Trading Strategy
Daily Level
Price Structure: Last week, it fell to 100,000 points and did not break the support. Then it returned to the horizontal adjustment range, but it was still suppressed by the downward trend line above, and the overall high-level decline structure was maintained.
K-line pattern: The two consecutive days of closing cross stars showed that the long-short game intensified, but there was no clear direction.
Momentum indicator: RSI continued to shrink, indicating that short-term momentum weakened, and attention should be paid to breakthrough signals.
4-hour level
Key resistance: 106,700 (horizontal channel top + downward trend line bonding pressure), breaking through is expected to test the 110,000 mark.
Key support: 103,500 (range bottom), 101,000 (strong support), if it falls below, it may form a head and shoulders top structure, and further look down to 97,600 (previous step support).
Short-term trading strategy
Short order opportunity
Entry area: 106,000-106,700
Stop loss: 108,000 (short order invalidated after trend line breakthrough)
Target: 103,500 → 101,000
Long order observation point
If the price stabilizes above 106,700, you can wait for confirmation of the retracement before arranging long orders, with a target of 110,000.
If it stabilizes at 101,000-103,500, you can consider short-term rebound trading.
Key trend judgment
Break above 106,700 → Continue to adjust upward and test 110,000.
Break below 103,500 → Confirm the head and shoulders top, target 97,600.
Range oscillation (103,500-106,700) → Wait for a breakthrough signal.
(Risk warning: Pay attention to changes in market liquidity and the impact of macro data, and strictly stop loss.)

BTC's trading strategy for todayBTC has continued its upward trend as analyzed. It tested the resistance area above 110,000 today and began to decline. A small - scale decline is expected within the day, and short - term trading can try shorting.
BTC's trading strategy for today:
BTCUSDT sell@110000-111000
tp:108000-107000
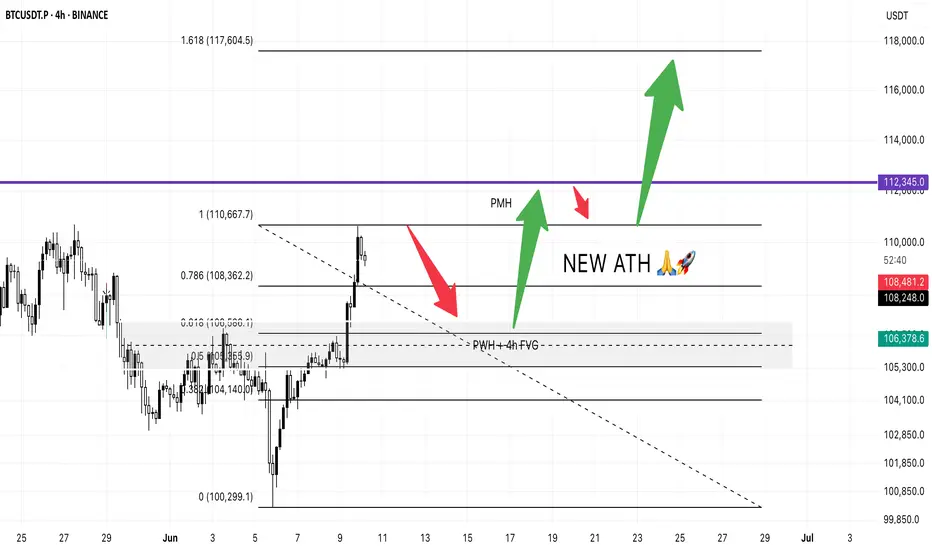
Bitcoin Pre-CPI PlanJust like in trading it’s all about structure, levels and reaction.
We’ve seen BTC bounce cleanly from the psychological level of $100,299 and rally all the way to $110,667.
Based on that impulse move, I’m watching the 0.618 Fibonacci retracement at $106,586 as a potential dip-buy zone. That level aligns perfectly with:
✅ 4H Fair Value Gap
✅ Previous Week High
If we get a healthy CPI print today, I expect BTC to continue the bullish move and go for a new ATH.
🎯 First target: $112,345 (slightly above Previous Month High)
📉 Then, a potential pullback to $110,667 (support retest)
🚀 Followed by a breakout move to $117,604 the 1.618 Fib extension
All eyes on today’s CPI. If the data is good, the sky’s the limit.
Let’s see if bulls have the strength to push it all the way. 💪📈
Bitcoin Breaks Out: Bullish Momentum Builds Above Key LevelsHello guys!
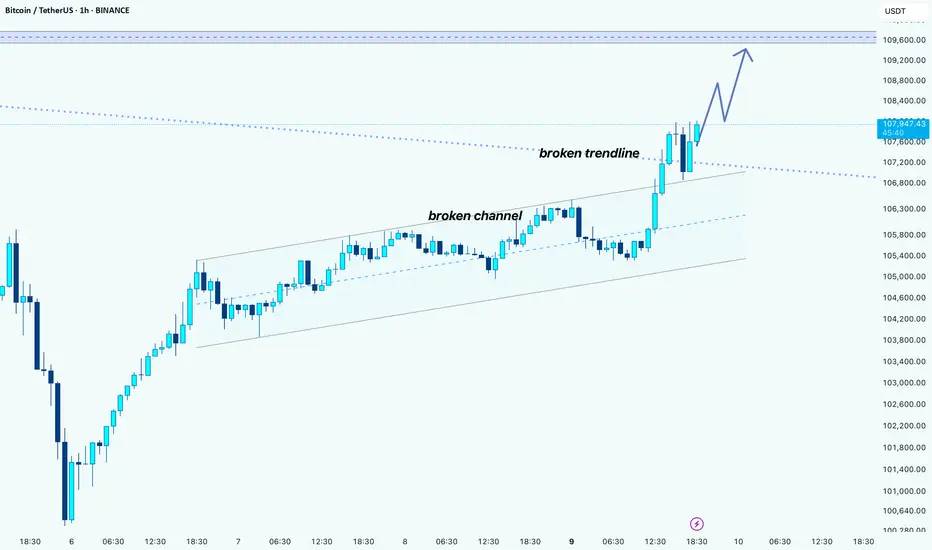
The chart of Bitcoin reveals a significant bullish breakout, characterized by two key technical developments:
Broken Ascending Channel:
Bitcoin was trading within an ascending parallel channel, gradually making higher highs and higher lows. This channel was recently breached to the downside, suggesting a temporary weakening in momentum.
False Breakdown and Strong Reversal:
Despite the initial breakdown from the channel, Bitcoin swiftly reversed and surged upwards, reclaiming previous support levels with strong bullish candles. This “fake-out” move often traps bears and reinforces bullish sentiment.
Trendline Breakout:
More notably, BTC has broken above a descending trendline, which had acted as a resistance zone. This breakout, backed by strong volume and momentum, indicates a shift in market structure from consolidation to potential expansion.
Projected Upside Target:
Based on the breakout projection drawn on the chart, the next major resistance appears near the $109,600 level. This aligns with the upper purple dashed line, which may represent a historical resistance zone or a Fibonacci extension.
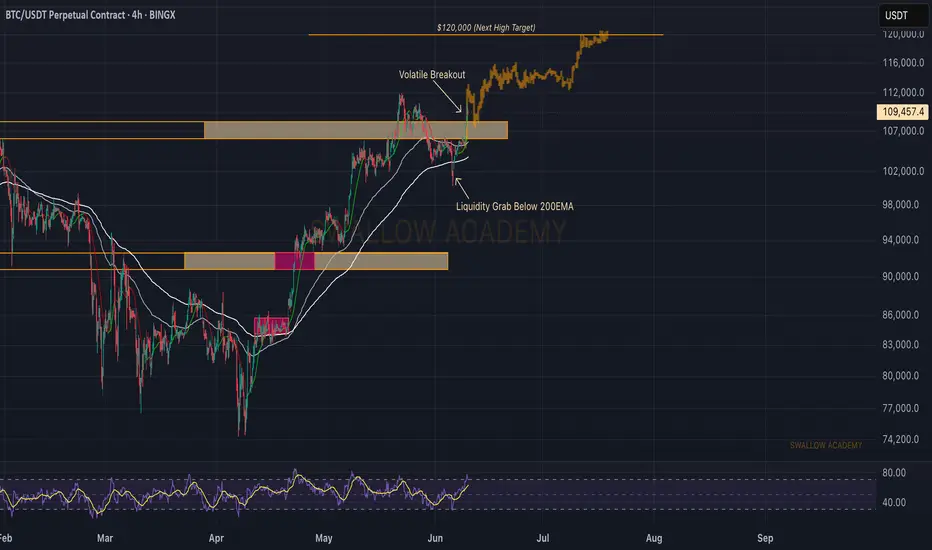
Bitcoin (BTC): Heading Towards The All Time Hight Bitcoin is still pushing into the second day of the week, where the price is heading towards the ATH area for a retest and potential breakout (which we have been looking for). Now if we keep that same momentum, we are guaranteed to retest the ATH area, where high volatility can be expected!
Swallow Academy
Lingrid | BTCUSDT support Bounce After Flag Pattern BreakoutBINANCE:BTCUSDT recently rebounded from the intersection of the upward channel and horizontal support near 103,705 after a false breakdown from the flag pattern. The price is now challenging the downward trendline from above, hinting at a potential breakout. A sustained move above this zone may open the path toward the 108,800 resistance.
📈 Key Levels
Buy zone: 103,500–104,000
Buy trigger: breakout and close above 105,600
Target: 108,800
Sell trigger: close below 103,000
💡 Risks
Rejection from the downward trendline could revive bearish pressure
Sideways consolidation under resistance weakens momentum
A break below the channel base may invalidate the bullish setup
Traders, if you liked this idea or if you have your own opinion about it, write in the comments. I will be glad 👩💻
