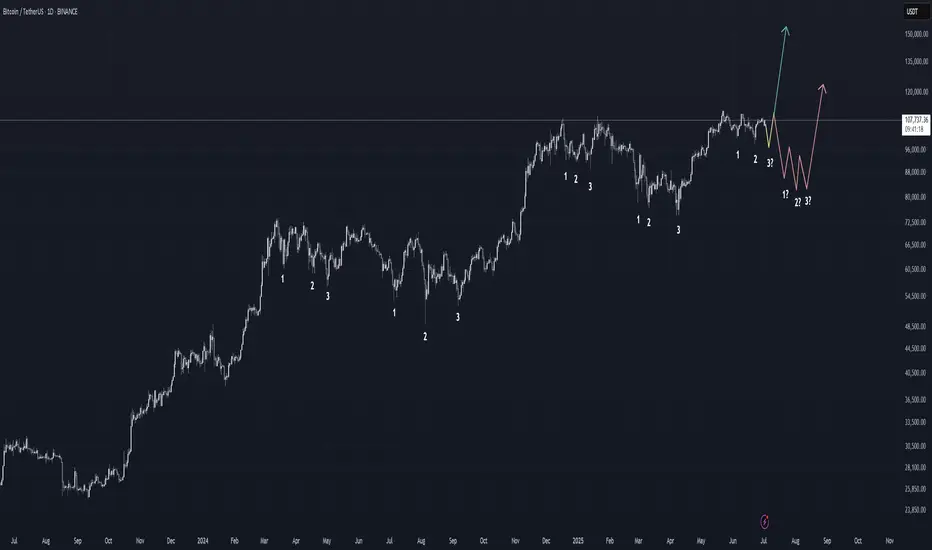
BTC third tap incoming? Recently, BTC has traded for a large amount of time in ranging environments. These ranges have started with a local range high and then an initial 3-tap accumulation (i.e., a local low and then two sweeps of that low) before making a solid attempt at the range highs. The sweeps of the lows are meant to shake people out and provide fuel to try to break higher. The previous two times, that initial attempt failed and the price was sent lower to put in a second 3-tap accumulation at lower prices.
Will the current price move back down to put in the 3rd tap of the current relatively small accumulation? That is my base case. I believe we will see some lower prices locally to put in the 3rd tap. I think the Bitcoin Swing Trade Indicator (BSTI) will fire off green one more time and then we will then make a run to try to break out of this current massive range (that started last year in November). This current range is fairly small, so it is not worth it to me to sell here to try to buy lower.
The bigger question is: Will we have enough fuel to durably break out of this range after the 3rd tap of the current accumulation (green line) or are we destined to repeat the pattern of the last two bigger ranges (red line), one of which we are still in? I personally believe we will break out after the smaller range 3rd tap (the green line) based on the larger context of cycle theory, how long we have been in this range, and how the current small range is part of the larger range starting back in November 2024.
It will be interesting to see what happens.
Da_Prof
Note that TV won't allow publication of a private/unpublished indicator anymore or I would have shown the BSTI, which is now published as invite only. It's implementation is too complicated to publish openly, so I don't feel comfortable doing that. If you want access, please DM me on TradingView. Thanks.
BTCUSDT.PS trade ideas
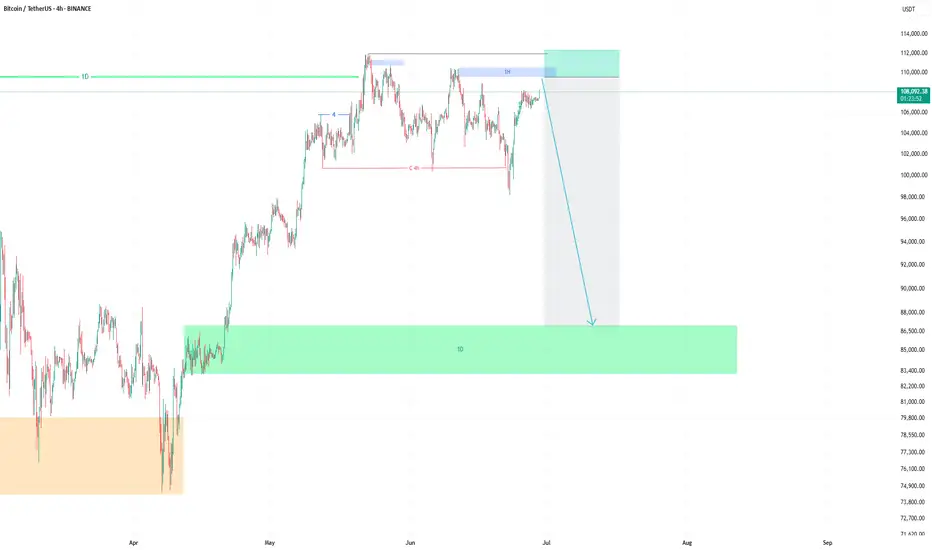
Short to 86KIt really wants to go up to 110,000 and then drops to 86,000.
So it's better to think about selling at higher levels than buying.
Bitcoin Faces Resistance Rejection — Bearish Divergence Signals Bitcoin is showing signs of exhaustion as it stalls near a high-timeframe resistance level aligned with the value area high (VAH). Recent price action has formed multiple lower timeframe bearish divergences while testing dynamic resistance. This level has now capped further upside attempts and could trigger a market rotation lower if rejected again.
With price consolidating directly beneath this barrier, the probability of a pullback grows stronger, especially if no bullish confirmation breaks the current ceiling.
Key Technical Points:
- Bearish Divergence Developing: Price is holding below the VAH with a weakening momentum signature
- Converging Resistance Zone: Dynamic SR and VAH are aligned at $108,350, now acting as a ceiling
- Range-Based Rotation Setup: If rejected, price could rotate down to the point of control and value area low
Bitcoin’s current structure is classic range behavior, with price gravitating from low to high and back. At the moment, it’s stalled at the value area high, which represents the upper boundary of the most recent range. This level — around $108,350 — has been tested several times, and now a bearish divergence is forming across key momentum indicators like RSI and MACD.
In addition, price is showing multiple rejections against dynamic resistance, forming a pattern of lower highs on lower timeframes. The longer this resistance zone holds, the more likely price will revert to the point of control (POC) — the area with the highest traded volume in the range. If that level doesn’t hold either, a full rotation to the value area low becomes the next probable scenario based on market auction theory.
This rotation would represent a complete cycle from value area high acceptance back to value area low rejection, which is common when buying pressure fades and sellers regain control. For now, Bitcoin remains technically vulnerable as long as price stays capped beneath the $108,350 level.
Bitcoin’s next move hinges on whether it can reclaim the $108,350 resistance zone with volume. If not, expect a corrective phase that targets the POC first, followed by potential continuation down to the value area low. This bearish setup remains valid until price closes decisively above current resistance.
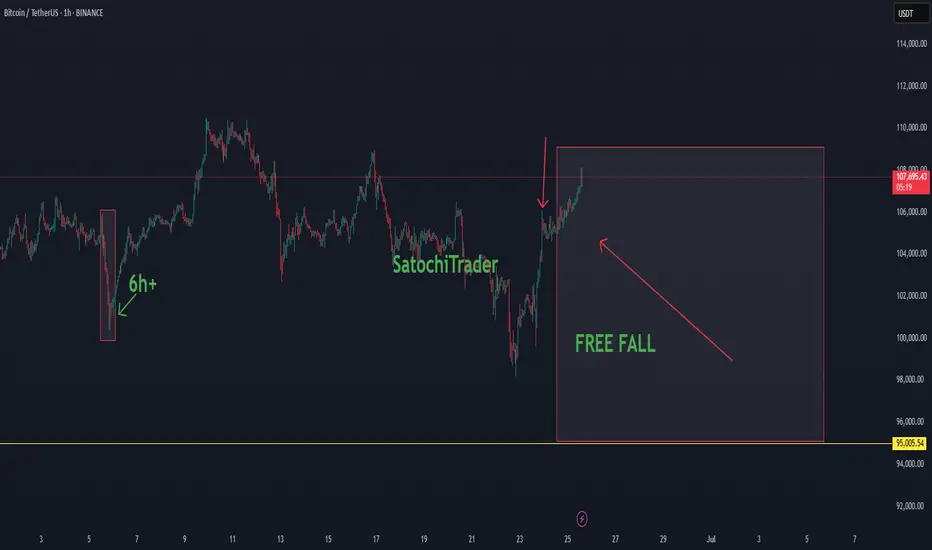
SatochiTrader Expecting a huge BTC CRASH AFTER This..BTC Market Update by SatochiTrader
EVERY CRASH DID START WITH A FALSE INCREASE TREND.
Depending on the market sentiment and price action, BTC is currently showing strength with a positive trend. However, based on deeper data and insights held by myself and a small group of early-cycle followers, this current movement may be a deceptive signal — potentially foreshadowing a major crash.
This is not trading advice. Those who are confident in the long position should continue, and those on the other side should stay prepared as well.
We have previously explained that the current cycle appears to have ended. Since 2013, BTC has consistently respected its macro cycle targets. The end of such a cycle typically leads to significant corrections.
A cycle ending implies not just a retracement, but the potential for a major crash. Hedge funds and real BTC whales understand the underlying indicators and risks at play. Our expectation remains clear: BTC may soon fall below the 100K level, with $85K identified as a critical support and target zone.
Stay sharp. Stay informed. The market may look bullish — until it isn't.
The best way to follow BTC is not the news.. but the cycle overview.
This update is an education update, which means the high expectations of the upcoming correction for BTC.
Compared to last quarter, miners are now less severely underpaid, though profitability remains low
As simple as it gets - Short then longDescending channel, posible scalping trades ahead before support confirmation at 98,000-100,000. Once confirmed, I would expect a nice bullish swing towards breakout. What do you all think?
BTCUSDTHello Traders! 👋
What are your thoughts on BITCOIN?
Bitcoin has once again failed to break above its previous high and entered a corrective phase. The price is now moving within a channel and is approaching the lower boundary of that channel.
The correction is expected to continue toward the support zone and the bottom of the channel, where we may see buying interest and a bullish reaction.
If Bitcoin breaks above the channel resistance and key supply zone, it could trigger a strong upward move and lead to new all-time highs.
Key Note:
Price action near the channel support and demand zone will be crucial. A successful rebound from this area may signal the start of the next bullish leg.
Will Bitcoin hold the channel and bounce higher, or is a deeper correction ahead? Share your thoughts below! 🤔👇
Don’t forget to like and share your thoughts in the comments! ❤️

BITCOIN WATCH the break and close of 108k level,this will open a buy into 114-113k supply roof and it will be a quick take profit at that level.
if we close below 108k from the channel on 4hr then we are looking at sell into 94-95k 4hr demand floor .
#btc #bitcoin

Trade of the day!These are the areas I have my eyes on. We are in a range and can get a long or short play here. If we break bullishly, I will be wary of the supply above, if we break down here there's a lot of liquidity to sweep. Lets see what happens
Confirmation: MS change on secondary TF or Divergences
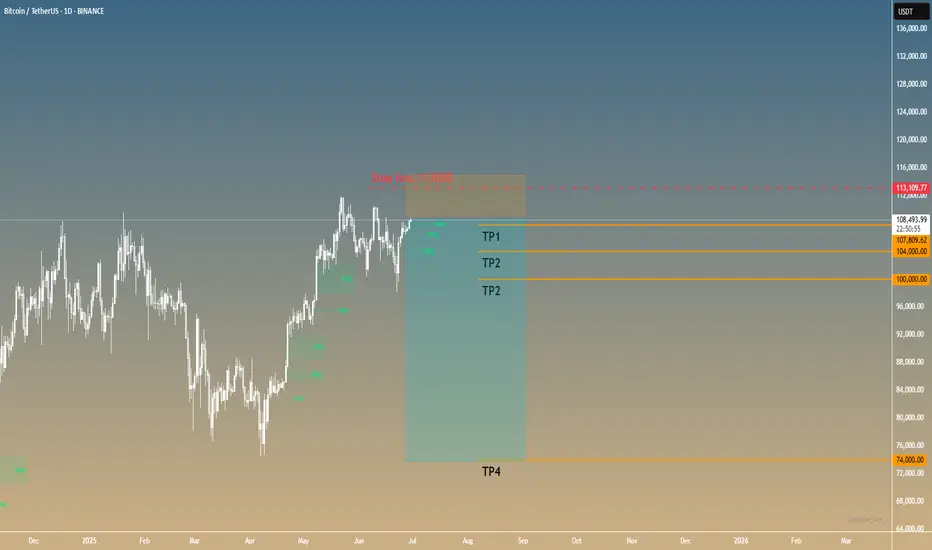
BTCUSDT SHORT SIGNAL Setup Type: Liquidity Trap & Distribution
Trade Idea (SHORT):
Entry Zone: $108,000 – $110000
Stop Loss: Above $113000
Take Profit Targets:
TP1: $104,000
TP2: $100,000
TP3: 98000
TP4: 74000
This analysis is for educational purposes only and does not constitute financial advice.
Always do your own research and apply proper risk management.
Trading involves risk, and you are solely responsible for your decisions.
Use this information as a guide — not a guaranteed outcome.
Wait for clear confirmation before executing any trade.
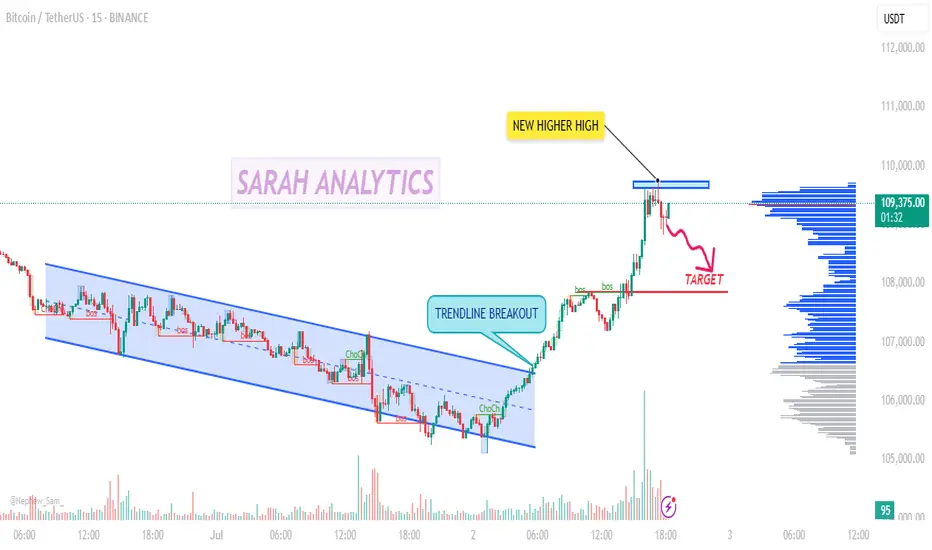
Bitcoin Just Broke Out - Smart Traders Are On This Zone Next?📈 BTCUSDT 15m – Trendline Breakout with Retest Opportunity
Price broke out of a descending channel with strong bullish momentum, forming a new higher high, confirming a short-term bullish reversal. Currently pulling back toward a key support zone around $108,200–$107,800, offering a potential buy-the-dip opportunity.
• Trendline Breakout confirmed with volume surge
• Retest zone: $108.2K–$107.8K (prior resistance → support)
• TP levels: $109.8K / $110.5K / $111.2K
• SL: Below $107.3K for risk control
• R:R: 2:1 to 3:1 potential
Watching for bullish reversal confirmation before entry. Trade what you see, not what you feel!
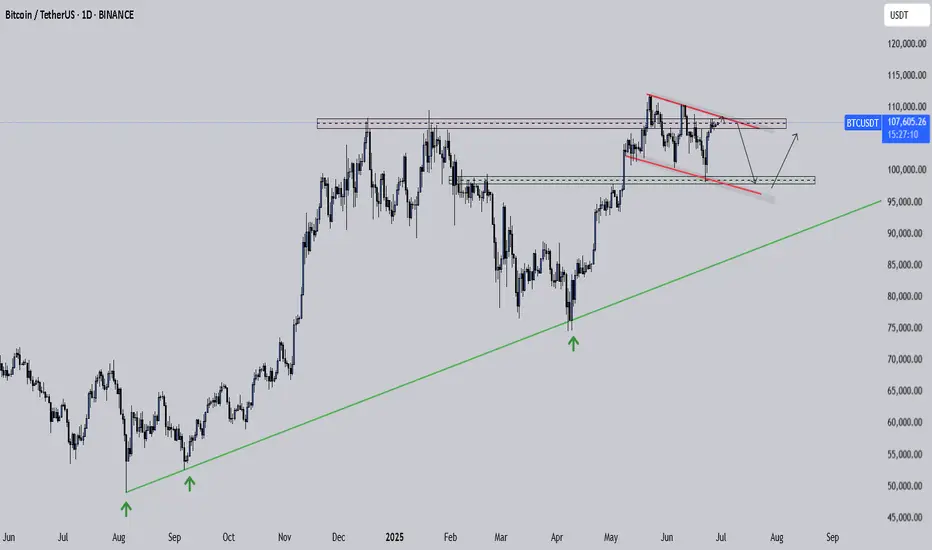
Bitcoin Pressing Up But This Compression Could Crack LowerBitcoin has been steadily climbing for months, respecting that long-term trendline since last year. Each dip into it brought a strong bounce, showing bulls are still in control of the bigger picture.
But right now price is pressing into a tight descending resistance line. We can see it making lower highs while struggling to break above that red trendline. At the same time, it’s sitting just above a key horizontal range, where buyers stepped in before.
This compression is risky . If BTC fails to push above the descending resistance and breaks back below the box, it could drop toward the next demand zone around the low 100K region .
As long as the major trendline from last year holds, the broader uptrend is intact . But losing this structure would open the door for a deeper correction.
This is the kind of spot where patience pays. Let the breakout or breakdown show its hand before jumping in heavy.
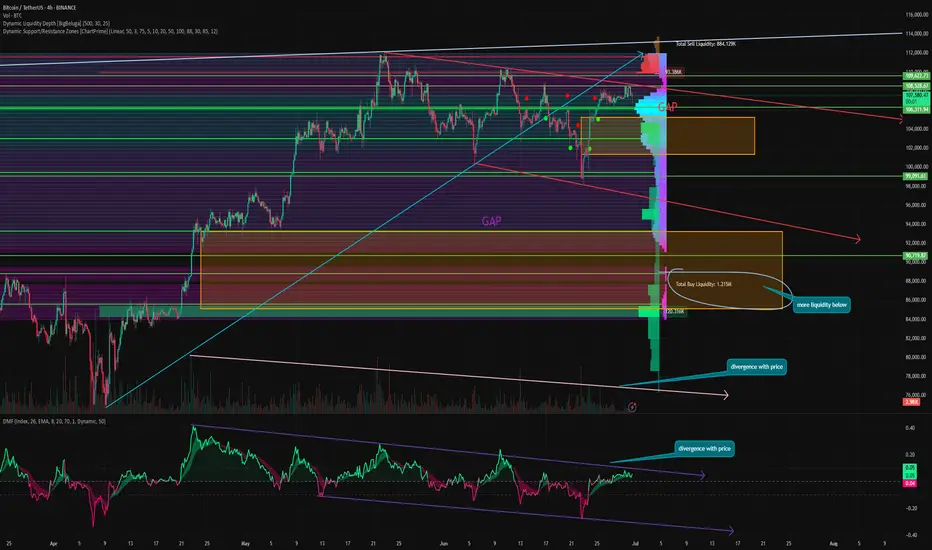
Bitcoin will no longer update ATH, and here's why⚡️ Hello, everyone! I decided to update my idea about Bitcoin. Let's see what awaits us!
Bitcoin rebounded strongly over the weekend and is now trying to consolidate at the $107,000 level. This is a key level, which is the MSB level for the entire current momentum since May, and as long as the price remains below it, it is a bearish movement.
Last week, we also closed the GAP to the $98,000 level from the previous movement, but on the way up, we formed a new one at $105,250 - 101,360. And as we know, 99% of GAPs close sooner or later.
📉 Bitcoin also continues to move in a descending flag, which, although it is a bullish pattern in an upward impulse and more often breaks through upwards, has not been working that way for a long time. Trading based on technical analysis is the basis of crypto and has become very widespread, which is actively used by many whales and counterplayers. As a result, many pattern signals have long lost their relevance and now often give false signals.
⚙️ Metrics and indicators:
Volume - divergence with price since the end of April. Throughout this upward momentum, purchase volumes continued to decline. This indicates a lack of liquidity and demand for Bitcoin at present.
Money Flow - also divergence with price. Also, since the end of April, positions have continued to close and liquidity has continued to decline. This indicates a lack of interest in the asset.
Liquidity Depth - we know that the price moves from liquidity to liquidity, which serves as its fuel. And now there is much more liquidity at the bottom than at the top.
Support/Resistance - Based on the volume of interest, it is clear that the $106,000 level is a major zone, and if it is lost, the nearest support level will only be at $103,004, but with significantly lower volumes.
📌 Conclusion:
Despite all the huge inflows into ETFs, there is now even less liquidity in Bitcoin than in November 2024, when Trump became president.
This suggests that everyone is actively closing their positions and there is no new money coming in. Search queries for the tags “crypto” and “bitcoin” are not even close to last year's levels, let alone 2021 levels. This means that there is no new retail interest in crypto right now.
I don't see any catalysts right now that could keep the price at this level. And ETFs are not an indicator at all; we've already seen how these “smart money” buyers bought at 110k on ATH and sold even more at 70k.
🔥 So, right now, I recommend sitting back and watching. Let the market sort itself out and indicate the direction of movement going forward.
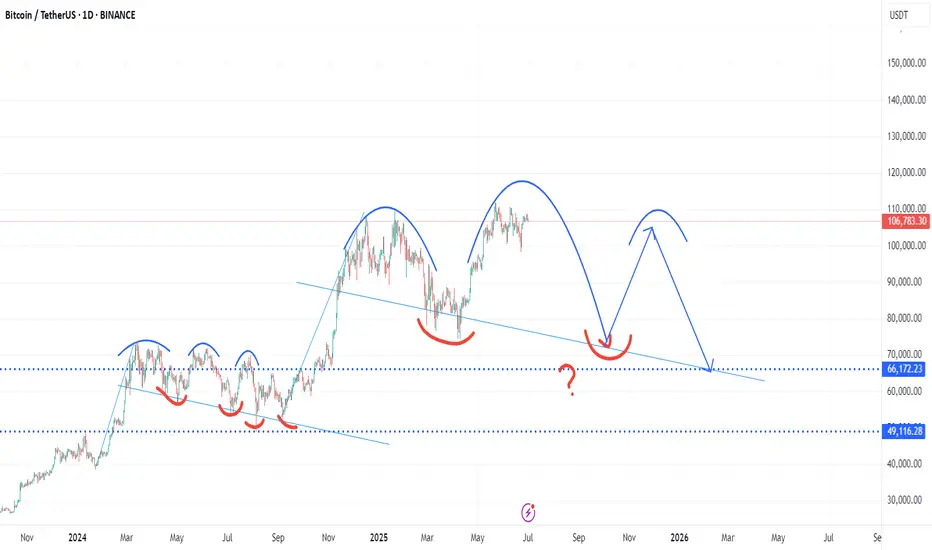
Bitcoin Mirror Cycle: History Repeats? | 2024–2025 PatternThis chart presents a potential repetition of Bitcoin’s 2024 price cycle (Jan 23 – Aug 5, 2024), projected to mirror itself from September 6, 2024 through Q3–Q4 2025. The hand-drawn arcs suggest a repeating pattern of rounded tops, distribution, correction, and potential accumulation zones. Key support levels are marked near $66,172 and $49,116, indicating where price may retrace before a potential bounce or deeper macro-driven selloff.
Technically, the chart hints at a large-scale cyclical structure—a classic market psychology pattern where prior cup-and-handle or double-top formations play out again on a broader timescale.
🌍 Global Context Overlay:
War & Geopolitical Tensions:
The ongoing risk of conflict escalation (e.g., Iran–Israel, Ukraine–Russia, and potential East Asian tensions) may lead to increased volatility in risk assets like crypto. Wars historically bring uncertainty, which may initially crash speculative markets but later fuel inflationary hedges like Bitcoin.
U.S. Elections (Nov 2024):
Political instability or leadership changes can impact Federal Reserve policy, regulation, and market sentiment, directly influencing BTC price direction post-election.
Recession Fears & Rate Cuts (2025):
With central banks expected to pivot towards rate cuts in 2025, liquidity could flow back into risk-on assets, possibly triggering the bounce scenario shown in the latter part of your drawing. If rate cuts come too late, however, a steeper correction into the $49K zone becomes more likely.
Global Debt Crisis & De-Dollarization:
Growing debt concerns and countries moving away from the USD may boost Bitcoin’s long-term appeal as a non-sovereign store of value, reinforcing the second rally illustrated in your sketch.
The only plays you need this week! 🚀 Join us as we dive into the highs and lows of Bitcoin this week! 🔥
Opportunities like this don’t show up every day — and we’ve got a strong feeling there’s a 10X trade hiding somewhere in this video! 👀💰
We’re locked in on the charts like eagles 🦅, watching closely to see if any of our setups come to life. You won’t want to miss what’s coming next! 📈📊
✨ Stay tuned for daily updates, smart setups, and sharp moves! ✨
📅 Weekly Schedule:
🛠️ Daily Setups: Monday to Friday
🎓 Class: Every Tuesday (if stars align 🌟 – subject to confirmation)
Let’s make it a big week! 💪🚀

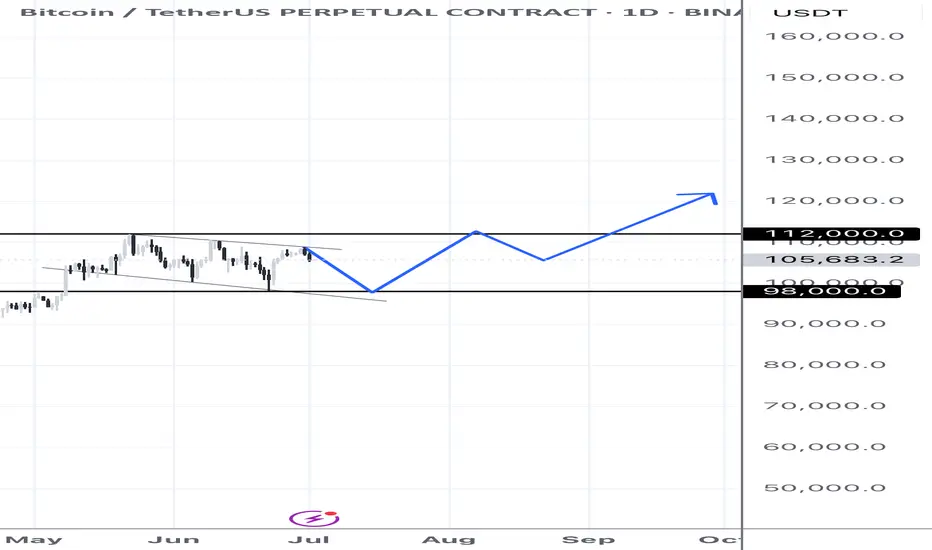
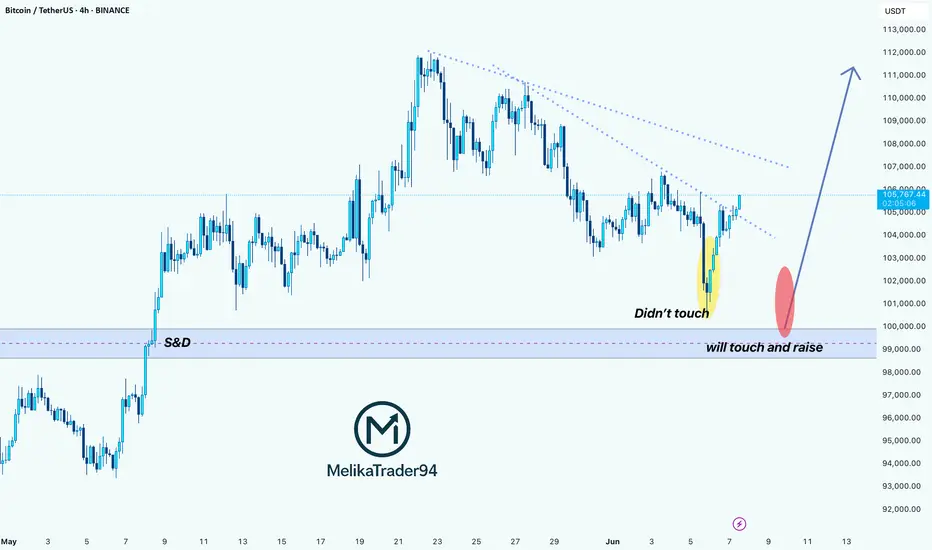
BTC Is Replaying a Bullish Fractal >>> Are You Watching?Hello guys!
I see a deja vu here! Let’s look at the historical daily chart (Jan–May 2025):
What happened?
Initial Drop (Yellow Oval): Bitcoin approached a key S&D zone but didn't touch it, triggering a short-lived bounce before dropping again.
Second Drop (Red Ovals): This time, price precisely touched the demand zone, triggering a clean bullish reversal.
What followed was a strong trend breakout, sustained higher lows, and an eventual surge past prior resistance levels.
Current 4H Chart Setup: A Mirror Image?
Yellow Highlight: Once again, we saw a bounce that didn't quite touch the key demand zone ($98K–$100K).
Red Zone Prediction: If this mirrors the historical move, the price is likely to return and touch this S&D area before launching a bullish leg.
Blue Path Projection: A sharp reversal is expected post-touch, aiming toward $111K–$113K as the next key resistance zone.
The descending trendline adds confluence
___________________
History Doesn’t Repeat, But It Often Rhymes
Based on this fractal analysis, Bitcoin is likely forming the same bullish base seen earlier in 2025. The setup hinges on one key event: a return to the $99K–$100K zone, where demand is likely to step in aggressively.
If the pattern repeats, the current market may offer one last high-reward long opportunity before a parabolic rally.
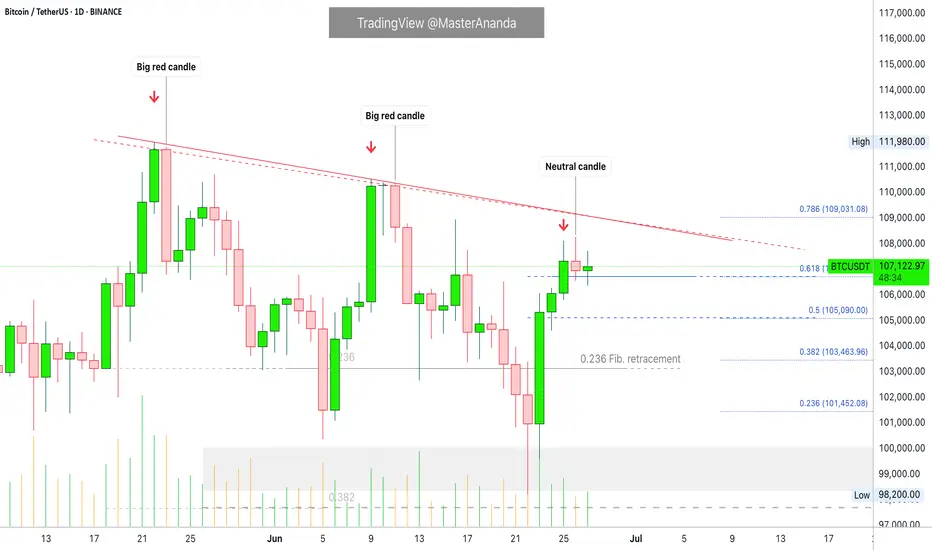
Bitcoin, The Next High Is The All-Time HighThe title might be a bit misleading but, the truth is that Bitcoin stays bullish short-term and this is bullish on all terms...
Good afternoon my fellow Cryptocurrency trader, how are you feeling today?
Any day, any week, any moment; every month, place or year, the market provides everything we need to know. This information is made available to us through the chart.
Bullish Bitcoin
The present signal is the fact that Bitcoin remains very high, challenging resistance, after a strong recovery and advance. This is happening with the altcoins also.
If you look at the last two peaks, as soon as resistance was hit there was an immediate crash. The next day was full red; very strong bearish action and momentum and this led to a new low. The situation is not the same today.
22-May peak. 23-May, strong bearish action.
9-June peak. 11-June, strong bearish action.
26-June lower high (not a peak). Today, neutral action. This neutral action is what I am taking as a bullish signal. Many other factors of course support this conclusion yet, this is still an early signal.
Fib support
A closer view of the daily timeframe:
4H. The grey line represents Fib. retracement. Dark blue—Fib. extension:
Conclusion
Each time there is a price peak a retrace follows, if there is no retrace then you are not witnessing a peak but rather a stop, a pause; resistance being met.
It seems that the current lower high is not the end but rather just a pause before additional growth. Market conditions can change.
It can happen that several days Bitcoin goes sideways with the bulls failing to garner enough strength. In this scenario, there would be a move lower before additional growth.
The present scenario shows a bullish chart even if prices drop, remember, the market is in no hurry.
Easy money
In September we will have lower interest rates and this is a bullish development for Bitcoin. Advanced money minds see easy money as inflationary for the currency, while Bitcoin is inflation-proof. So the dollar goes down and Bitcoin goes up.
I didn't quite develop this point, next time I'll do a better job.
Summary
The market is good even if it shakes. The market is good and isn't shaking, the recovery is already in place.
Bitcoin's price is very strong and there are many layers of support. The altcoins are in a similar situation, growing from the bottom up.
The Fed will reduce interest rates in September and then once more before the year ends, this is bullish for everything so, everything will be going up, at least everything that we are interested in, support and trade.
Thanks a lot for your continued support.
Never give up!
You are divine! You are blessed.
If you are reading this now, you will be blessed for your great timing. Hard work and dedication always pays.
Keep moving forward, keep pushing forward, never give up.
When life hits you hard, do take a break if you need it, only to comeback with new energy, a new mind and an infinite drive to achieve your goals.
You are the reason why Bitcoin exist... You are the lifeblood of the market.
Without you, nothing is possible. It is because of you that we all continue to grow.
Thanks again for taking the time to read.
I appreciate your support.
Namaste.
PRICE SPECULATION ON BTCUSD!Price updates from the H1 timeframe . Price is likely to drop from the current high after we saw a distribution stage currently forming, therefore, a sell opportunity is envisaged.
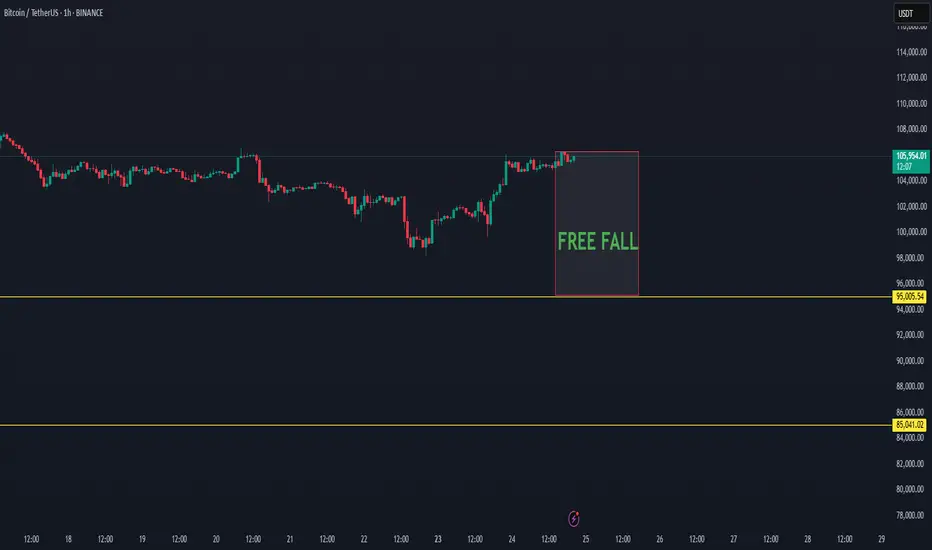
UNEXPECTED RISK CRASH FREE FALL AFTER TREND DATA FOR TH NEXT 48HDepending on our study, BTC has a high chance of a new crash below 100K.
The next 48 hours are important for the trend change of BTC, which can allow the trend to free-fall below 100K
BTC is at a top, and it did recovery always recovered on the M volume top., We are now again on the same trend.
BTC can return below 100K as this update shows, with the possibility of targeting the main target 85K - This is the trend zone for new interest.
The reason for this crash is that BTC has not confirmed the cycle, which means the end of the cycle. There is always possibility that the market can act green, but we expect it can show an unexpected breakdown.
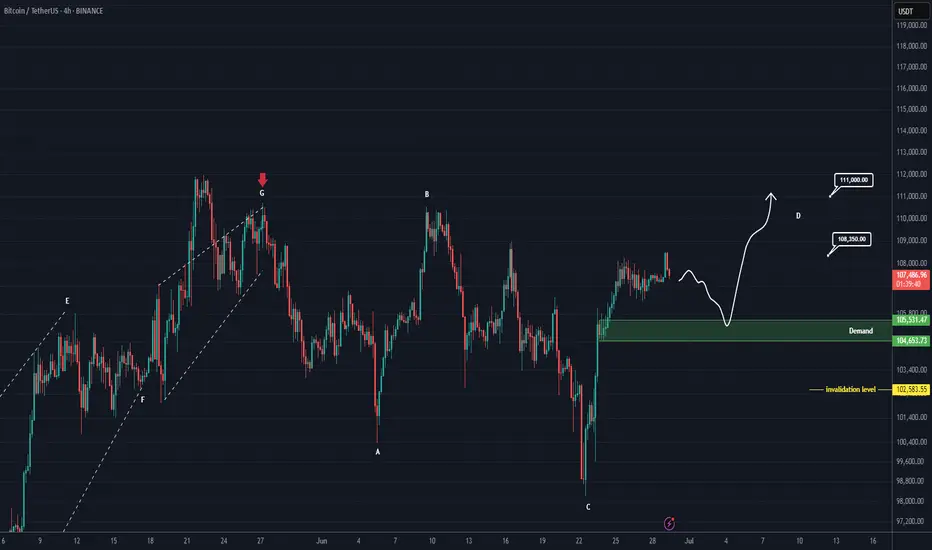
BTC Analysis (4H)This analysis is an update of the analysis you see in the "Related publications" section
Since the red arrow was placed on the chart, Bitcoin's bullish phase has ended and it has entered a corrective phase. This correction appears to be forming a Diametric pattern, and we are currently in the middle of wave E.
After interacting with the demand zone, the price may move toward the specified targets.
A daily candle closing below the invalidation level will invalidate this analysis.
For risk management, please don't forget stop loss and capital management
Comment if you have any questions
Thank You
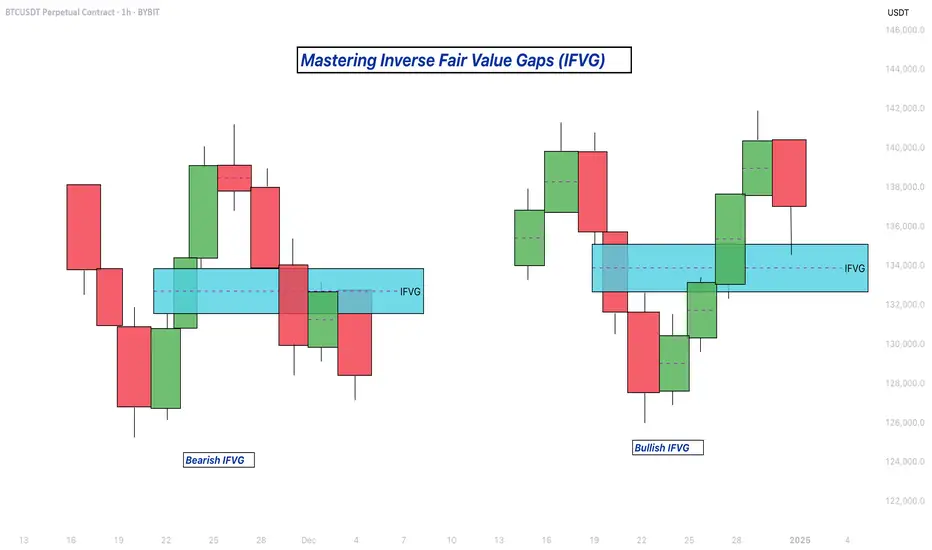
Mastering Inverse Fair Value Gaps (IFVG) - How to use them?In this guide, I’ll explain the concept of the Inverse Fair Value Gap (IFVG), how it forms, and how you can use it to identify high-probability trading opportunities. You'll learn how to spot the IFVG on a chart, understand their significance in price action, and apply a simple strategy to trade them effectively.
What will be discussed?
- What is a FVG
- What is an IFVG
- What is a bullish IFVG
- What is a bearish IFVG
- How to trade the IFVG
-------------------------------
What is a FVG?
A FVG is a technical concept used by traders to identify inefficiencies in price movement on a chart. The idea behind a fair value gap is that during periods of strong momentum, price can move so quickly that it leaves behind a "gap" where not all buy and sell orders were able to be executed efficiently. This gap creates an imbalance in the market, which price may later revisit in an attempt to rebalance supply and demand.
A fair value gap is typically observed within a sequence of three candles (or bars). The first candle marks the beginning of a strong move. The second candle shows a significant directional push, either bullish or bearish, often with a long body indicating strong momentum. The third candle continues in the direction of the move, opening and closing beyond the range of the first candle. The fair value gap itself is defined by the price range between the high of the first candle and the low of the third candle (in the case of a bullish move), or between the low of the first candle and the high of the third (in a bearish move). This range represents the area of imbalance or inefficiency.
-------------------------------
What is an IFVG?
An Inverse Fair Value Gap (IFVG) occurs when a traditional Fair Value Gap (FVG) is not respected by price, and instead of acting as a support or resistance zone, price breaks through it with strength. Normally, a Fair Value Gap represents a price imbalance left by a strong move, and when price returns to this area, it often reacts by respecting the gap, bouncing off it or reversing, because it's seen as a high-probability level where orders may rest.
However, in the case of an IFVG, price does not respect this imbalance. Instead, it slices through the FVG in the opposite direction, showing that the initial momentum behind the imbalance has weakened or reversed. This breach is a strong indication that market sentiment is shifting. What was once a zone of strength now becomes invalid, and this failed reaction signals that the opposite side of the market (buyers or sellers) has taken control.
The IFVG highlights a key transition in momentum. It tells traders that the prior bias, bullish or bearish, is breaking down, and the new dominant force is pushing price beyond levels that would typically hold. This makes the IFVG useful not only as a sign of failed structure but also as a potential confirmation of a trend reversal or strong continuation in the opposite direction. Essentially, where an FVG usually acts as a wall, an IFVG is what’s left after that wall gets knocked down.
-------------------------------
What is a bullish IFVG?
A bullish Inverse Fair Value Gap (IFVG) occurs when price breaks through a bearish Fair Value Gap (FVG) instead of respecting it. In a typical bearish FVG, the expectation is that when price retraces into the gap, it will react to the imbalance, usually by reversing lower, as the area represents previous selling pressure or inefficiency caused by aggressive sellers.
However, when price does not react bearishly and instead breaks cleanly through the bearish FVG, it signals a shift in market sentiment and momentum. This breakout through the imbalance suggests that buyers are now in control and that the bearish pressure in that zone has been absorbed or invalidated. What was once considered a resistance area is now being overpowered, often leading to continued bullish movement.
-------------------------------
What is a bearish IFVG?
A bearish Inverse Fair Value Gap (IFVG) occurs when price breaks through a bullish Fair Value Gap (FVG) instead of respecting it. In a normal bullish FVG, the expectation is that when price returns to the gap, it will act as support and prompt a move higher, as this area represents a previous imbalance created by strong buying pressure.
However, when price fails to respect the bullish FVG and instead breaks down through it, this signals a shift in momentum to the downside. The anticipated support fails to hold, suggesting that buyers are no longer in control or that their efforts have been overwhelmed by aggressive selling. This kind of move transforms the bullish FVG into a bearish signal, as it confirms weakness in what was previously considered a demand zone.
-------------------------------
How to trade the IFVG?
Trading the Inverse Fair Value Gap (IFVG) requires patience, precision, and clear confirmation of a shift in momentum. The process involves waiting for key conditions to form before entering a trade. Here's how to approach it step-by-step:
First, you need to wait for a liquidity sweep. This means price must take out a recent high or low, typically a short-term liquidity pool, trapping traders on the wrong side of the market. This sweep sets the stage for a potential reversal and indicates that the market is ready to shift direction.
After the liquidity sweep, watch for a 1-minute Fair Value Gap (FVG) to form and then get broken in the opposite direction. This break is crucial, it’s what creates the Inverse Fair Value Gap. The invalidation of this initial FVG confirms that momentum has switched and that the market is no longer respecting the previous imbalance.
Once the IFVG has formed, your entry comes on the close of the candle that breaks and closes beyond the IFVG, above it in a bullish scenario, or below it in a bearish one. This close confirms that the gap has not held and that price is likely to continue in the new direction.
Place your stop loss below the low (for a bullish setup) or above the high (for a bearish setup) of the structure that formed the IFVG. This gives you protection just beyond the level that would invalidate the setup.
-------------------------------
Thanks for your support.
- Make sure to follow me so you don't miss out on the next analysis!
- Drop a like and leave a comment!
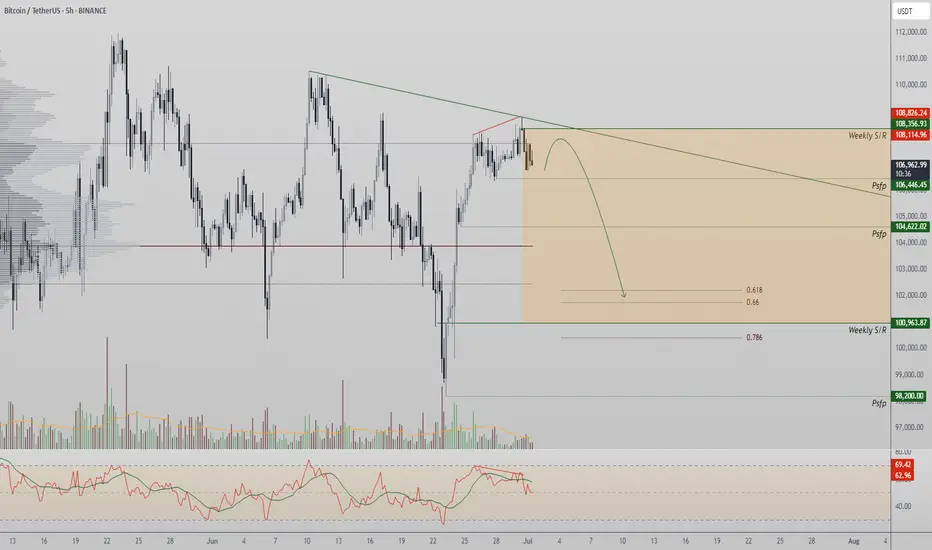
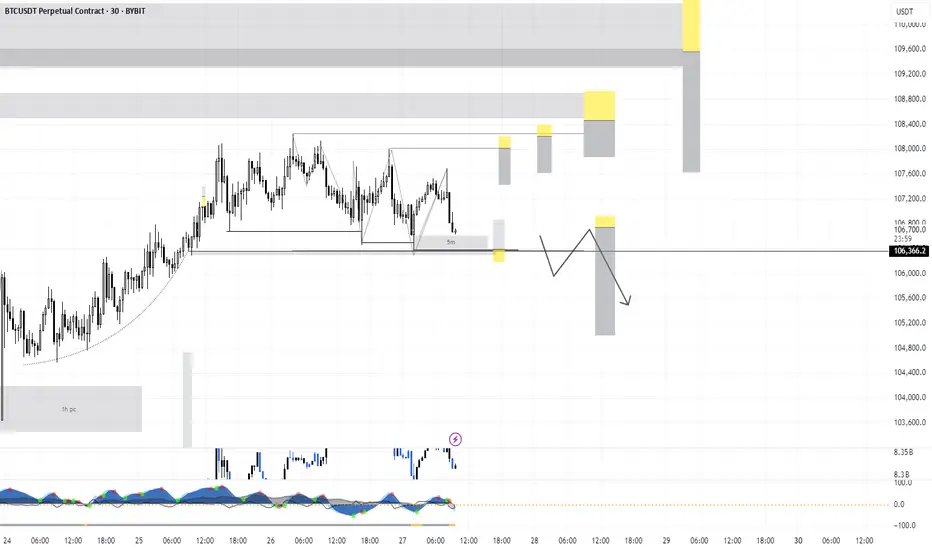
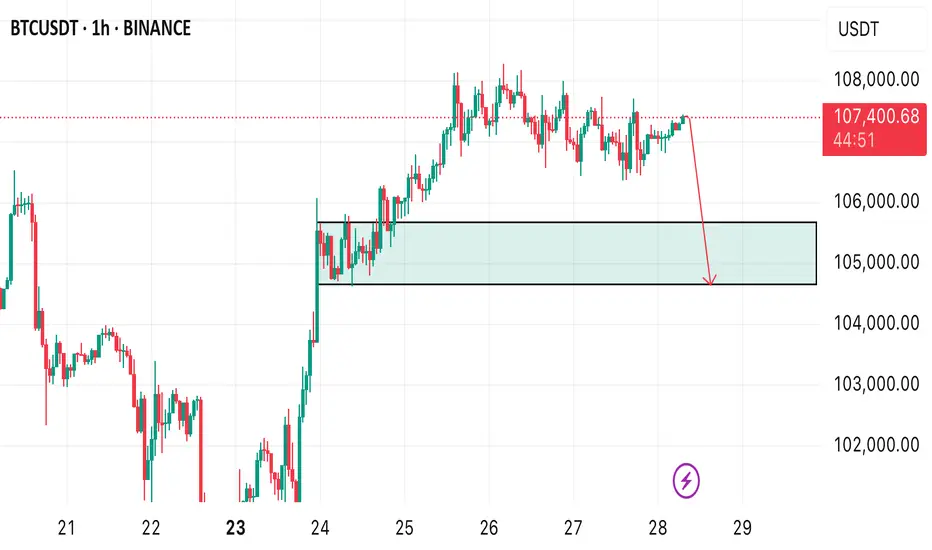
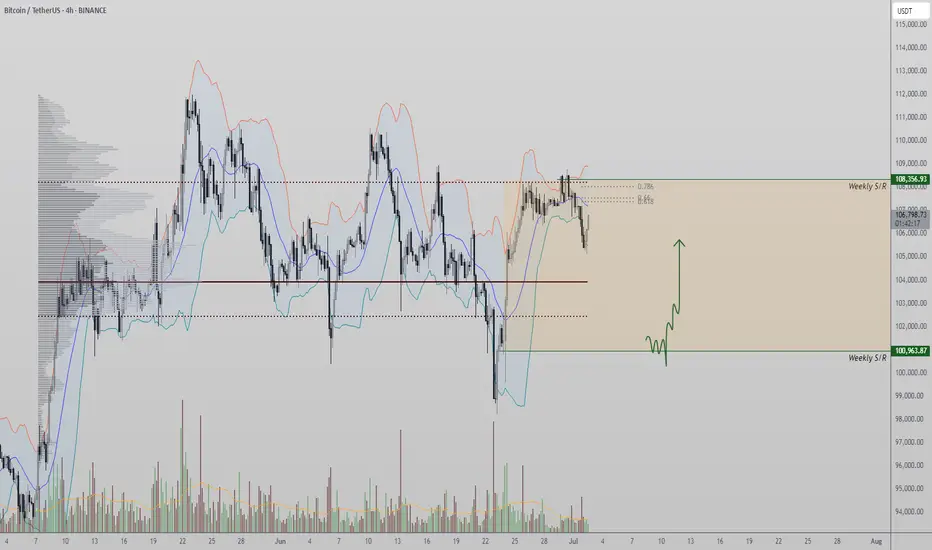
Bitcoin Rejected at Value Area High — Full Market Auction Lower?Over the past 24 hours, Bitcoin has seen a short-term pullback after being rejected from the daily resistance level, which aligns with the value area high. The reaction also coincides with a volatility squeeze shown on the Bollinger Bands — hinting at a controlled, technical rejection rather than a panic selloff. If the market follows traditional auction theory, a full rotation toward the value area low may now be in progress.
Key Technical Points:
-Value Area High Rejection: Price was rejected from high time frame resistance and respected auction theory principles
-Targeting $103,000 Value Area Low: Price may rotate lower if resistance continues to cap upside
-$100,000 Psychological Support Untapped: Remains a magnet for liquidity if the range plays out fully
Bitcoin’s structure over the past week has remained range-bound between $108,000 and $100,000. The recent failure to break through the value area high at the upper end of this range has now triggered a controlled pullback — technically expected based on market auction dynamics. Once a value area high is respected and price cannot sustain above it, the natural response is for the market to seek equilibrium by rotating toward the value area low.
This theory aligns with current confluences: the rejection occurred exactly where daily resistance, the value area high, and upper Bollinger Band resistance converged. The rejection was not sudden or erratic, but gradual — indicating that this is likely a technical rejection, not emotional selling. If this rotation plays out as expected, the next key support will be found near the $103,000 region.
What further supports this narrative is the untouched $100,000 psychological level, which remains a natural magnet for both liquidity and sentiment. From a market structure perspective, $100K serves as a clean test zone for buyers to step in and attempt to form a bottom — particularly if the pullback is slow and controlled rather than volatile and sharp. Until then, all signs suggest that the upper limit of the current range has held.
If Bitcoin remains capped beneath $108,000, expect further downside pressure. A full market auction rotation could bring price to $103,000, with the potential to dip as low as the $100,000 psychological level. This zone will be key for judging the strength of buyers and determining whether the range continues or a broader breakdown begins. Only a reclaim of the value area high would invalidate this structure.
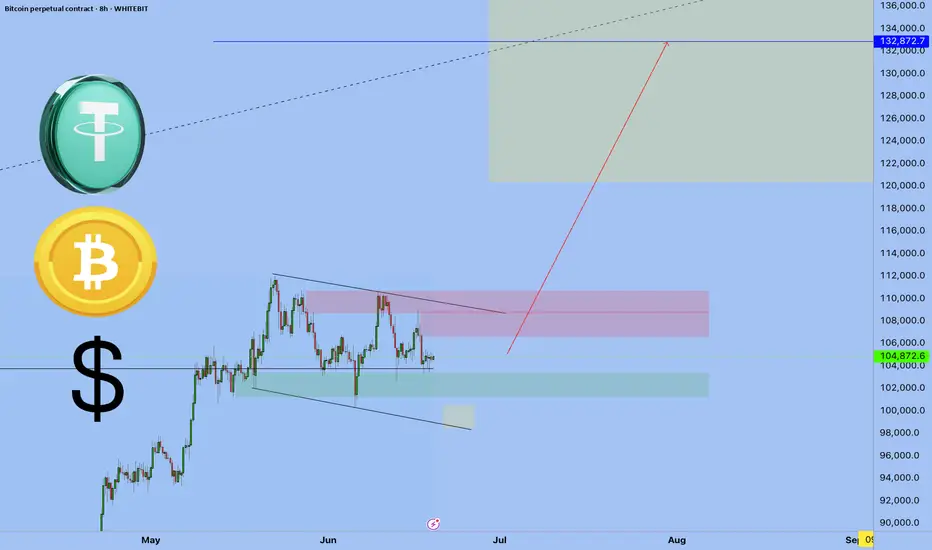
Dollar's Decline: Global Economic ShiftsYou're probably wondering why I'm talking about the dollar on the Bitcoin chart. It's because I want you to look a few steps ahead.
That's why this post is for people like that.
1. Global Economic Transformations: Collapse of the Jamaican Monetary System
Insights and Logic:
We are witnessing the end of the Jamaican monetary system, established in 1976 following the collapse of the Bretton Woods system.
The Jamaican system's key feature is free (yet conditionally market-driven) exchange rates and the global dominance of the U.S. dollar.
For decades, the U.S. utilized the dollar's reserve currency status to finance budget and trade deficits without equivalent value returns—a beneficial "global tax."
Facts:
Currently, over 60% of global reserves are denominated in dollars (IMF data), but diversification is accelerating.
The U.S. is facing a "liquidity trap": to sustain markets, the Fed must print money, exacerbating inflation and weakening the dollar's global effectiveness.
Analogy:
Just as Nixon abolished the gold standard in 1971, we are now witnessing the abolition of the dollar's global standard—not abandoning the dollar as a reserve currency, but its monopoly.
2. Political Environment in the U.S.: Trump, Tariffs, and Managed Uncertainty
Insights:
Court decisions against Trump's tariffs are political tools, especially prior to congressional elections.
Democrats aren't just fighting for power—they systematically undermine Trump's economic policies in voters' eyes.
Systematic Explanation:
Virtually any presidential decree in the U.S. can be challenged legally. Lower-court decisions rarely withstand appeals, yet they create temporary buffers allowing policy adjustments.
This enables Trump to recalibrate his trade model systematically without losing face.
Conclusion:
The U.S. operates under "managed uncertainty," where seemingly chaotic political behaviors are structured adaptation mechanisms to global changes.
3. Mass Market and Sixth Technological Paradigm: NBIC as Foundation for Future Growth
Insights:
The future mass market will be built around NBIC technologies:
* Nano—new materials and sensors;
* Bio—biotech, genetic engineering, life extension;
* Info—digital platforms, neural networks, blockchain;
* Cogno—cognitive interfaces, AI, neural interfaces.
Historical Analogy:
Just as cars and mobile phones defined the mass market of the 20th century, longevity treatments, AI services, and neural devices will define the 21st century.
Facts:
Examples of current "false starts": Nvidia, Palantir, OpenAI—stock price volatility relates not to technology failures but premature valuation.
Forecast:
The next 20 years will see growth in new sectors, dominated by those capturing mass consumers, not just investors.
4. Digitalization and Geo-economics: Telegram, AI, and Control
Facts:
Telegram plans to integrate Grok neural network—a signal of the digital merger of communication, payment platforms, and behavioral analytics.
Insight:
Telegram as a future super-app: messaging, finance, AI assistance—all-in-one.
This is a media reset: traditional platforms like Bloomberg and CNBC lose influence to those controlling data flows directly.
Conclusion:
Information landscapes become automated—algorithms, not journalists, manage narratives.
5. **Europe: From "Progress Locomotive" to Stagnation and Subcontracting**
Facts:
Germany has been in recession for three consecutive years. The average age is 46.
Pension burdens and social standards make the economic model (Rhineland capitalism) unsustainable.
Ideological Crisis:
Europe is split into "transhumanist" (West) and "neoconservative" (East) factions.
The neoconservative revolution is gaining ground in Hungary, Poland, Slovakia, Romania, and even eastern Germany.
Conclusion:
Europe is skipping the sixth technological paradigm, becoming a "comfortable but uncompetitive" zone. Europe's "Japanification"—a path without acute crises but also without growth.
6. Future Growth Centers: Asia and the Global South with Risks
Facts and Locations:
Indonesia, Vietnam, Thailand—dynamic economies with high ROI and moderate political risks.
Philippines, Taiwan—potential proxy-conflict zones between the U.S. and China.
Logic:
Global capital moves towards higher returns rather than better living standards.
Asia becomes a new economic and geopolitical battleground similar to 20th-century Europe.
7. Role of Cryptocurrencies and USDT, USDC: Transition to Digital Dollar
Facts:
U.S. authorities view cryptocurrencies, especially USDT, as tools to reboot the dollar model.
USDT effectively integrates the dollar into the crypto economy, maintaining Treasury demand and allowing dollar exports outside the U.S.
Insights:
Unlike CBDCs, the U.S. digital dollar (via stablecoins) enables global expansion rather than local control.
The U.S. aims to lead the new monetary evolution—digital dominance instead of fiat.
8. Prospects in Latin America: Argentina, Mexico, and Risks
Argentina Analysis:
President Milei implements neoliberal reforms akin to Ukraine's: reduced state role and deregulation.
Possible outcomes: deindustrialization, increased poverty, export dependency.
Positives:
No war risks, resource-rich (oil, wine, food), good medicine and education standards (legacy).
Mexico:
High growth yet severe crime levels—excellent for business, risky for life.
9. Global Hybrid War Instead of a Third World War
Concept:
Not a "world war" but a global hybrid war: multiple power centers, proxy conflicts, shifting alliances.
Theaters of conflict: Asia (especially the South China Sea), potentially the Middle East and Africa.
Strategic Conclusion:
Avoid proxy countries; prefer "neutral dynamic" regions like Indonesia, Vietnam.
About DXY
I have been talking about the fall of the dollar index for a very long time.
September is coming soon
Best regards EXCAVO
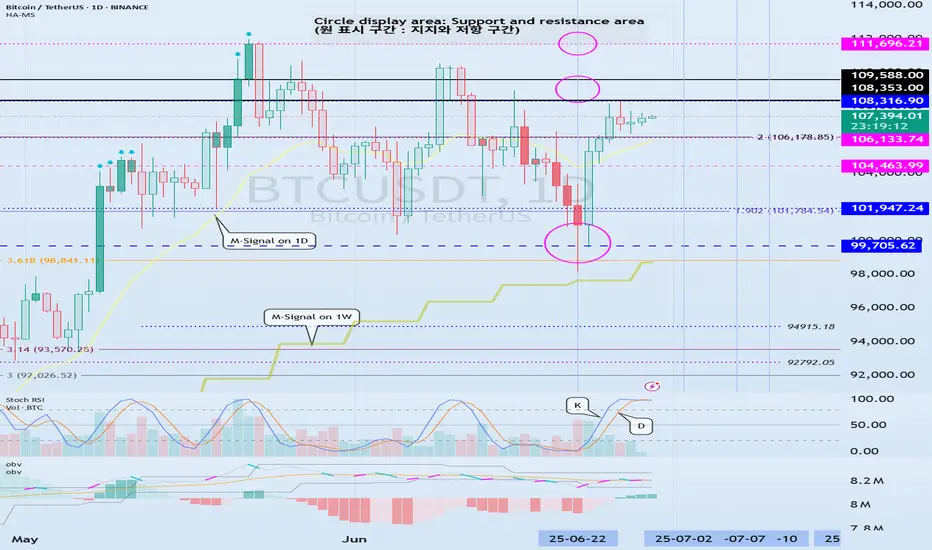
StochRSI indicator and support and resistance levels
Hello, traders.
If you "follow" me, you can always get the latest information quickly.
Have a nice day today.
-------------------------------------
The StochRSI indicator on the left chart is slightly different from the StochRSI indicator on the right.
The StochRSI indicator on the left chart is the StochRSI indicator provided by default in TradingView, and the StochRSI indicator on the right chart is an indicator with a modified formula.
The StochRSI indicator is a leading indicator that is reflected almost in real time.
Therefore, it reacts sensitively to price changes.
Although it is advantageous because it reacts sensitively, it also increases the possibility of being caught in a fake, so I thought that a slight delay(?) was necessary, and so I created the StochRSI indicator on the left chart.
If you look at the relationship between the K and D of the StochRSI indicators on the two charts, you can see that there is a big difference.
In the end, you can predict the movement by checking whether the movement of the K line has escaped the overbought or oversold section.
However, I think that you will receive information that can determine the sustainability of the trend depending on the positional relationship between K and D.
Therefore, it is important to distinguish the inflection points that occur in the StochRSI indicator.
This is because these inflection points provide important information for drawing trend lines.
Therefore, the StochRSI indicator on the left chart, which better expresses the inflection point, is being used to draw the trend line.
(Unfortunately, this indicator was not registered on TradingView because I did not explain it well.)
-
As a new candle was created, the StochRSI indicator on the left chart is showing an inflection point on the K line.
The StochRSI indicator on the right chart is showing a transition to a state where K < D.
We will have to check whether the inflection point was created only when today's candle closes, but I think that the fact that it is showing this pattern means that there is a high possibility of a change in the future trend.
Since the next volatility period is expected to start around July 2nd (July 1st-3rd), I think it has started to show meaningful movements.
-
It is true that you want to buy at the lowest price possible and sell at the highest price.
However, because of this greed, one mistake can lead to a loss that can overturn nine victories, so you should always be careful.
Therefore, if possible, it is better to check for support and respond.
In that sense, I think it is worth referring to the relationship between K and D of the StochRSI indicator on the left chart.
This is because the actual downtrend is likely to start when K < D.
-
In order to check for support, you definitely need support and resistance points drawn on the 1M, 1W, and 1D charts.
Ignoring this and checking for support at the drawn support and resistance points can result in not being able to apply the chart you drew to actual trading.
Therefore, you should draw support and resistance points first before starting a trade.
Otherwise, if you draw support and resistance points after starting a trade, you are more likely to set support and resistance points that reflect your subjective thoughts, so as I mentioned earlier, you are more likely to lose faith in the chart you drew.
If this phenomenon continues, it will eventually lead to leaving the investment market.
-
It is important to determine whether there is support by checking the correlation between the StochRSI indicator and other indicators at the support and resistance points drawn on the 1M, 1W, and 1D charts.
Even if the inflection point of the StochRSI indicator or other indicators occurs at a point other than the support and resistance points you drew, you should consider it as something that occurred beyond your ability to handle.
In other words, you should observe the price movement but not actually trade.
As I mentioned earlier, if you start to violate this, you will become less and less able to trust the chart you drew.
-
Accordingly, the basic trading strategy I suggest is to buy near the HA-Low indicator and sell near the HA-High indicator.
However, since the HA-Low and HA-High indicators are expressed as average values, they may move in the opposite direction to the basic trading strategy.
In other words, if the HA-Low indicator is resisted and falls, there is a possibility of a stepwise downward trend, and if the HA-High indicator is supported and rises, there is a possibility of a stepwise upward trend.
Therefore, the basic trading strategy mentioned above can be considered a trading strategy in the box section.
In the case of deviating from this box section, it is highly likely to occur before and after the volatility period indicated by the relationship between the trend line using the StochRSI indicator mentioned above and the support and resistance points drawn on the 1M, 1W, and 1D charts.
Therefore, special care is required when conducting new transactions during the volatility period.
This is because there is a high possibility of being caught in a fake when trading during the volatility period.
-
The DOM(60) and DOM(-60) indicators are good indicators to look at together with the HA-Low and HA-High indicators.
The DOM indicator is an indicator that comprehensively evaluates the DMI, OBV, and MOMENTUM indicators.
Therefore, the DOM(60) indicator is likely to be at the end of the high point range, and the DOM(060) indicator is likely to be at the end of the low point range.
In the explanation of the HA-Low and HA-High indicators,
- I said that if the HA-Low indicator receives resistance and falls, there is a possibility that a stepwise downtrend will begin,
- and if the HA-High indicator receives support and rises, there is a possibility that a stepwise uptrend will begin.
In order for an actual stepwise downtrend to begin, the price must fall below DOM(-60), and in order for a stepwise uptrend to begin, it must rise above DOM(60).
In other words, the DOM(-60) ~ HA-Low section and the HA-High ~ DOM(60) section can be seen as support and resistance sections.
-
If these correlations start to appear, I think you will be able to create a trading strategy that fits your investment style without being swayed by price volatility and proceed with trading.
The reason for analyzing charts is to trade.
Therefore, the shorter the time for chart analysis, the better, and you should increase the start of creating a trading strategy.
-
Thank you for reading to the end.
I hope you have a successful trade.
--------------------------------------------------