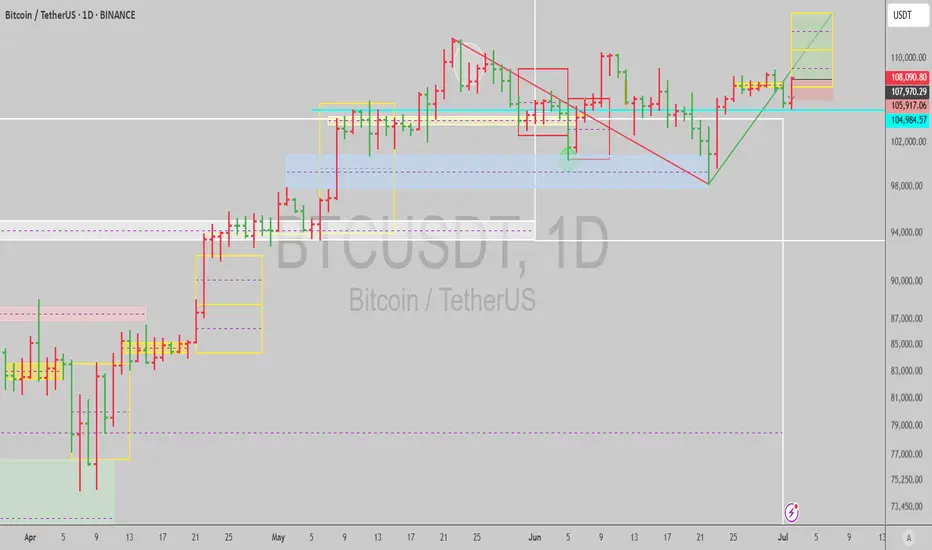
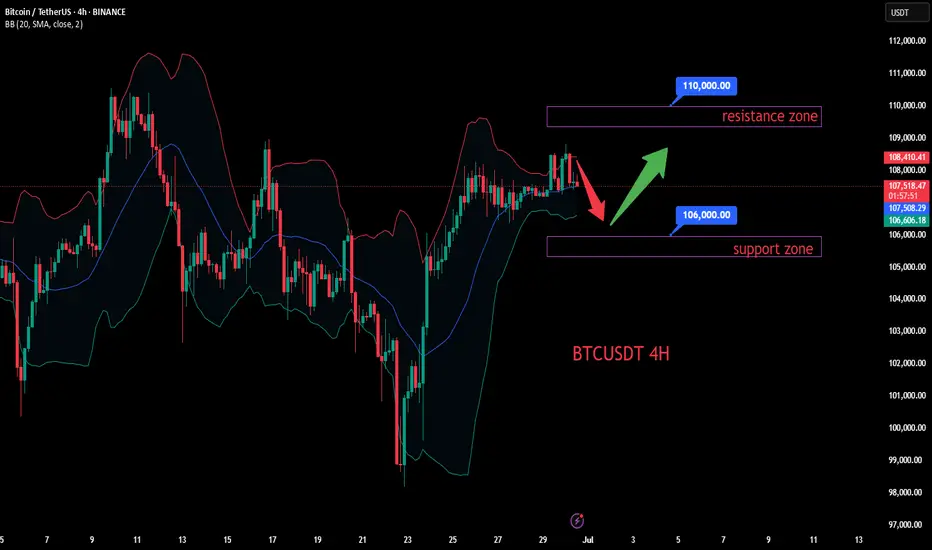
BTC buying power is gradually increasing💎 Update Plan BTC at the beginning of the week (June 30)
Notable news about BTC:
Anthony Pompliano has merged Procap BTC with Columbus Circle Capital I, established Procap Financial - a Bitcoin warehouse company up to $ 1 billion. The company will deploy lending activities, derivatives ... in order to create a collection line from BTC, according to the similar model
Bitcoin price is stable at about $ 107.4K on June 27, before the expiry date of options worth up to US $ 40 billion, capable of causing strong fluctuations. At the same time, on June 29, BTC exceeded $ 108k, up ~ 0.68% compared to the previous day
In the past 7 days, BTC maintained around $ 104–107K despite tensions in the Middle East and the US economic data is not heterogeneous. Reduce slightly but receive support from organized cash flow and global trade progress.
Technical analysis angle
Overview of trends - many signs of increasing
Looking at the candle is signaling "Strong Buy" on many time frames, especially healthy momentum, the ability to breakout $ 116k if surpassed the $ 110k resistance
ETF liquidity and organizational capital flows are supporting the trend of increasing, strengthening the possibility of breakthrough.
Moving Averages:
Frame 1H: 64% Bullish signal (MA20 reversed), but there is a neutral signal from short -term ghosts
Daily/Weekly: Golden Cross (Golden Cross) between 50‑ and 200‑ MA, is a long -term trend increase signal
Oscillators:
RSI frame Daily ~ 55, showing neutral momentum, not too much purchased but there is a rise. Double Rounded Top model on the chart Daily, the current trend is neutral - Bearish if the breakdown supports Neckline ~ $ 106k; In contrast, strong recovery above $ 114k will invalid this model
Long -term / Swing Trade: Keep the position if the price is maintained> $ 106k, use $ 103–104K as a spare hole stop.
Short -term / Scalp Trade: can be in order when the test price is $ 106k–107k, small latches around $ 110k.
==> Comments for trend reference. Wishing investors successfully trading
BTCUSDT.PS trade ideas
Bitcoin possible sell idea Bitcoin appears to be losing momentum, with buying pressure easing. This could signal a short-term selling opportunity as the market enters a correction phase.
Bitcoin (BTC): Aiming For $104,000 Before Next Bullish MoveWe are getting ready for another upward movement on Bitcoin, which we have marked as an area near $104K.
Ideal zone slightly below EMA where the order book has shown a decent amount of orders just sitting. This is the zone we will be looking for any kind of MSB to form with a proper breakout, which then would lead the price back to upper zones!
Swallow Academy
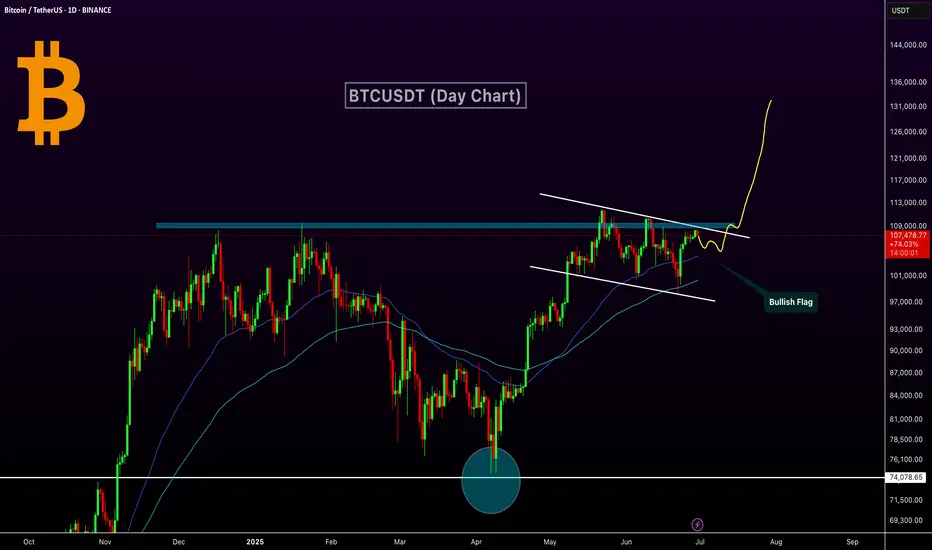
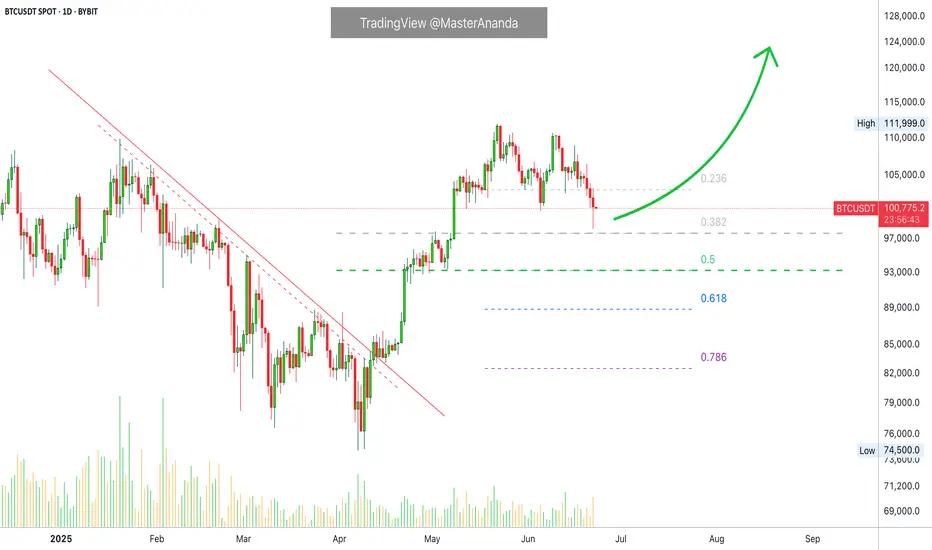
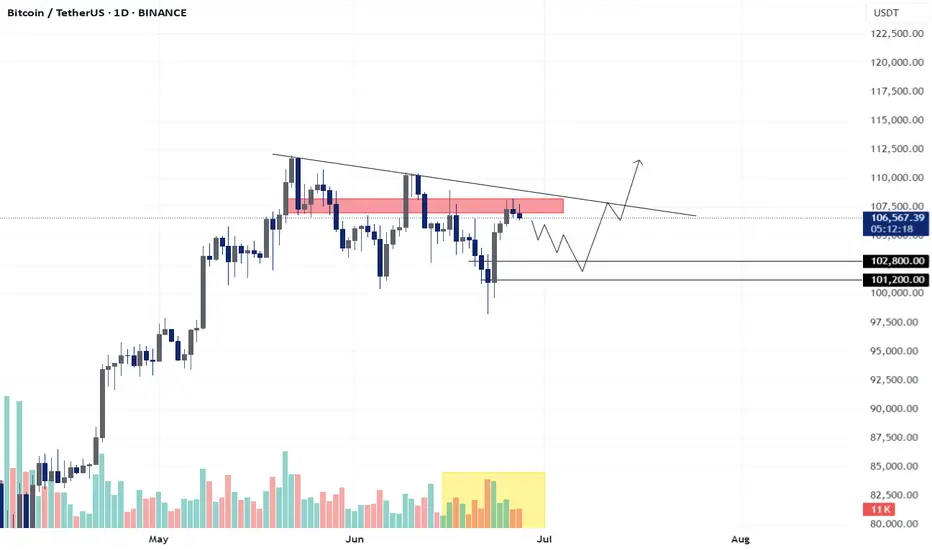
Bitcoin Bullish Flag Breakout Incoming?MARKETSCOM:BITCOIN is currently consolidating within a bullish flag pattern on the daily chart, following a strong impulse move from the $74,000 support zone marked in April. The price is hovering near a critical horizontal resistance zone ($ 108,000–$ 109,000), which has historically acted as a major barrier to further gains.
Technical Highlights:
Bullish Flag Pattern: Clear flag formation after a strong uptrend, suggesting continuation potential.
Strong Support Rebound: April's bounce from the ~$74K support zone marked a key higher low.
EMA: Price is currently trading above both the 50-day and 100-day EMAs — a bullish sign of momentum.
Breakout Potential: A confirmed breakout above the flag resistance (~$109K) could ignite a strong rally toward $130K+.
Breakout Move: If the flag pattern plays out, CRYPTOCAP:BTC could target the $125K–$135K zone in the coming weeks.
Buy Entry: Once the day candle closes above the flag resistance line
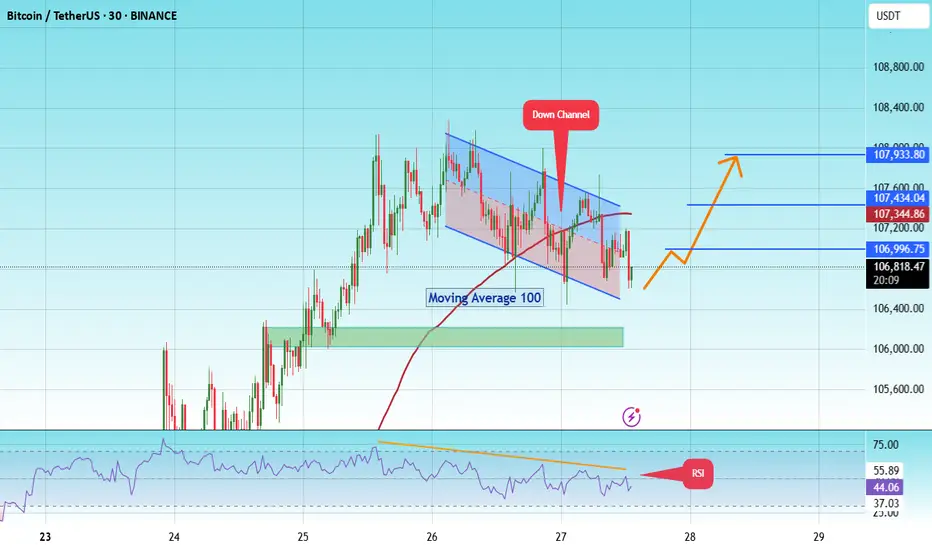
BITCOIN - Price can continue grow inside flat to $107933 level#BTC
The price is moving within a descending channel on the 1-hour frame and is expected to break and continue upward.
We have a trend to stabilize above the 100 moving average once again.
We have a downtrend on the RSI indicator that supports the upward move with a breakout.
We have a support area at the lower boundary of the channel at 106500, acting as strong support from which the price can rebound.
We have a major support area in green that pushed the price upward at 106000.
Entry price: 106736
First target: 106996
Second target: 107434
Third target: 107933
To manage risk, don't forget stop loss and capital management.
When you reach the first target, save some profits and then change your stop order to an entry order.
For inquiries, please comment.
Thank you.
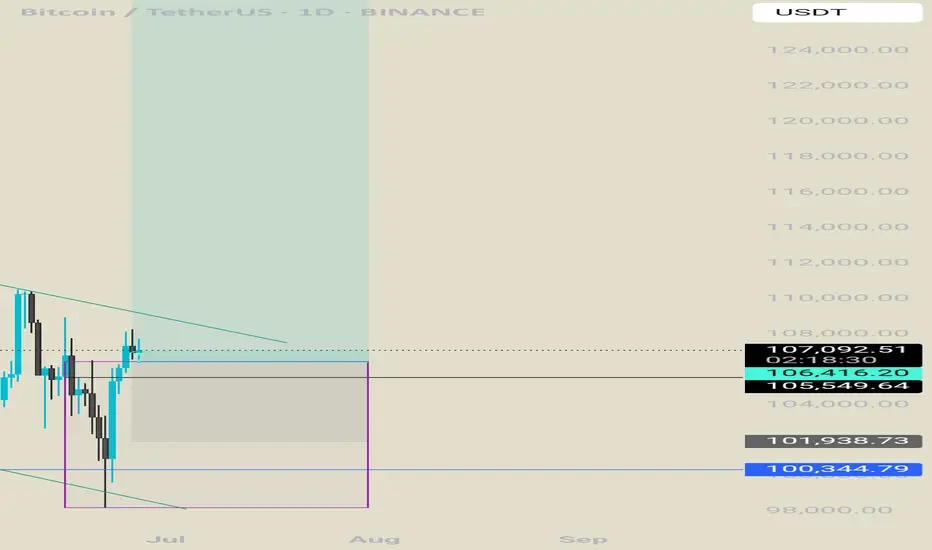
Bitcoin ready for new ALL TIME HIGHS.I think a breakout from this region is closer than people think.
Break of structure to the upside on the daily already occured . Order block is holding nice . A fvg has formed and a retest could occur , around 103.4k- 104.5k.
Overall the chart is bullish.
Next week we might see new All Time Highs.
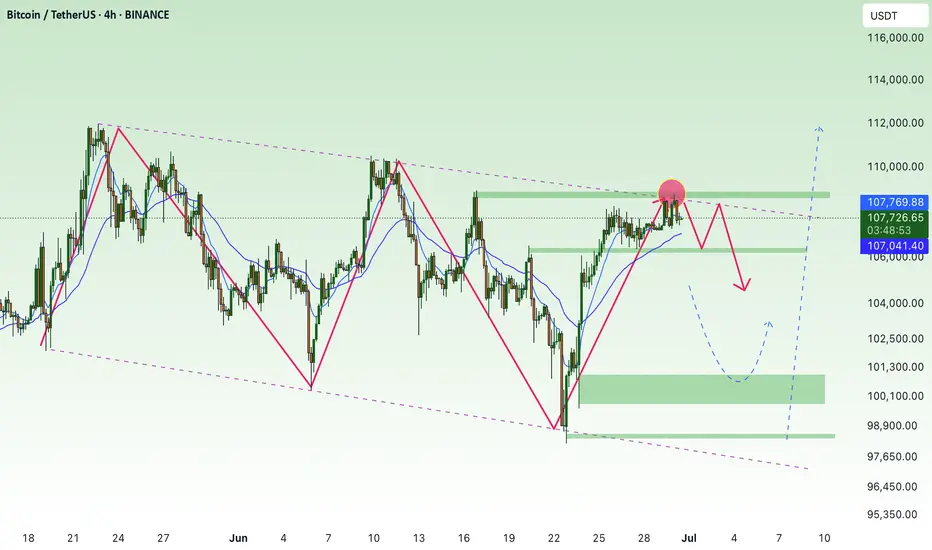
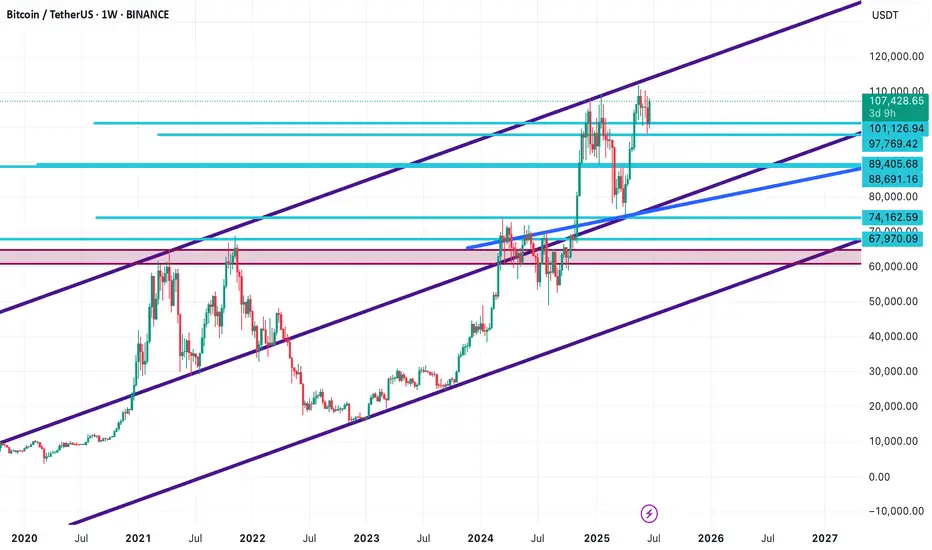
Bitcoin Technical Analysis | The Most Important Channel 📊 Bitcoin Technical Analysis | The Most Important Channel You’ll Ever See!
This might be the most critical BTC chart you come across. I've mapped out the key ascending channel that has defined Bitcoin’s long-term trend over the past few years. The upper boundary, lower boundary, and especially the midline have repeatedly acted as dynamic support and resistance levels.
Right now, BTC is trading near the channel top, with strong bullish momentum. While the buying pressure remains high and a breakout is possible, watch out for potential rejections or fakeouts around this area.
All major support and resistance levels are clearly marked in this chart. Make sure to draw this channel on your own chart and use it as a powerful tool in your trading decisions.
🧠 Follow for more high-probability setups, smart technical insights, and real-time updates!
$BTCUSDT: Bullish trend resumingBitcoin turning bullish in the daily confirming the correction is likely over and longer term timeframe trends will resume next if it gets follow through.
See monthly, it fired a trend on close during June, bullish till EOY easily as per this forecast:
Best of luck!
Cheers,
Ivan Labrie.
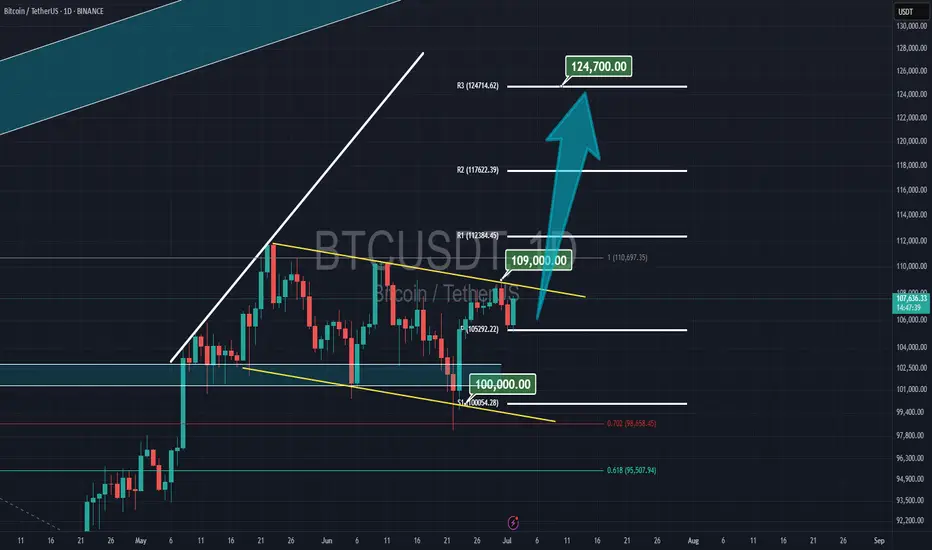
Bitcoin STANDING..bitcoin now is standing on monthly pivot and hold that as the support.
3rd pivot's resistance is at 124k is reachable in few weeks.
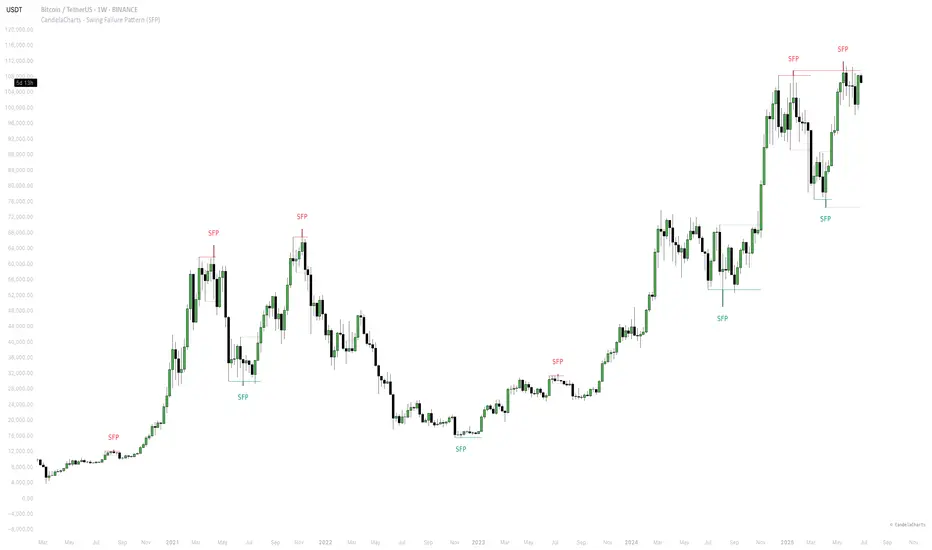
Understanding SFP In Trading1. What is a Swing Failure Pattern (SFP)?
A Swing Failure Pattern (SFP) occurs when the price temporarily breaks a key swing high or low but fails to continue in that direction, leading to a sharp reversal.
This pattern is often driven by liquidity grabs, where price manipulates traders into taking positions before reversing against them.
An SFP typically consists of:
A false breakout beyond a previous swing high/low.
A sharp rejection back within the prior range.
A liquidity grab, triggering stop-loss orders and fueling a reversal.
SFPs provide powerful trade opportunities, signaling potential reversals and the exhaustion of trends.
2. Understanding Liquidity Grabs & Stop Hunts
The financial markets are structured around liquidity. Large institutions and algorithmic traders require liquidity to execute their large orders efficiently.
One way they achieve this is by triggering liquidity grabs and stop hunts.
Liquidity Grab:
Occurs when price moves beyond a key level (e.g., swing high/low), activating orders from breakout traders and stop-losses of trapped traders.
Smart money absorbs this liquidity before pushing the price in the opposite direction.
Stop Hunt:
A deliberate price movement designed to trigger stop-loss orders of retail traders before reversing.
Often seen near major support and resistance levels.
These events are crucial for understanding SFPs because they explain why false breakouts occur before significant reversals.
3. Why Smart Money Uses SFPs
Institutions, market makers, and algorithmic traders use SFPs to:
Fill large orders: By grabbing liquidity at key levels, they ensure they can enter large positions without causing excessive price slippage.
Manipulate retail traders: Many retail traders place stop-losses at obvious swing points. Smart money exploits this by pushing the price beyond these levels before reversing.
Create optimal trade entries: SFPs often align with high-probability reversal zones, allowing smart money to enter positions at better prices.
Understanding how institutions operate gives traders an edge in identifying manipulative moves before major price reversals.
4. Market Structure & SFPs
Market structure is built upon a series of swing highs and swing lows. Identifying these key points is crucial because they represent areas where liquidity accumulates and where price is likely to react.
Swing High (SH): A peak where price makes a temporary high before reversing downward.
Swing Low (SL): A trough where price makes a temporary low before reversing upward.
Types of Swing Points in Market Structure
Higher Highs (HH) & Higher Lows (HL) – Bullish Trend
Lower Highs (LH) & Lower Lows (LL) – Bearish Trend
Equal Highs & Equal Lows – Range-Bound Market
5. Liquidity Pools: Where Traders Get Trapped
Liquidity pools refer to areas where traders' stop-loss orders, pending orders, and breakout entries accumulate. Smart money uses these liquidity zones to execute large orders.
Common Liquidity Pool Zones:
Above swing highs: Retail traders place breakout buy orders and stop-losses here.
Below swing lows: Stop-losses of long positions and breakout sell orders accumulate.
Trendline & Range Liquidity:
Multiple touches of a trendline encourage traders to enter positions based on trendline support/resistance.
Smart money may engineer a fake breakout before reversing price.
6. Identifying Bullish SFPs
SFPs can occur in both bullish and bearish market conditions. The key is to identify when a liquidity grab has occurred and whether the rejection is strong enough to confirm a reversal.
Bullish SFP (Swing Low Failure in a Downtrend)
Price sweeps a key low, triggering stop-losses of long traders.
A strong rejection wick forms, pushing price back above the previous low.
A shift in order flow (bullish market structure) confirms a potential reversal.
Traders look for bullish confirmation, such as a higher low forming after the SFP.
Best bullish SFP setups occur:
At strong support levels
Below previous swing lows with high liquidity
After a liquidity grab with momentum confirmation
7. Identifying Bearish SFPs
Bearish SFP (Swing High Failure in an Uptrend)
Price takes out a key high, triggering stop-losses of short traders.
A sharp rejection forms, pushing the price back below the previous high.
A bearish shift in order flow confirms downside continuation.
Traders look for bearish confirmation, such as a lower high forming after the SFP.
Best bearish SFP setups occur:
At strong resistance levels
Above previous swing highs where liquidity is concentrated
With clear rejection wicks and momentum shift
8. How SFPs Signal Reversals
SFPs provide early warning signs of trend reversals because they expose areas where liquidity has been exhausted.
Once liquidity is taken and the price fails to continue in that direction, it often results in a strong reversal.
Key Signs of a Strong SFP Reversal
Long wick rejection (indicating absorption of liquidity).
Close back inside the previous range (invalidating the breakout).
Increased volume on the rejection candle (confirming institutional activity).
Break of short-term market structure (trend shifting).
Divergences with indicators (e.g., RSI divergence at the SFP).
9. Identifying High-Probability SFPs
One of the most critical aspects of a valid SFP is how the price reacts after a liquidity grab. The candle’s wick and close determine whether an SFP is strong or weak.
A. Wick Rejections & Candle Closes
Key Features of a Strong SFP Wick Rejection
Long wick beyond a key swing high/low (indicating a liquidity grab).
Candle closes back inside the previous range (invalidating the breakout).
Engulfing or pin bar-like structure (showing aggressive rejection).
Minimal body size relative to wick length (e.g., wick is 2–3x the body).
Bullish SFP (Swing Low Failure)
Price sweeps below a key low, triggering stop-losses of buyers.
A long wick forms below the low, but the candle closes back above the level.
This signals that smart money absorbed liquidity and rejected lower prices.
Best bullish SFPs occur at major support zones, previous swing lows, or untested demand areas.
Bearish SFP (Swing High Failure)
Price sweeps above a key high, triggering stop-losses of short sellers.
A long wick forms above the high, but the candle closes back inside the range.
This signals that smart money absorbed liquidity and rejected higher prices.
Best bearish SFPs occur at resistance levels, previous swing highs, or untested supply areas.
❌ Weak SFPs (Avoid These)
❌ Wick is too small, meaning the liquidity grab wasn’t significant.
❌ Candle closes above the swing high (for a bearish SFP) or below the swing low (for a bullish SFP).
❌ Lack of strong momentum after rejection.
B. Volume Confirmation in SFPs
Volume plays a crucial role in validating an SFP. Institutional traders execute large orders during liquidity grabs, which often results in spikes in trading volume.
How to Use Volume for SFP Confirmation
High volume on the rejection wick → Indicates smart money absorption.
Low volume on the breakout move → Suggests a lack of real buying/selling pressure.
Increasing volume after rejection → Confirms a strong reversal.
Spotting Fake SFPs Using Volume
If volume is high on the breakout but low on the rejection wick, the move may continue trending rather than reversing.
If volume remains low overall, it suggests weak market participation and a higher chance of chop or consolidation instead of a clean reversal.
Best tools for volume analysis:
Volume Profile (VPVR)
Relative Volume (RVOL)
Footprint Charts
10. Key Takeaways
SFPs are Liquidity Grabs – Price temporarily breaks a key high/low, triggers stop losses, and then reverses, signaling smart money absorption.
Wick Rejection & Close Matter – A strong SFP has a long wick beyond a swing point but closes back inside the range, invalidating the breakout.
Volume Confirms Validity – High volume on rejection wicks indicates smart money involvement, while low-volume breakouts often fail.
Higher Timeframes = Stronger SFPs – 1H, 4H, and Daily SFPs are more reliable than lower timeframe setups, reducing false signals.
Confluence Increases Probability – SFPs are most effective when aligned with order blocks, imbalances (FVGs), and major liquidity zones.
Optimal Entry Methods Vary – Aggressive entries capitalize on immediate rejection, while confirmation and retracement entries improve accuracy.
Proper Stop Loss Placement Prevents Fakeouts – Placing SL just beyond the rejection wick or using structure-based stops reduces premature exits.
Take Profit at Key Liquidity Levels – Secure profits at previous swing highs/lows, order blocks, or imbalance zones to maximize returns.
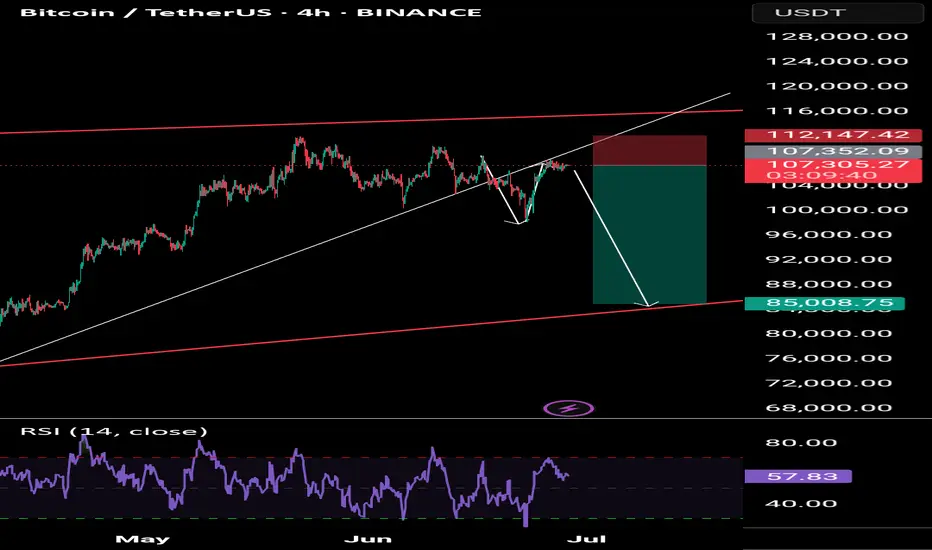
Bitcoin ready to move towards 85,000Be prepared to fall after breaking the trend line and back to the target of 85,000.
Bitcoin ready to move towards 85,000🤪🤪🤪🤪🤪
Bitcoin Recovers...What we've learned in the past few years is that Bitcoin's demand is just too strong. Retraces and corrections are no longer wild like before, these are limited and capped. Nobody wants to take the risk of selling too much and being left out or losing their Bitcoins for good, they are just too valuable. Many times more valuable than the USD Dollar or Gold. It is the most valuable asset in the whole digital world.
Other than food and toilet paper, nothing is more valuable than Bitcoin.
Technical analysis
Ok, let's focus on the chart.
The retrace has been ongoing for 31 days, since 22-May.
Total drop amounts to 12.33% (-12%).
The action moved below the 5-June low around $100,400. Bitcoin is now back above this level. Clearly showing that this is a stop-loss hunt event.
Stop-loss hunt and liquidity hunt because thousands, if not millions, of over-leveraged traders have been liquidated. They were betting on the wrong side short-term. Long-term yes, bullish is the trend, the direction and the win. Short-term, it was SHORT but not anymore.
Never trade with 20X that's crazy. Imagine going LONG 20X at the all-time high? Isn't that stupid?
I can bet you the same people didn't want to buy LONG when Bitcoin was trading at $75,000. In fact, I can bet that these people that just got liquidated were selling below $80,000 and buying LONG with 20X at $110,000. A recipe for disaster.
Anyway, I am calling it early. This is it, we are going up.
I got my signals, as you already know, from the altcoins.
If you agree boost and follow.
Thanks a lot for your continued support.
Namaste.
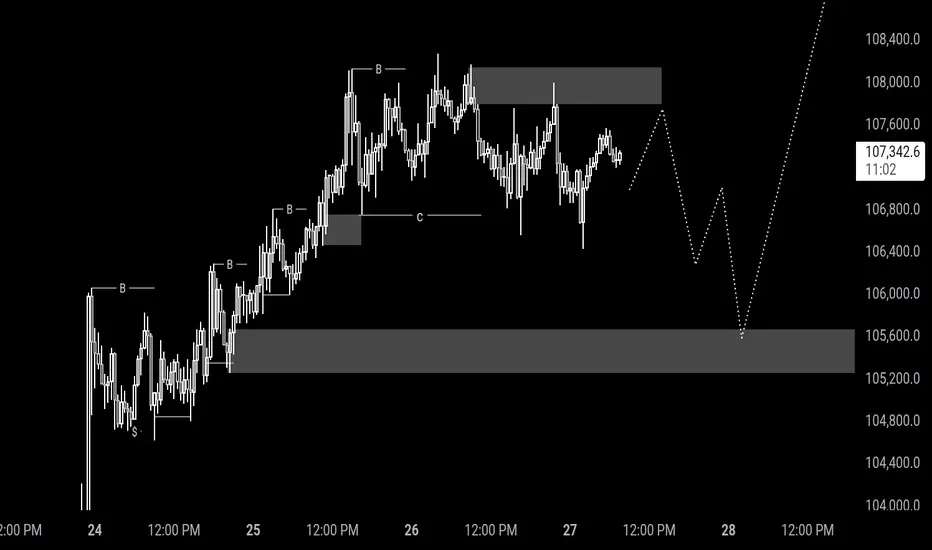
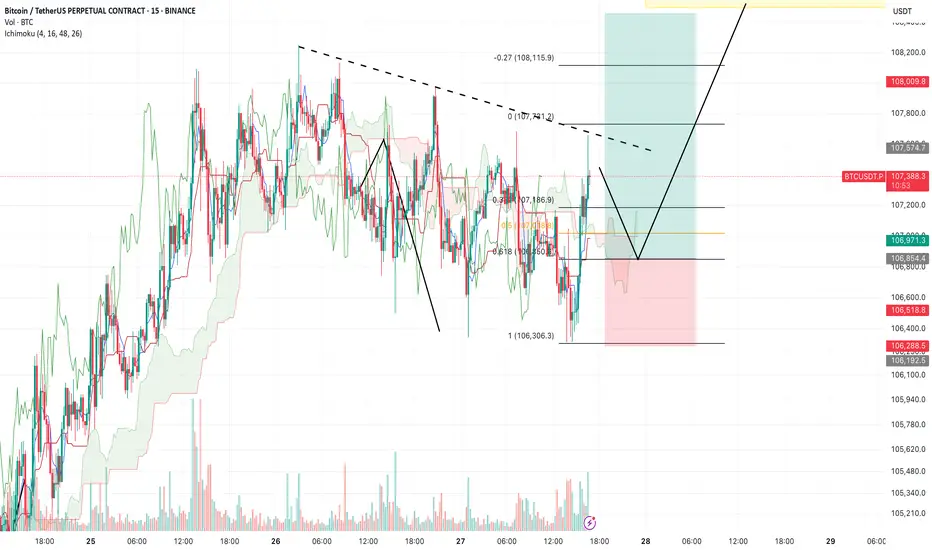
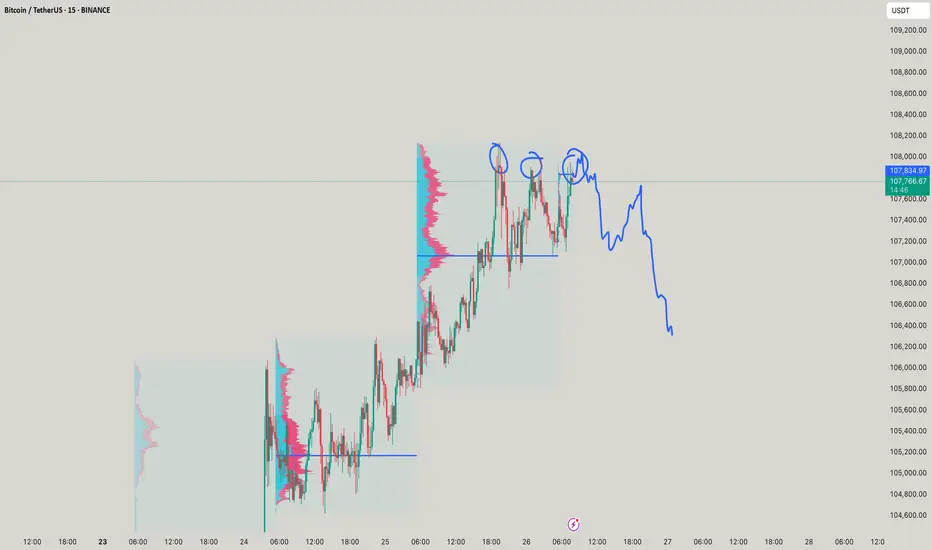
BTC/USDT.P – Intraday Plan (15m, Ichimoku) by RiscoraPrevious idea played out. The last candle showed strong volume and a wick to the upside, signaling some liquidity has been taken.
From here, I expect either a minor high above that wick or a correction down to the 0.618 area, then continuation of the bullish move towards the yellow liquidity block.
If price breaks below recent lows, the 106,300 level has proven itself as solid support—buyers have stepped in there twice with strong volume, so I’m not expecting it to give way easily.
Overall, I anticipate another push up to collect liquidity above and will reassess once price reaches the upper range.
Watching price action closely for confirmation.
#BTC #Crypto #Trading #Ichimoku #Riscora
btc my weekly analysis for the btc move insha allah btc shows as big opportunity dirrection toward sell or bear position at the price of 99k
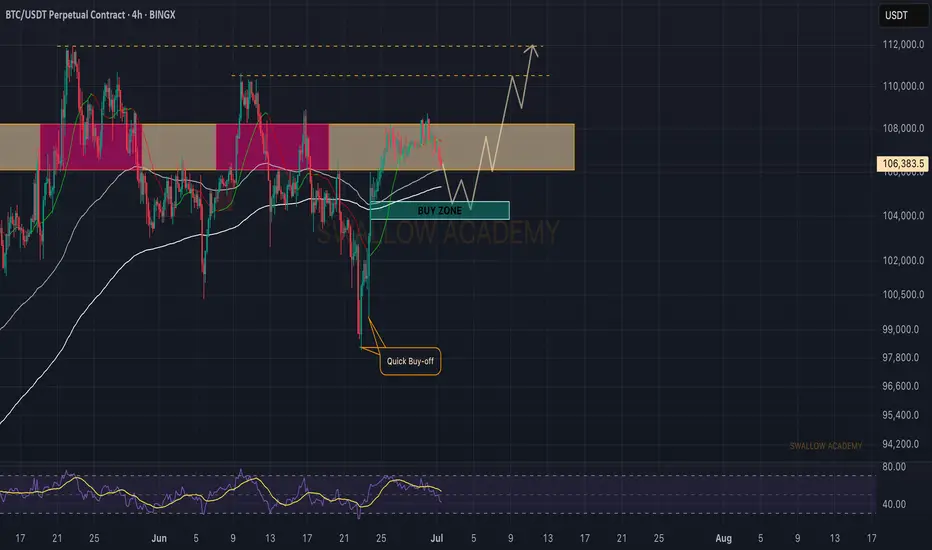
Today's BTC trading strategy, I hope it will be helpful to you Four Bullish Drivers Behind Bitcoin's Rally
(1) Institutional Capital Rampage: From Whale Holdings to Market Scarcity
- **BlackRock et al. as anchor investors**: BlackRock's Bitcoin ETF (IBIT) has ballooned to $71.9 billion, holding 660,000 BTC—equivalent to 3.1% of total circulating supply. Such "whale-level" positions not only provide liquidity support but also shatter traditional financial institutions' attitude toward crypto.
- **Accelerating OTC concentration**: OTC platform data shows Bitcoin inventory plunged from 166,500 coins at the start of the year to 137,400 coins, a 17.5% drop. This signals massive coins are shifting from exchanges to institutional custody, creating a "scarcity effect" analogous to apple prices surging due to supply shortages.
(2) Fed Rate Cut Expectations Ignite Hot Money Inflows
- **Policy pivot-driven capital reallocation**: After Fed Governor Bowman signaled a possible July rate cut, CME futures now price in two 2025 rate cuts (up from one). Historical parallels: Bitcoin surged 42% in 6 months post-Fed's first 2019 rate cut (S&P 500 +12%), as low rates enhance Bitcoin's appeal as a "non-sovereign asset".
- **Diminishing opportunity costs**: A potential Fed rate cut would lower real yields (nominal rate - inflation). If 10-year Treasury real yields fall from 2.3% to 1.5%, the opportunity cost of holding gold/Bitcoin declines, pushing funds from bonds into risk assets.
(3) Regulatory Gate Opening: Chinese Brokerage Breaks New Ground
- **Guotai Junan International's milestone**: On June 24, Hong Kong's SFC approved its virtual asset trading services, making it the first Chinese-funded brokerage to gain such. This opens a "compliant channel" for mainland capital—post-announcement, its HK shares surged 101%, while OTC Bitcoin inventory dropped by 3,000 coins, indicating institutions are front-running liquidity inflows.
- **Financial infrastructure upgrade**: The service allows clients to trade BTC via traditional securities accounts, lowering entry barriers. Analogous to Chinese brokerages accessing gold ETFs in 2013, such channels typically trigger explosive incremental flows, expected to attract $1-2 billion from family offices initially.
(4) Technical "Golden Cross" Confirms Long-Term Trend
- **Key moving average resonance**: BTC recently completed a 50-day MA (102,300 USD) cross above 200-day MA (94,700 USD), forming a "golden cross". Backtesting 2019 and 2020 instances, this pattern preceded 58% average 6-month gains, though short-term pullbacks (10-15%) are common (e.g., June 2023 post-cross correction).
- **Strong support forming a safety net**: The 200-day MA now acts as dynamic support—pullbacks to ~95,000 USD would represent a "secondary buying opportunity at institutional cost bases", similar to housing prices finding support when breaking below moving averages.
Today's BTC trading strategy, I hope it will be helpful to you
BTCUSDT BUY@106000~107000
SL:105000
TP:108000~109000
BTCUSDT:Sharing of the Latest Trading StrategyAll the trading signals last week have resulted in profits!!! Check it!!!👉👉👉
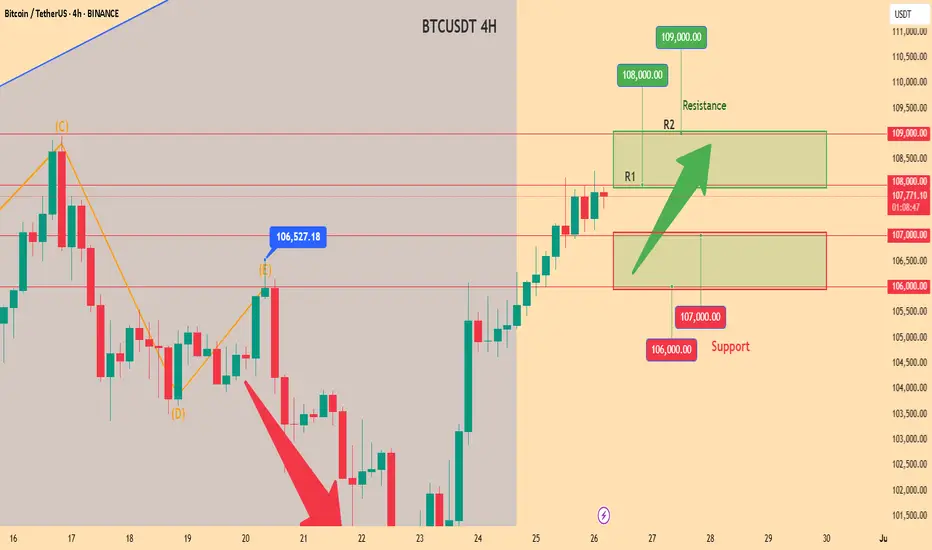
Bitcoin Technical Analysis (4-Hour Chart):
Price remains within an ascending channel. The MACD above the zero line with expanding red histograms indicates bullish dominance. After firmly breaking above the key resistance at $105,000, price is testing $110,000.
Caution: The RSI near 70 has entered overbought territory, increasing short-term pullback risks.
Support levels: $106,000 and $105,000.
Trading Recommendation for Aggressive Traders
Consider light long positions near $106,000 on pullbacks, with stop-loss set below $105,000.
Trading Strategy:
buy@105000-106000
TP:108000-110000
BTC - LONG SET-UPBINANCE:BTCUSDT
Bitcoin is currently testing its critical resistance level
If the price gets rejected here, the key support to watch is the $𝟏𝟎𝟏,𝟐𝟎𝟎 - $𝟏𝟎𝟐,𝟖𝟎𝟎 zone. This area represents a strong demand level where a potential buying opportunity could emerge.
For a trade setup based on this support, a strategic Stop Loss (SL) should be placed below the $𝟗𝟖,𝟎𝟎𝟎 mark to manage risk.
For now, patience is crucial. Keep a close eye on the price action
BTC - 103.5 - 102k when?OKay so the move as marked did move but is choppy, owing to the new pattern, lets see if triple tops are made and is done in a manner where it falls, LIQ shows at 108,800, BTC genuinely looks very very tired!
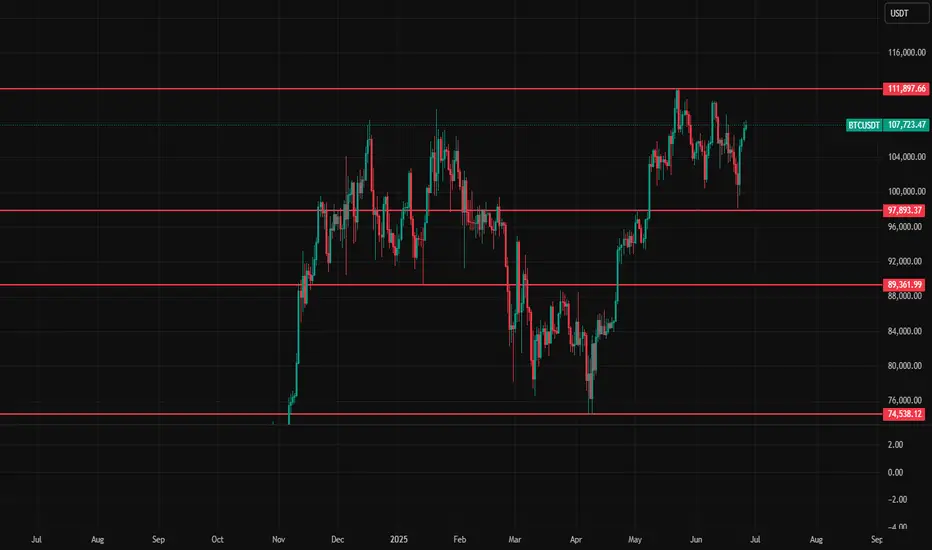
BTC Key levelsBTC key levels are below
These are very important levels for reversals and breakouts.
111, 898
97,893
89,362
74, 538
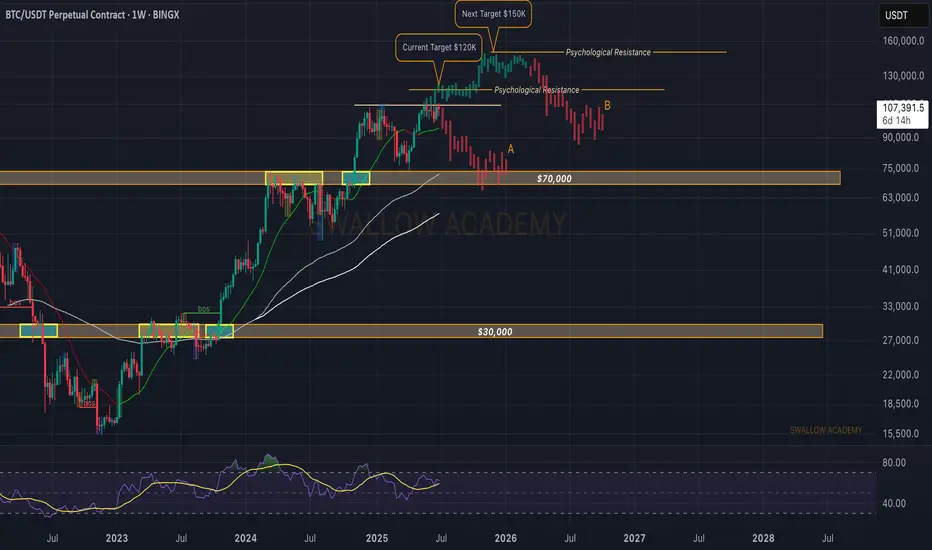
Bitcoin (BTC): Still Hovering Near ATH | Seems WeakeningBitcoin is still hovering near the local ATH area, where sellers and buyers are fighting over the zone there.
There is nothing clear yet so we keep on monitoring, but we are seeing smaller signs of weakness, which indicate upcoming volatile movement as we are approaching the end of the month.
Now we will keep an eye on how sharp the monthly opening will be and based on that, we will trade. Our attentions are still at $120K for now.
Swallow Academy
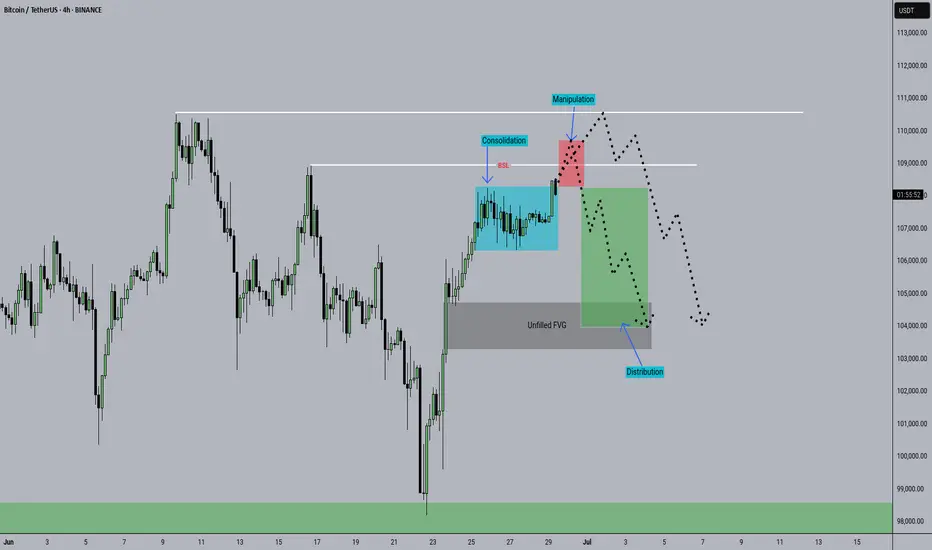
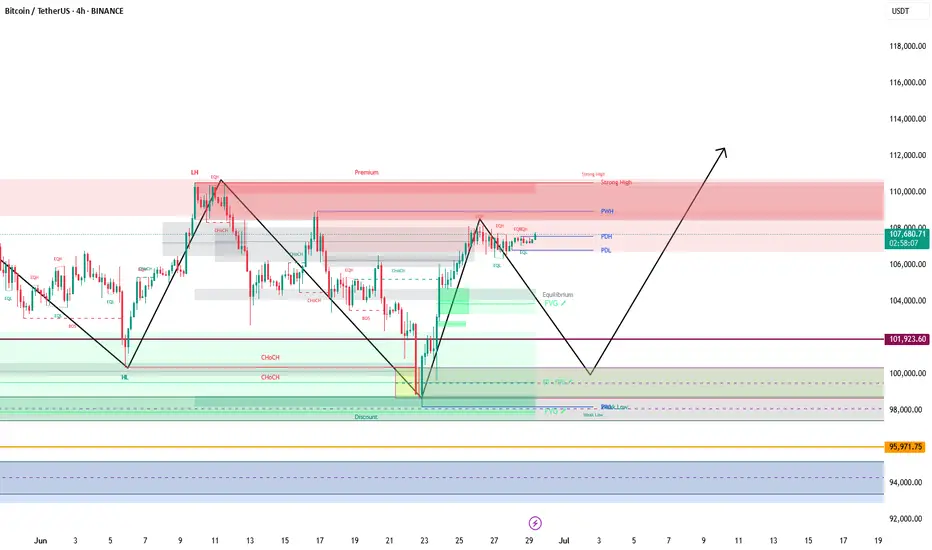
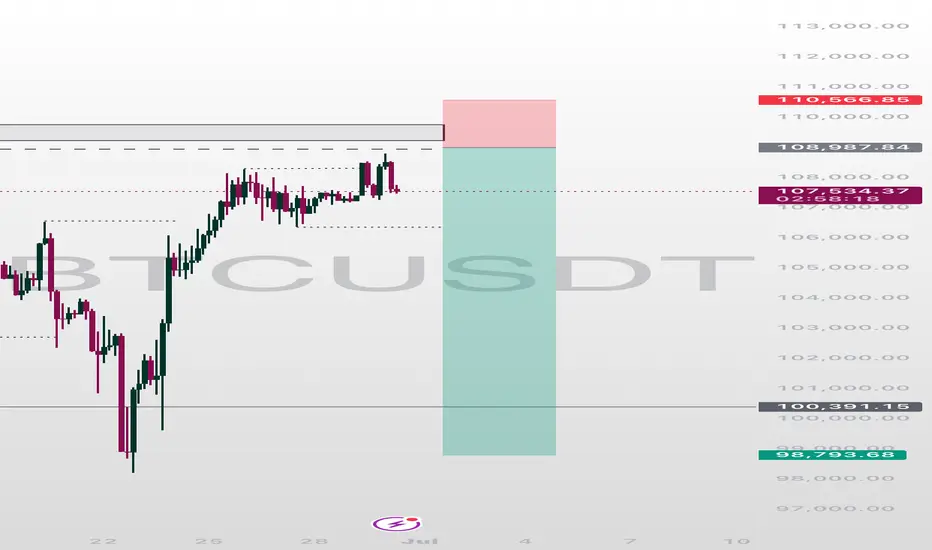
BTCUSDT in a sell zone Let's keep it simple.
The IOF is bearish on the H4 timeframe.
Price has retraced to a premium zone.
Technically, once we see a lower timeframe confirmation from these zones, we take a sell.
While I'm eyeing the liquidity at 109050, any break below 106415 will usher us into a sell towards 99000.
Use your proper entry confirmation and risk management.
BTC may going low after ATH?Weekly Analysis:
- Market to go higher , as last week's weekly candle was very bullish
- May sweep Weekly Buyside Liquidity
- May move bearish towards the Weekly FVG
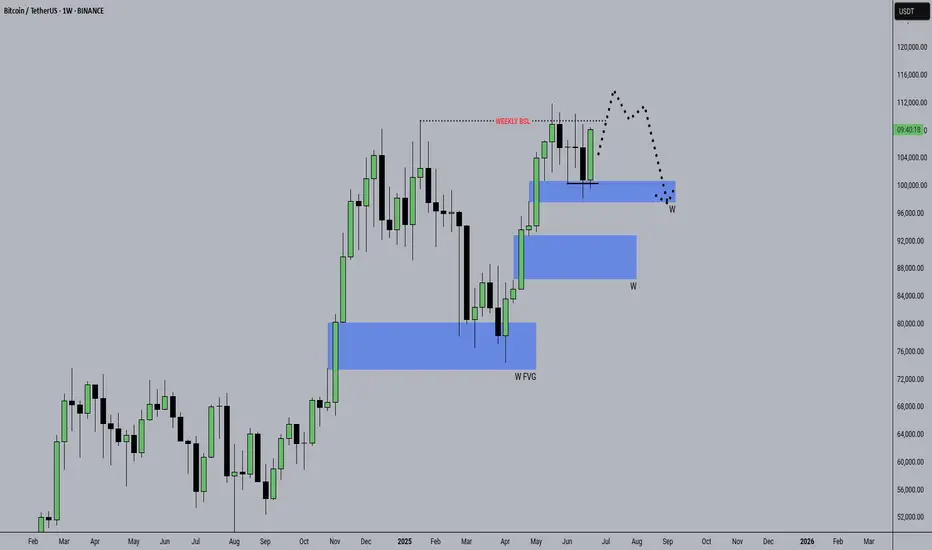
BTC to sweep liquidity?4 Hour Analysis:
- Market moving out consolidation phase (Accumulating late buyers)
- May sweep the 1st buyside liquidity (see chart)
- Or may sweep the ATH above the 1st buyside liquidity (see arrow on the right of the chart)