Trading the Impulse Rally Retracement — Price and Time Symmetry The Stop Loss Triangle is back!
This time with BITSTAMP:BTCUSD coming off its recent impulse rally. For those of you that aren’t familiar with my strategy — let me start from the beginning…
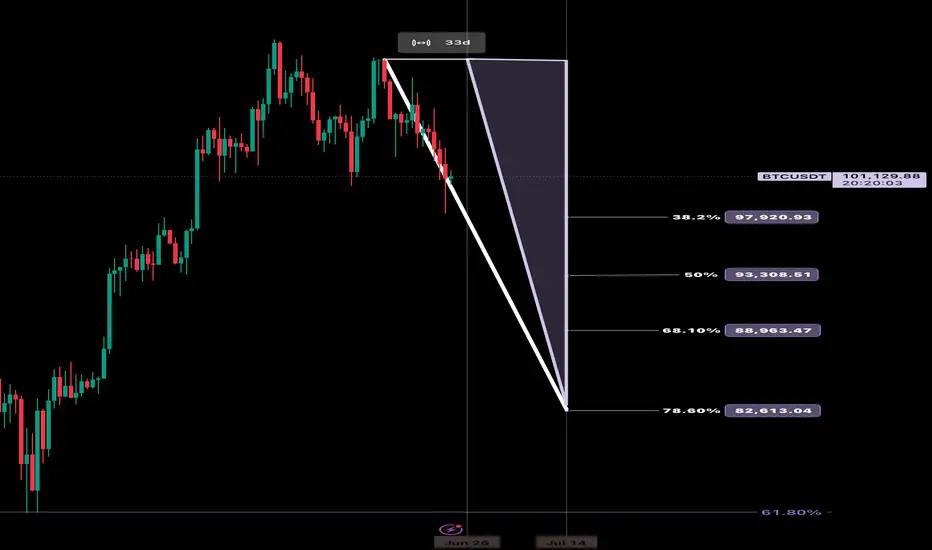
This concept involves positioning against the opposing decline in price and time as a precursor to our theoretical projection. If the underlying enters our predetermined faded cross-section, the stop loss is triggered to prevent sideways consolidation and the erosion of contract premiums or leverage decay.
This inherently ‘sclene’ triangle is constructed by drawing a straight trend line through the bottoming reversal candle and the furthest projection in price and time symmetry (78.6%) of the retracement. Once connected, draw a vertically positioned straight line from the highest or lowest point in the previously identified retracement to the bottom reversal candle area once again. To create a ‘right triangle’, now turn 90 degrees towards the final point, which is determined by the nearest projection in price and time symmetry (38.2%). This allows time after the imposed price and time date, yet not enough for premium or leverage decay to become significant.
In its entirety, this forms the stop loss triangle.
I encourage my followers to identify and explore the system on their own. As always, feel free to ask me anything related to it. We’ll follow along and you’ll be amazed at the precision of Fibonacci symmetry.
CHEERS
BTCUSDT.PS trade ideas
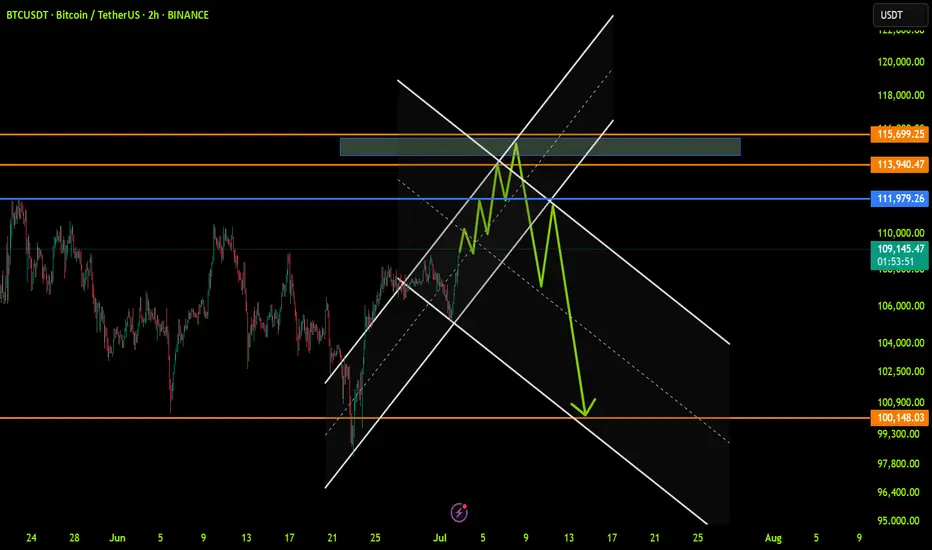
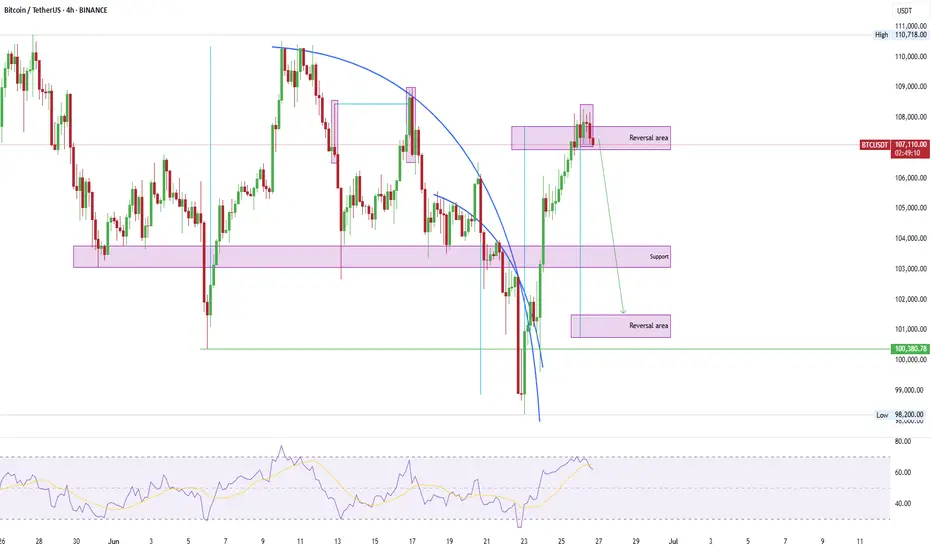
BTCUSDT: Trend in 2H time frameThe color levels are very accurate levels of support and resistance in different time frames.
A strong move requires a correction to major support and we have to wait for their reaction in these areas.
So, Please pay special attention to the very accurate trend, colored levels, and you must know that SETUP is very sensitive.
BEST,
MT
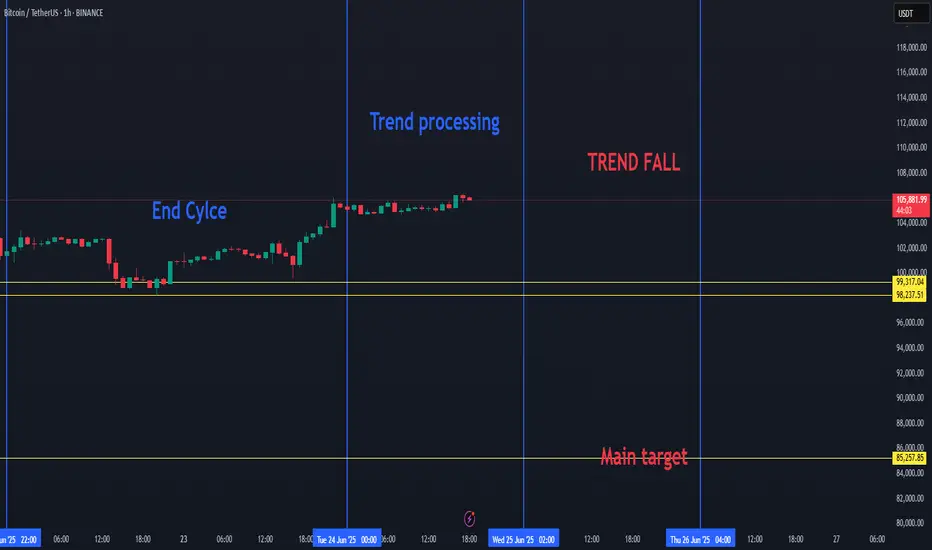
BTC HIGH DATA SHOW BREAKDOWN TO 85K FOR BITCOIN SOON.Bitcoin Market Update
BTC SEEMS TO ENTER A NEW CORRECTION PHASE SOON.
Recent data suggests that the current Bitcoin (BTC) cycle is coming to an end. As a result, we may soon see a downward move in BTC's price. The key target in this potential drop is around $85,000, with expectations that BTC will fall below $100,000.
This week, Bitcoin completed its cycle trend and is now entering a processing or transitional phase. Once this phase ends, we anticipate another decline in price.
This outlook is based on recurring patterns seen in previous BTC cycles, which have shown similar behavior in the past.
BTC can play on the low time frame with uptrends and downtrends, but if we will choice a side, then it will be the red trend.. since BTC cycle is ending.
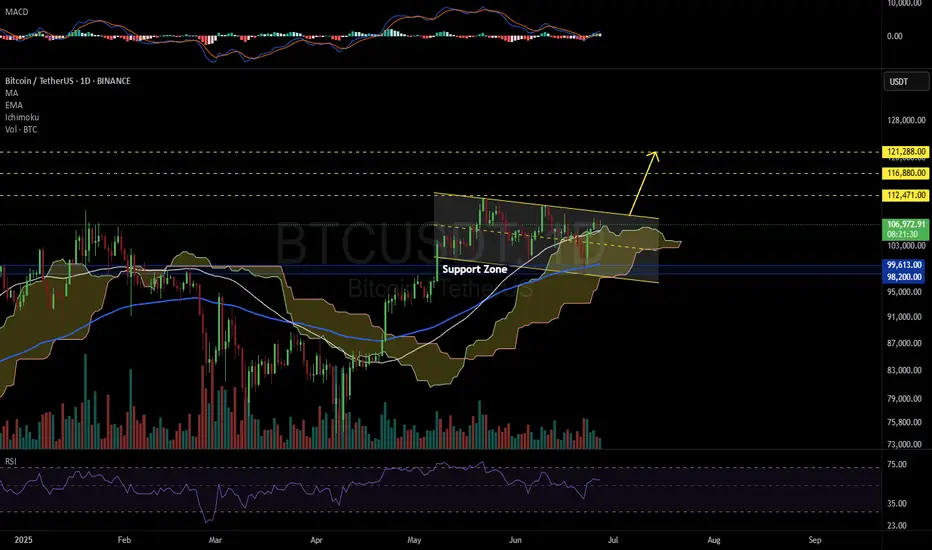
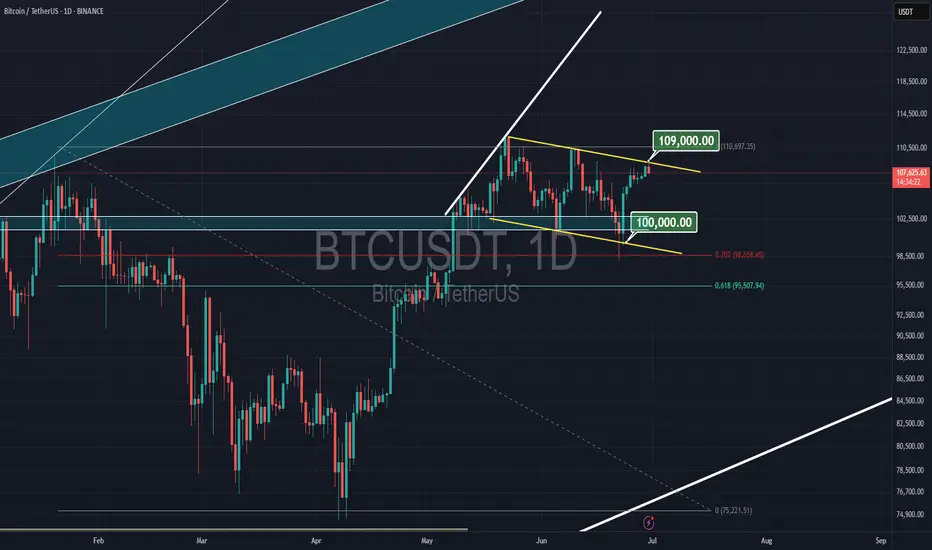
BTCUSDT 1D📈 #BTC Plan for July – Bullish Setup in Play
Bitcoin is forming a bull flag pattern on the daily chart — a classic setup that often leads to strong upward continuation when confirmed.
🔹 Key Indicators
• MACD is building positive momentum
• RSI is holding above 50
• Price is trading above the MA50 and the Ichimoku Cloud, indicating strong underlying support
📍 Strategy
We're buying here and will consider adding more near the key support zone:
$98,200 – $99,613
📈 Potential breakout targets (on confirmation):
🎯 $112,471
🎯 $116,880
🎯 $121,288
⚠️ Reminder
Always use a tight stop-loss and apply proper risk management.
Breakout confirmation with volume is crucial.
BTCUSDT at Best Resistance !!This is the Daily chart of Bitcoin .
BTCUSDT is trading near it Resistance Zone 108,600 - 107,400.
If this level is sustain , then we may see lower prices in BTCUSDT.
Thank You !!
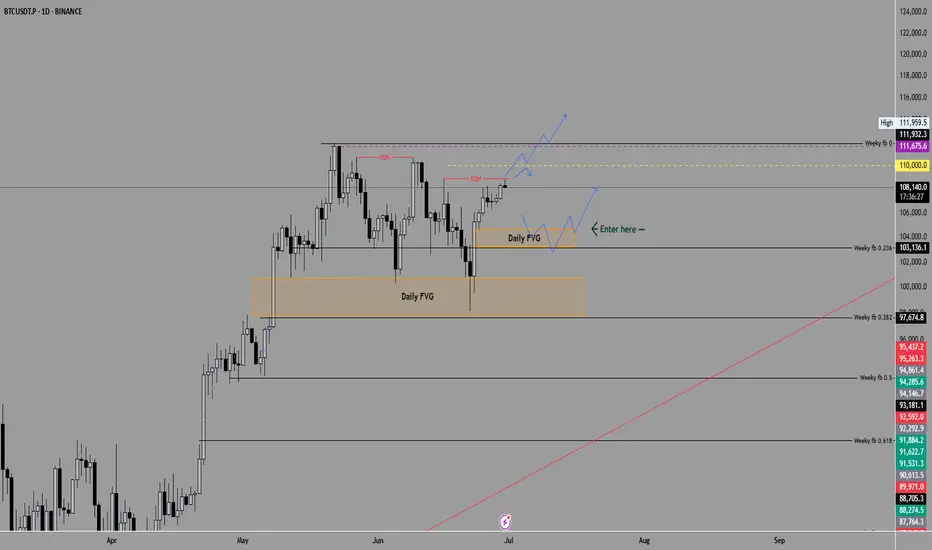
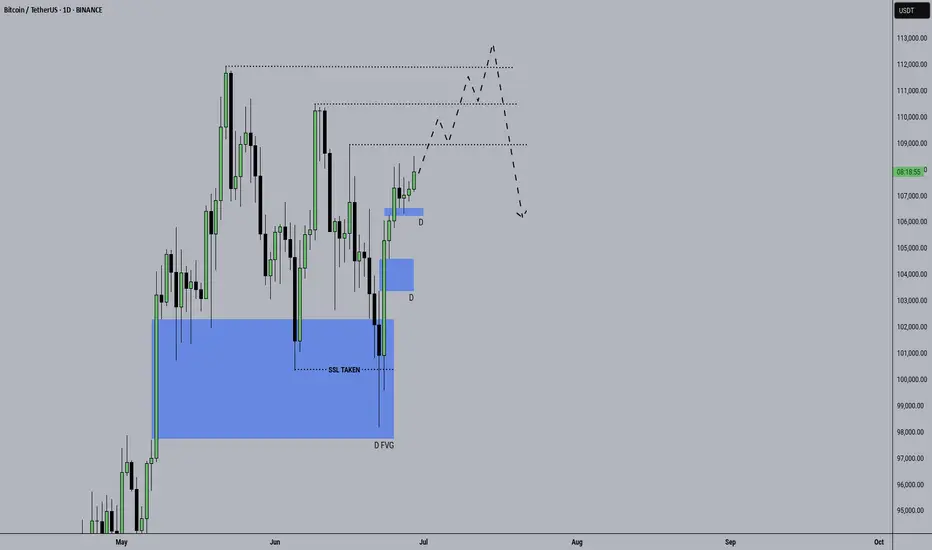
Let’s break down what the chart shows for BTCUSDT on the daily Chart key points
Price: Currently around $108,129
Key levels:
There are EQH (equal highs) around $111,500–$112,000 acting as liquidity.
There’s a smaller Daily FVG (Fair Value Gap) between ~$105,500–$107,000.
A larger Daily FVG lower around ~$99,000–$103,000.
Weekly Fibs mark retracement levels below.
Two projected paths: One a break above the EQH liquidity; the other shows a deeper pullback before that.
📈 Scenario 1: Bullish continuation + liquidity sweep
Idea:
BTC pushes up to sweep the EQH liquidity near $111,500–$112,000.
Breaks above, hits stops, and either:
Continues higher to the next resistance zone near $115,000–$118,000.
OR fakes out, sweeps liquidity, and retraces to the Daily FVG.
What to watch:
If price closes strongly above EQH with volume, look for continuation buys.
Confirmation: Break/retest of $111,500 as support.
📉 Scenario 2: Deeper pullback before continuation
Idea:
Price fails to break the EQH cleanly.
Pulls back into the small Daily FVG or deeper into the larger Daily FVG.
Reaccumulates around the $99,000–$104,000 zone.
From there, look for a bullish reaction for a safer long.
What to watch:
Weakness at EQH: Wicks or rejection candles.
Entry triggers: Strong bullish PA in the Daily FVG zones + confirmation.
✅ Key takeaways
Liquidity above EQH means there’s incentive for smart money to run stops.
FVGs are your high-probability reaction zones.
wait for price to trade into imbalance with signs of bullish order flow.
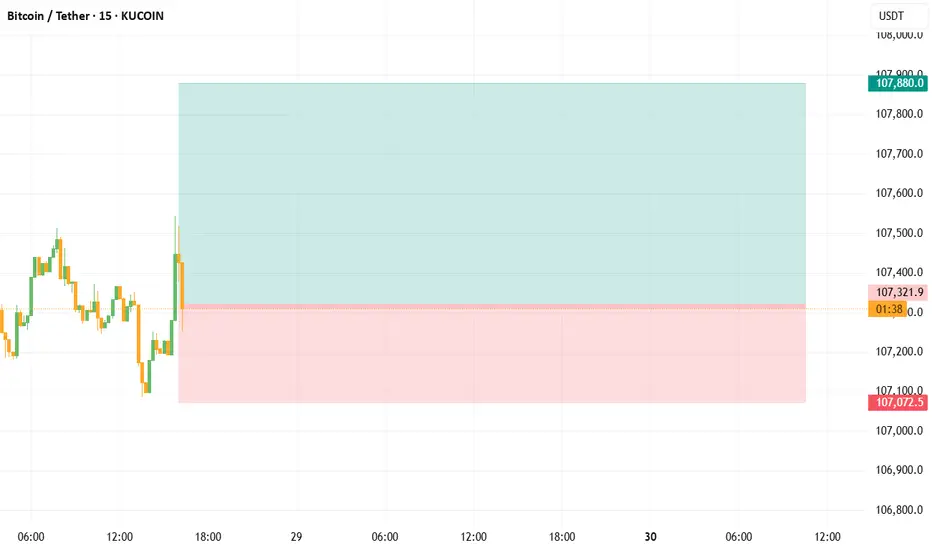
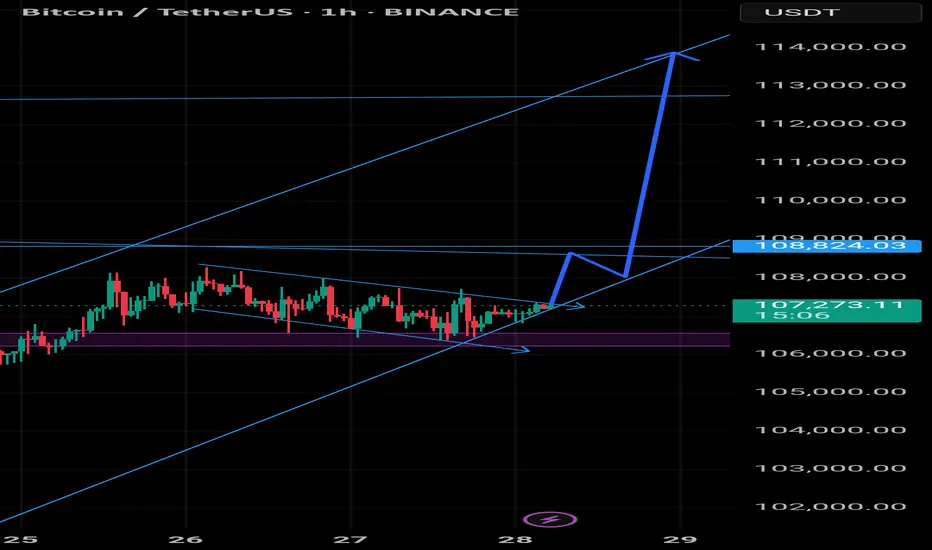
BTC/USDT high win scalping signals in 15 minutes are as follows- Signal: LONG
- Admission: 107,260 ~ 107,340
- Take Profit: 107,620, 107,880
Btcusd sell setup H4Hello! Friends,
Greetings. Please leave a Like if you like the idea.
Before start talking about technical Let's share your LOVE by giving me LIKES to support this work. Thanks in advance.
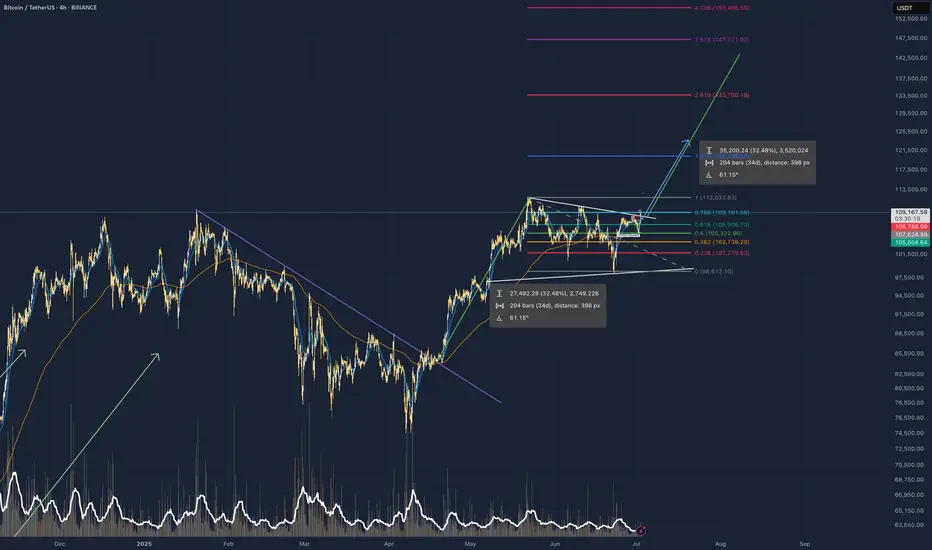
BTC Just Breakout! Are we ready for new ATH? BTC just breakout from 4h trendline and anticipate for any retracement soon before sky rocket into new ATH, historically saying my target will be on $148k.
NFA!!
DYOR!!
BTC to move upwards this week?Daily Outlook:
- market swept sellside liquidity
- price moved impulsively
- market moving higher reaching buyside liquidity
- may reach ATH and sweep to go lower
Btcusdt A break above the trend line could lead to a potential run up in BTC price but a break below the purple support could lead to a drastic drop in price
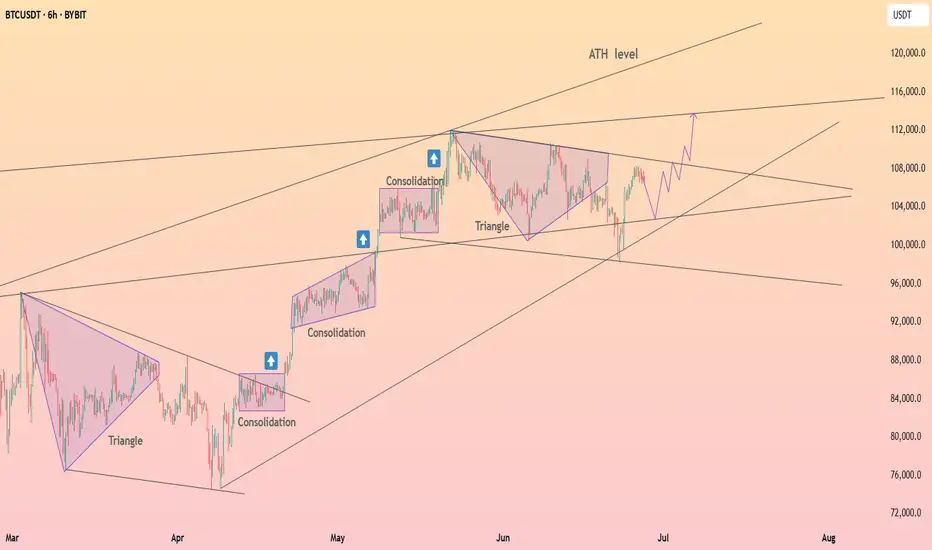
HolderStat┆BTCUSD aiming for 112kBINANCE:BTCUSDT is forming a bullish continuation structure after bouncing from the mid-range. With support holding and consolidation patterns completing, price action suggests a rally toward the 115,000 resistance line. Triangle and consolidation behavior confirms a strong uptrend continuation setup.
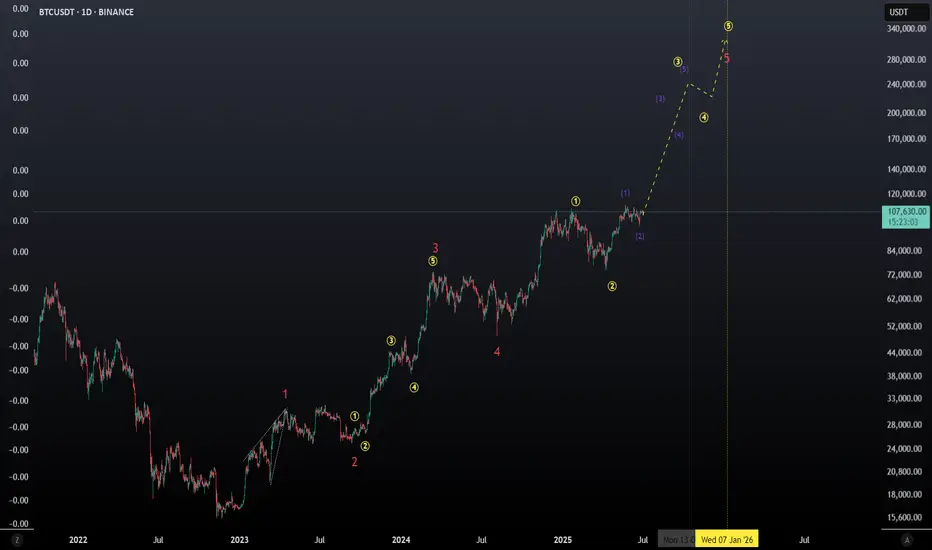
$BTC Outlook Macro These next few months are mega bullish.
Expecting a big move upwards + an altseason.
BTCUSDTBTC ,another complete analysis as posted for free early ,the weekly candle failed to break and close above 4hr supply roof at 108k and the next step is to watch the current 4hrs demand floor .A BREAK OF STRUTURE WILL BE EYEING 96-94K ,THE EMA+SMA STRATEGY ALIGNS WITH THE ASCENDING TREND LINE FOR A POTENTIAL BUY BACK WHERE WE HOPE TO CHALLENGE BROKEN 100K ZONE AS NEXT SUPPLY ROOF IF RESPECTED.
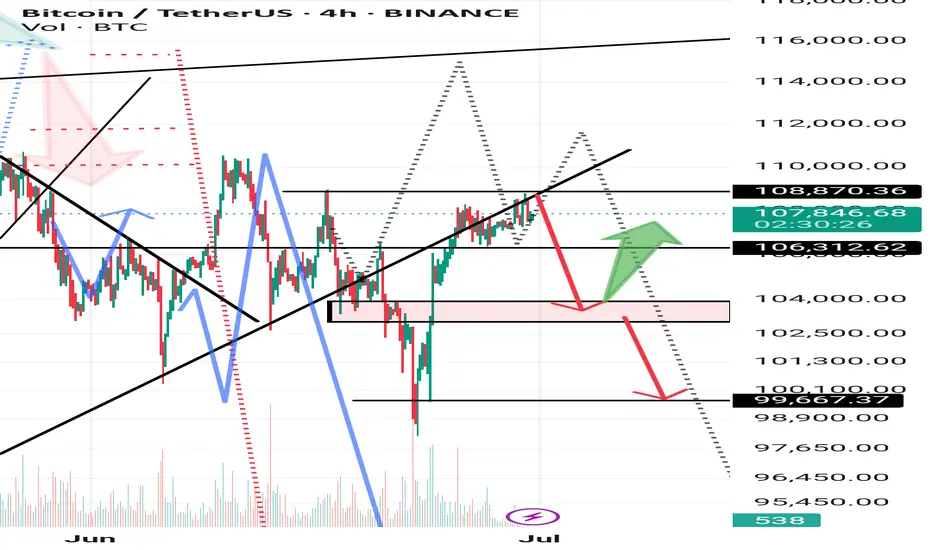
Analysis No. 73Welcome to King BTC 3. The price of Bitcoin is expected to decline from 108,800 to the 104,000 range. If it is supported in this range, it can start an upward move, but if the 104 range is lost, it will reach 101,000 to 100,000, and in the next stage, it will approach 99,600, and this is a possibility.
Btcusd sell setup H4Hello! Friends,
Greetings. Please leave a Like if you like the idea.
Before start talking about technical Let's share your LOVE by giving me LIKES to support this work. Thanks in advance.
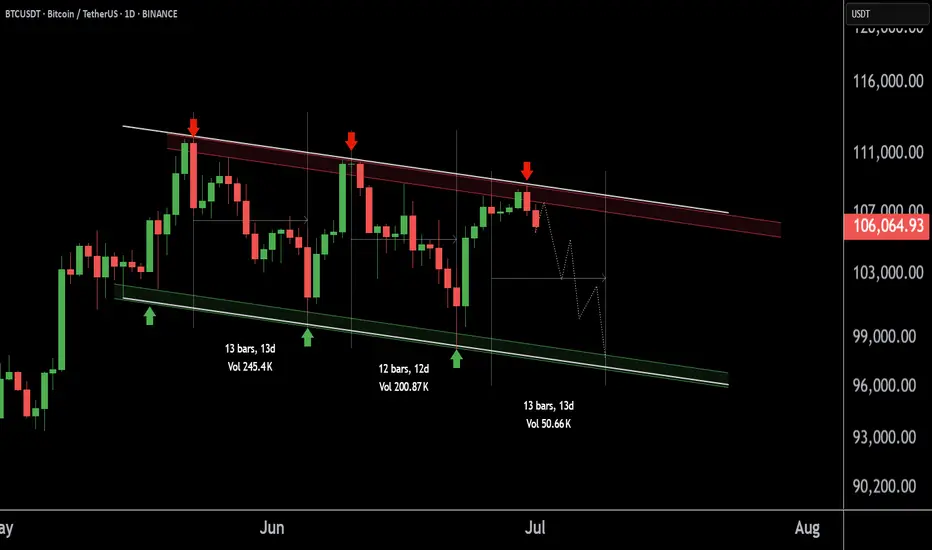
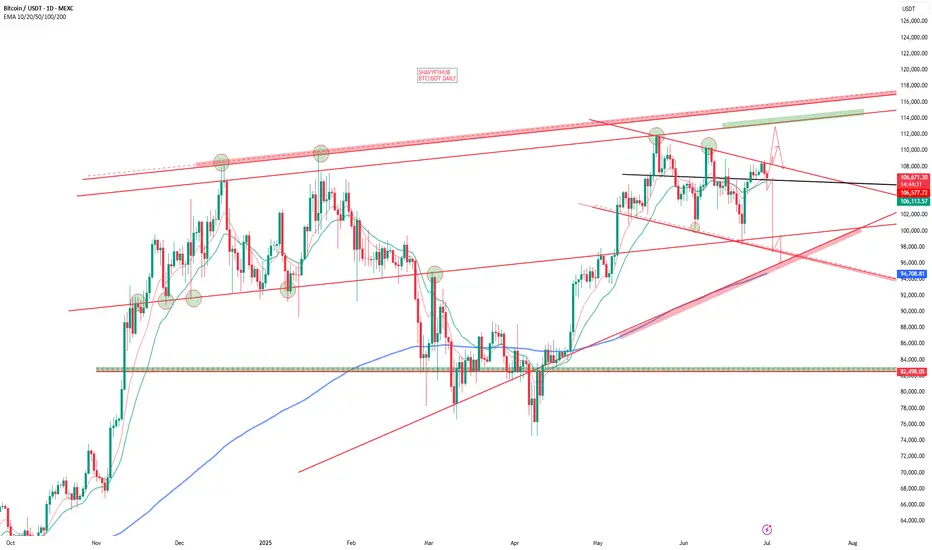
Why BTC hasn’t moved up recentlyBTC has been bobbing above and below this bearish triple crossover the past few months. What we see as consolidation is rather price getting stuck around these resistance levels.
The only reason why this would be occurring in my view, is due to the market makers having intention to allow this drop to play out.
The resistance is located at around 107,000 to 107,400 - watch this zone closely for a hold below / rejection and fast drop.
Scenario 1 marked with solid red line.
Scenario 2 marked with dotted red line.
Little update for y’all. Happy weekend trading.
Weekly trading plan for BitcoinLast week price action showed a local correction before reaching the first target. This week, we may see a deeper pullback before the next targets are hit and ATH is revisited. In this idea I marked the important levels for this week
Write a comment with your coins & hit the like button and I will make an analysis for you
The author's opinion may differ from yours,
Consider your risks.
Wish you successful trades ! mura

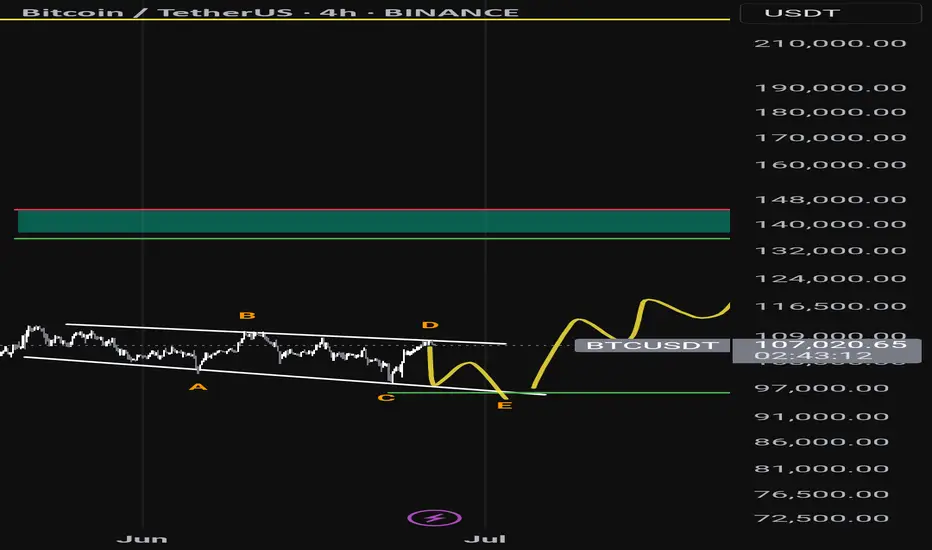
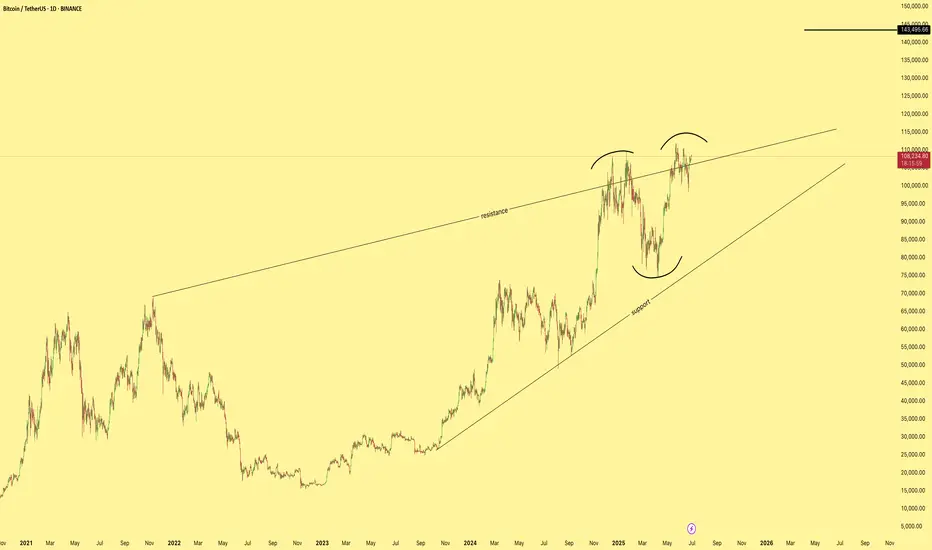
BTC/USDTSince last November, price action has been ranging above and below a rising wedge which is typically a bearish structure. This has created plenty of market indecision with bears poised to regain control at every dip.
However, the recent pullback didn’t reach the wedge’s support line which is a subtle bullish sign and we’ve now clearly formed an inverse head and shoulders, a classic bullish reversal pattern.
A breakout is on the table with a target at $143K.
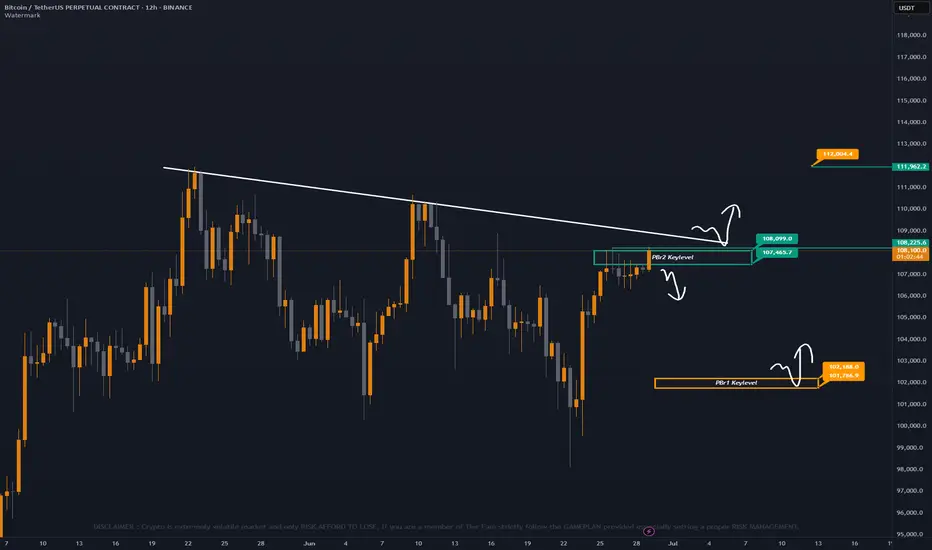
Bitcoin Update
Just to make it simple panda fam, Lets analyze it ! 💭
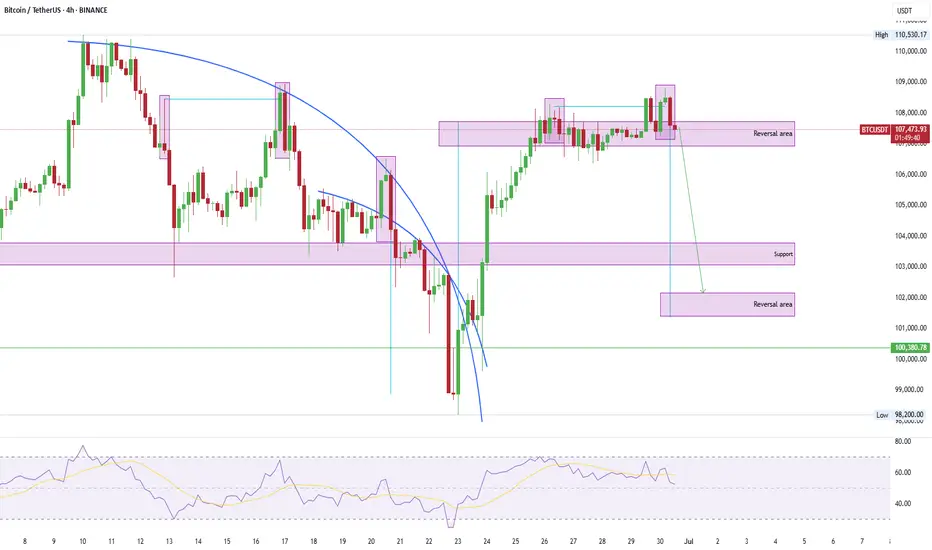
— Scenario #1 - PBr2 still possible we get rejected since we are on PBr2 keylevel resistance ranging 108099 - 107465, Same time we are under major trend resistance also. 📉
— Scenario #2 - PBr1 bounce support at 102188 - 101786 this will be valid if we get rejected at PBr2 and retest as normal correction movement. 🐂
— Scenario #3 - Breakout above major trend resistance, valid if we sit on trend major resistance as support . Short term possible target at 112004. 🚀
Always trade safe and stay updated to our updates panda fam ! Kupit kupit lang muna tayo sa altcoins. 🙌
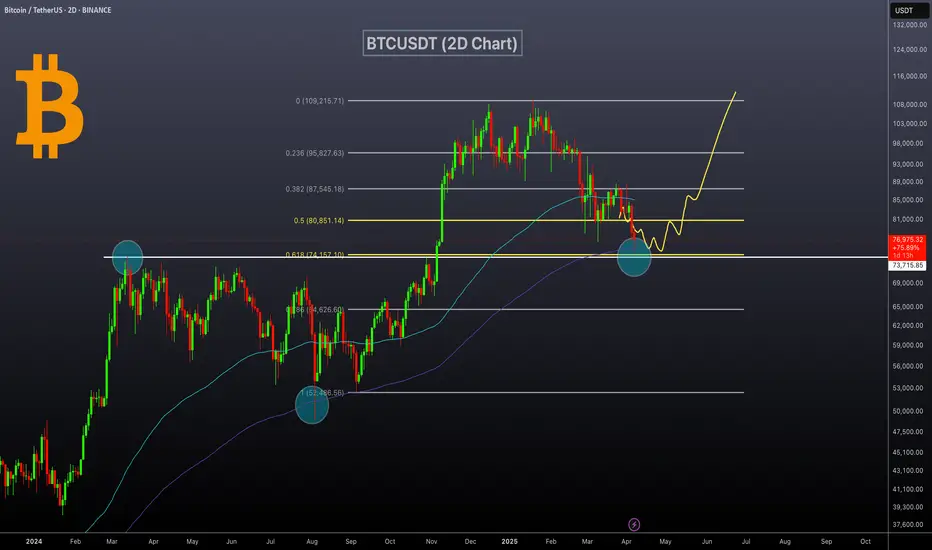
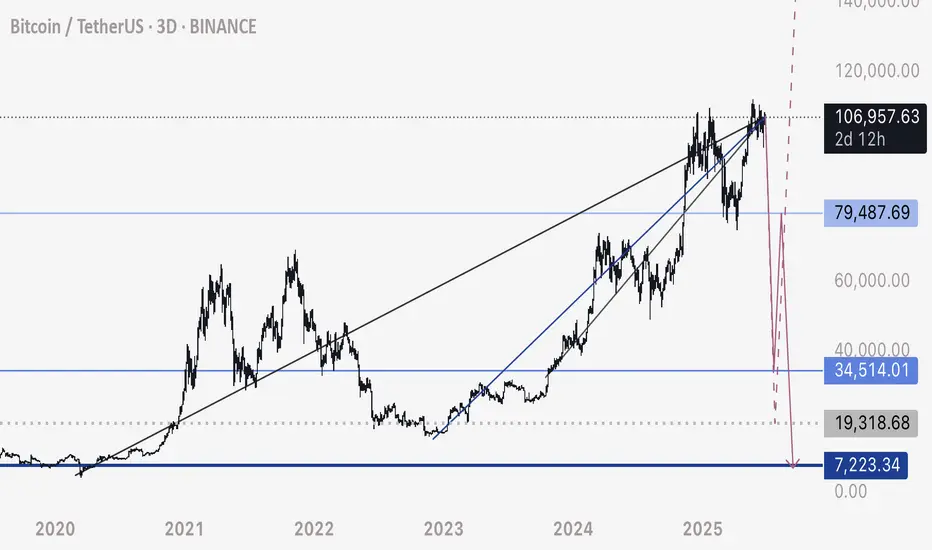
BTCUSDT: Bounce Incoming?BTCUSDT Technical analysis update
-March 2024 resistance is now expected to act as a strong support level.
-The price has touched the 0.618 Fibonacci retracement level, suggesting a potential reversal from this zone.
-The 200 EMA on the 2-day chart is positioned as a strong dynamic support, reinforcing the bullish case.
We can expect a bounce from the $72-75k level.