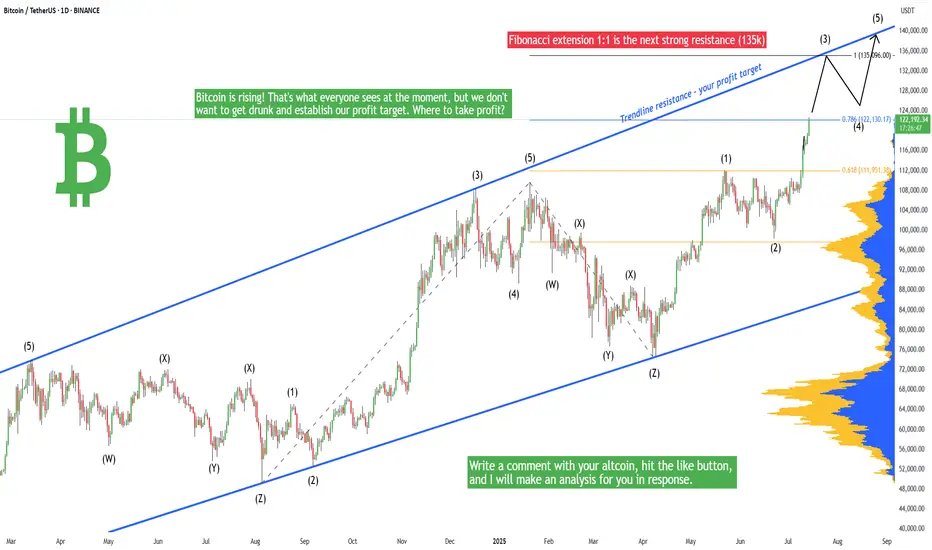
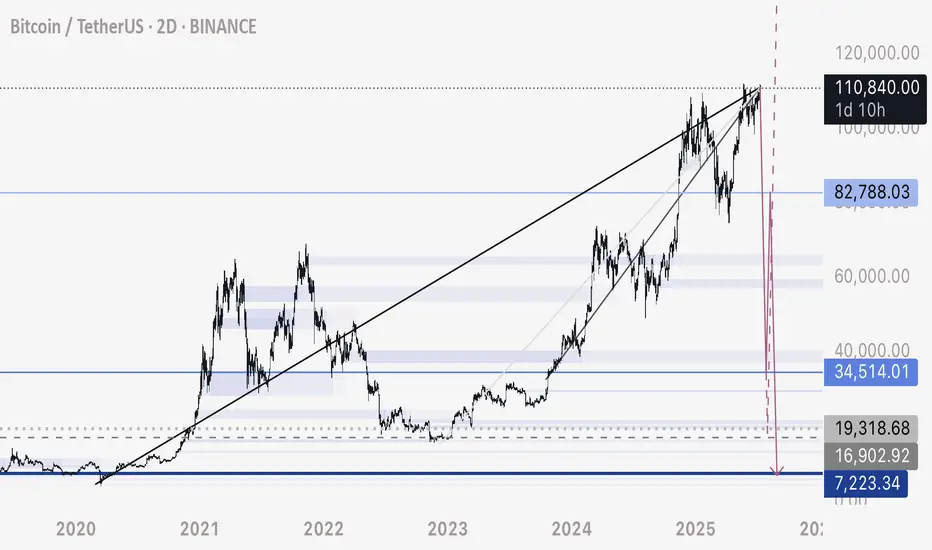
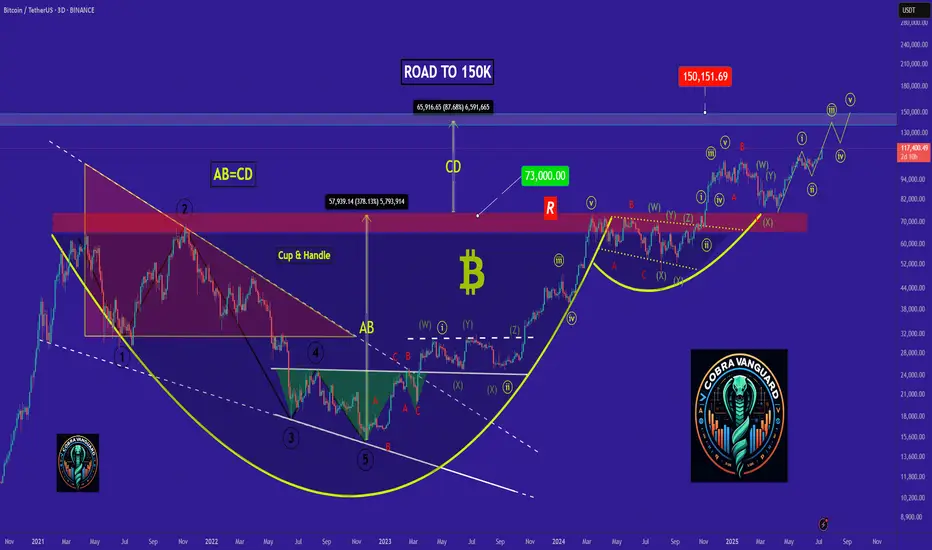
Bitcoin - Will hit 135k in the short-term, Elliott and FIBOBitcoin is rising! That's what everyone sees at the moment, but we don't want to get drunk and establish our profit target. Where to take profit? Because we are in the price discovery mode, there is no previous price action above the current price. At this moment we really cannot use any horizontal lines, gaps, volume profiles, imbalances, previous ranges, or previous swing highs to establish our profit target. So we have to use special tools, such as Fibonacci extension or Elliott Wave.
The Fibonacci extension is a great tool - in bitcoin's case we have a 1:1 FIB extension sitting at 135,096. This level is also in confluence with a major trendline that we can see on the chart. This gives us a really good profit target in the short term for this particular trade. This is also an opportunity to short Bitcoin here, if you trade futures. From the Elliott Wave perspective, we are in wave (3), so I made a prediction on where this wave should terminate and also where wave (5) should terminate. I think my analysis definitely makes sense! Please share your analysis in the comment section, only copy your link here.
Trading tip at the end: Avoid the Obvious / Market Traps - Some obvious trading situations are kind of a trap where the chances are that everyone else has also spotted a wonderful trade situation which eventually sets you up for a disaster. Many people get trapped in some obvious good looking trades. Some obvious trades can sometimes be the market traps as they are hyped, professional traders stay away from these traps. Write a comment with your altcoin + hit the like button, and I will make an analysis for you in response. Trading is not hard if you have a good coach! This is not a trade setup, as there is no stop-loss or profit target. I share my trades privately. Thank you, and I wish you successful trades!
BTCUSDT trade ideas
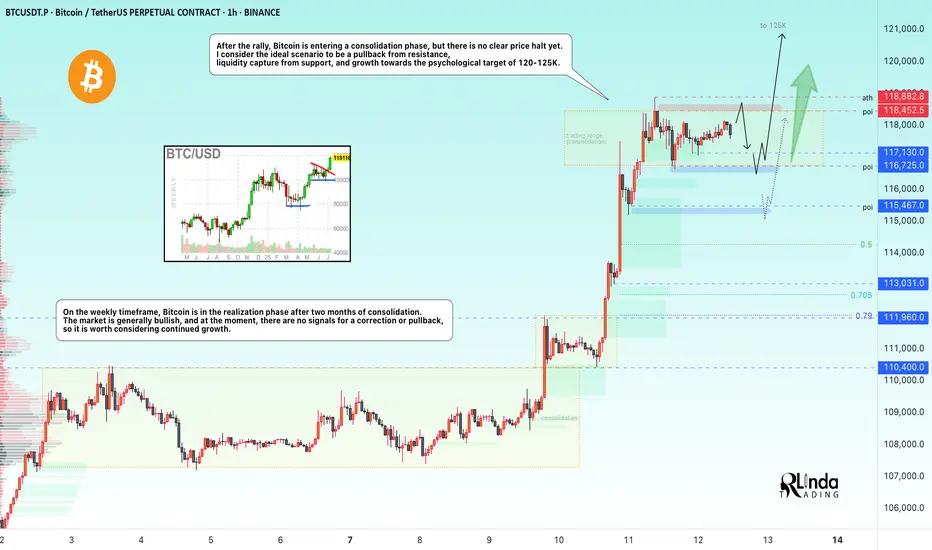
BITCOIN → Stopping after the rally? What next? 125K or 110K?BINANCE:BTCUSDT rose and updated its historical maximum to a new record of 118K with “kopecks” (different prices on different exchanges). Now the price has supposedly stopped and entered a consolidation phase, but it is too early to draw any conclusions based on this alone...
Fundamentally, Bitcoin rose following the SP500 and NQ100 indices. The reasons are clearly geopolitical. The correlation level is not high, but the flagship is following the stock indices, which are also updating their historical highs.
Technically, Bitcoin has emerged from a two-month consolidation and entered a realization phase. So what's next? Continuation of the phase or correction? Let's take a look.
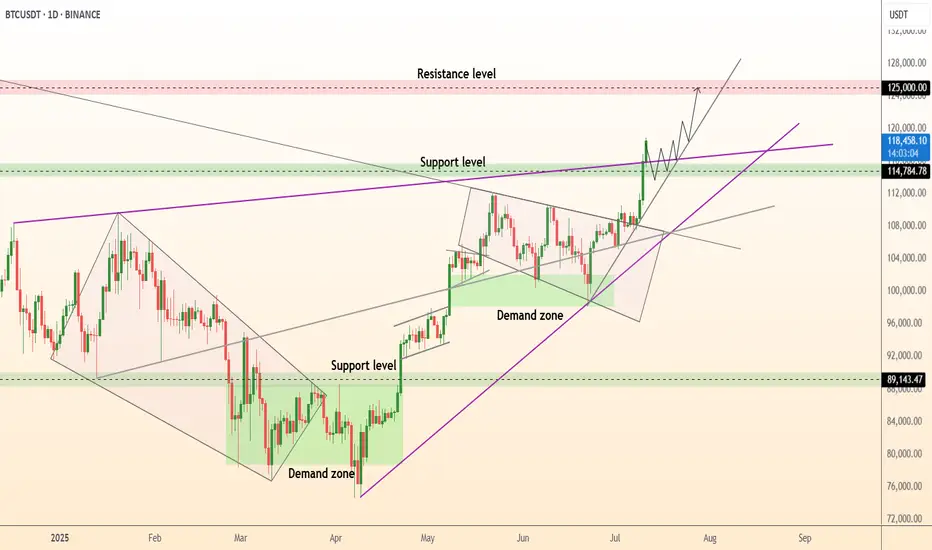
On the daily chart, I would highlight two zones. The risk and sell zone is below 117,500. If the price closes below this zone today/tomorrow, we will most likely be able to look for signals for a possible correction. As part of the correction, we can expect a decline to 115,500, 114,300, or even to the old ATH of 112K.
The second zone is the buying zone. A closing price above 118,400–118,900 and consolidation with the gradual formation of a breakout of structure may hint at a possible continuation of growth toward psychological targets.
Resistance levels: 118,400, 118900
Support levels: 117100, 116700, 115500
In the chart above, I have highlighted the situations, levels, and zones that interest me more precisely.
Now I am waiting for Bitcoin to retest resistance or support and confirm certain levels, based on which decisions can be made. I think that in the near future, Bitcoin will show us where it is headed. Updates will be published as something interesting emerges...
Best regards, R. Linda!
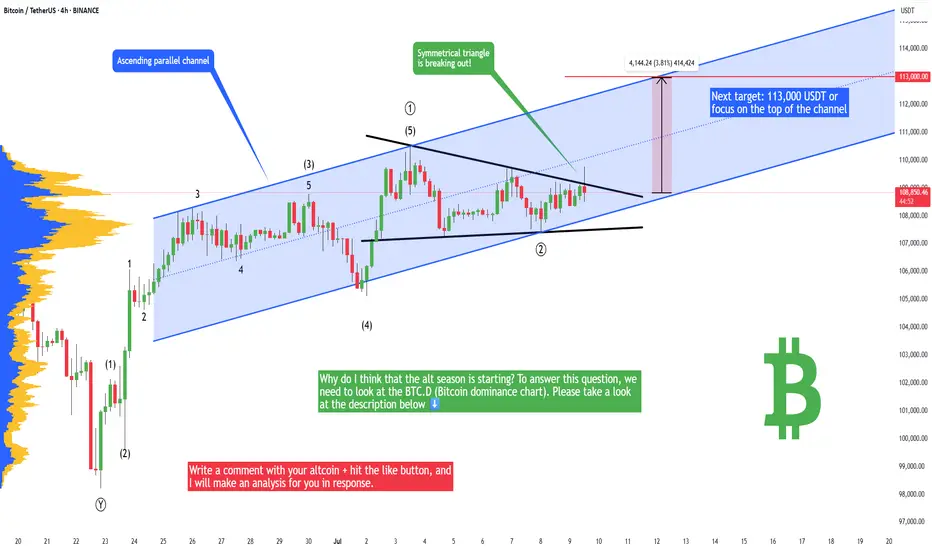
Bitcoin - Ready for a new all time high! + ALT SEASON startingBitcoin is breaking out of the symmetrical triangle and showing major signs of strength, so we can expect to hit a new all-time high in the short term! Bitcoin was struggling in the past weeks compared to the stock market, but this should end!
Why do I think that the alt season is starting? To answer this question, we need to look at the BTC.D (Bitcoin dominance chart). if BTC.D goes up, that means money is flowing out of altcoins to Bitcoin, and when BTC.D goes down, that means money is flowing from Bitcoin to altcoins. And we want BTC.D to go up! So what is the chart telling us?
First of all, this is not exactly BTC.D on TradingView, but this is BTCDOMUSDT.P. I think this chart may give us a better outlook on the dominance at the moment. So what we can see here is that the long-term trendline is breaking down, that's a pretty rare event.
That's definitely great news! Time to buy some altcoins and prepare for a bullish altcoin season. I would say forget about Bitcoin and a 5% profit; let's buy some altcoins, and I want you to tell me in the comment section, what altcoin do you believe in?
Write a comment with your altcoin + hit the like button, and I will make an analysis for you in response. Trading is not hard if you have a good coach! This is not a trade setup, as there is no stop-loss or profit target. I share my trades privately. Thank you, and I wish you successful trades! Trading tip at the end: Learn to bear losses - A trader needs to accept the losses to maintain their emotional stability. Losses are a crucial internal part of trading that helps traders to learn how to grow from their losses. Traders learn from losses and implement required changes in their strategies for better results in future trades.
Top Altcoins Choice —Your Pick · Bitcoin Hits New All-Time HighBitcoin is once again trading at a new all-time high and as this happens the altcoins go boom.
The first instance circled around the fact that Bitcoin was strong and range trading between $100,000 and $110,000. When Bitcoin goes sideways within a bull market, the altcoins tend to blow up, and blow up they need. Now, when Bitcoin moves to hit a new all-time high and keeps growing; the 2025 Cryptocurrency bull market is fully confirmed.
» Which one is your favorite altcoin trading pair?
» Which project you think will grow the most in 2025 & 2026?
» What is your TOP ALTCOIN CHOICE?
Top Altcoins Choice —Your Pick
Leave a comment with some of your favorite altcoins pairs, the ones you like most and I will do a full analysis for you. I will publish in my profile and also answer directly in the comments section. I will pick and choose.
If you see other commentators that have a pair that you like, make sure to boost their comment and reply. The more boosts a comments gets, higher priority will be given to the project and trading pair.
Boost this publication and leave a comment, let's get started with your TOP ALTCOINS CHOICE!
Namaste.
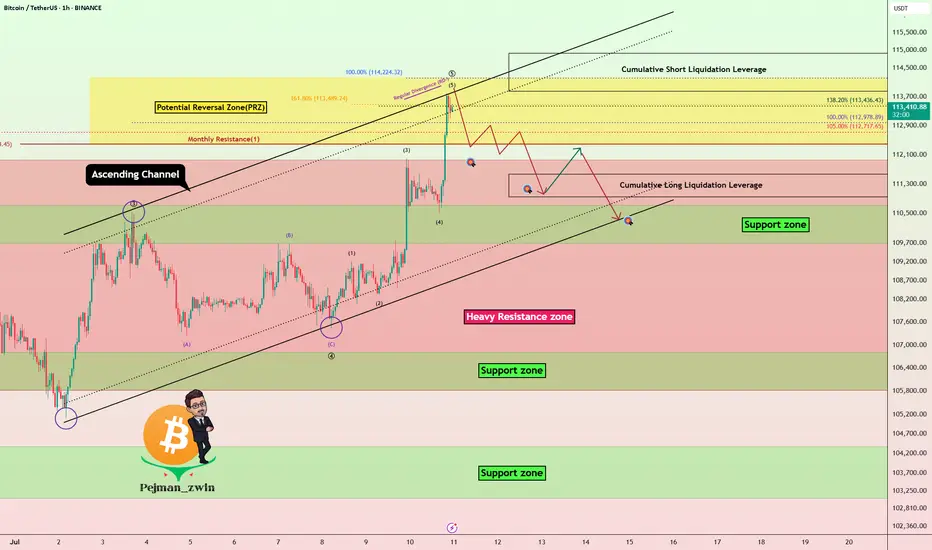
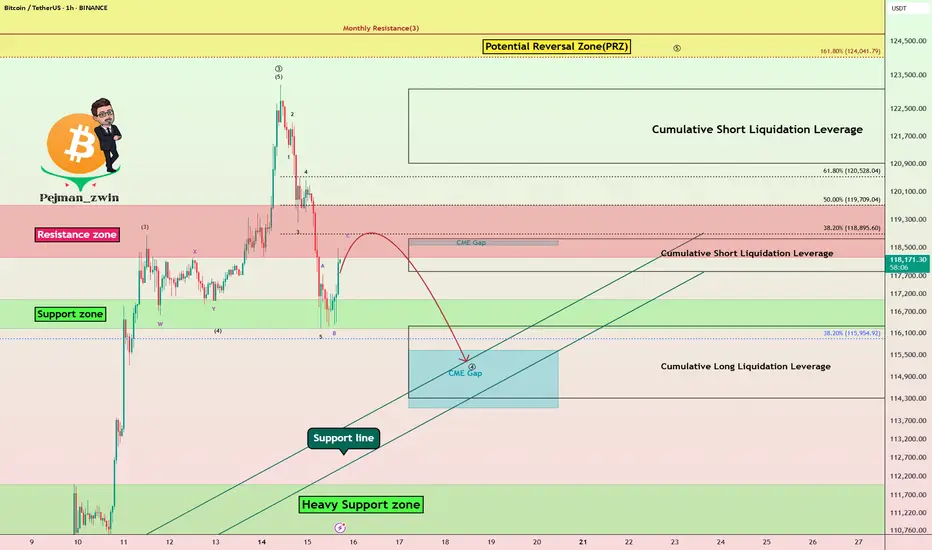
Bitcoin Hits New ATH – Is It Time to Short?Bitcoin ( BINANCE:BTCUSDT ) managed to form a new All-Time High(ATH) in the previous one-hour candles .
Do you think Bitcoin can create a new ATH in the coming hours?
Bitcoin is currently trying to break the Heavy Resistance zone($110,720-$105,820) . It has also penetrated the Potential Reversal Zone(PRZ) and Cumulative Short Liquidation Leverage($114,910-$113,850) .
In terms of Elliott wave theory , it seems that the 5 impulsive waves that Bitcoin started in the last 3 days can be completed above the ascending channel and PRZ .
Also, we can see the Regular Divergence(RD-) between Consecutive Peaks.
I expect Bitcoin to drop to at least Cumulative Long Liquidation Leverage($111,563-$110,947) . At least the price zone Bitcoin is in at the time of publishing this analysis is better for short positions , even if the Stop Loss(SL) is touched .
Note: Stop Loss(SL)= $115,023
Please respect each other's ideas and express them politely if you agree or disagree.
Bitcoin Analyze (BTCUSDT), 1-hour time frame.
Be sure to follow the updated ideas.
Do not forget to put a Stop loss for your positions (For every position you want to open).
Please follow your strategy and updates; this is just my Idea, and I will gladly see your ideas in this post.
Please do not forget the ✅' like '✅ button 🙏😊 & Share it with your friends; thanks, and Trade safe.
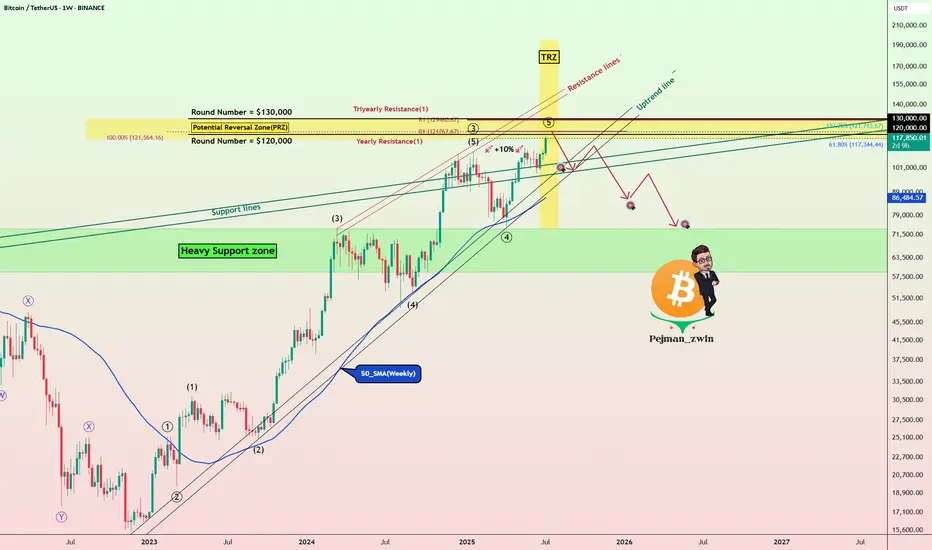
Bitcoin Roadmap=>End of RallyBitcoin ( BINANCE:BTCUSDT ) has gained nearly +10% in the recent weekly candle so far. The question is where this rally could end up. So to get to that zone, let’s go to the weekly timeframe .
Before we start this analysis, let’s take a look at my last analysis on the weekly timeframe , which was well into the Potential Reversal Zone(PRZ) . ( Analysis time: 9 JUN 2025 )
Bitcoin has now entered the Potential Reversal Zone(PRZ) and Time Reversal Zone(TRZ=June 23 to August 4) , and these zones could be the zones where this Bitcoin rally will end. Do you agree with me?
In terms of Elliott Wave theory , Bitcoin appears to be completing a main wave 5 , as the main wave 3 was an extended wave . The main wave 5 could end at the Potential Reversal Zone(PRZ) .
I expect Bitcoin to start a main correction from the Potential Reversal Zone(PRZ) and could continue to support lines and near the $105(at least) .
What do you think about the end of the Bitcoin rally?
Note: Sell orders near $120,000 are very heavy.
Note: Cumulative Long Liquidation Leverage attractive volume for liquidation.
Note: If Bitcoin goes above $130,000, it can continue to rise to the Resistance lines (near $150,000).
Please respect each other's ideas and express them politely if you agree or disagree.
Bitcoin Analyze (BTCUSDT), weekly time frame.
Be sure to follow the updated ideas.
Do not forget to put a Stop loss for your positions (For every position you want to open).
Please follow your strategy and updates; this is just my Idea, and I will gladly see your ideas in this post.
Please do not forget the ✅' like '✅ button 🙏😊 & Share it with your friends; thanks, and Trade safe.
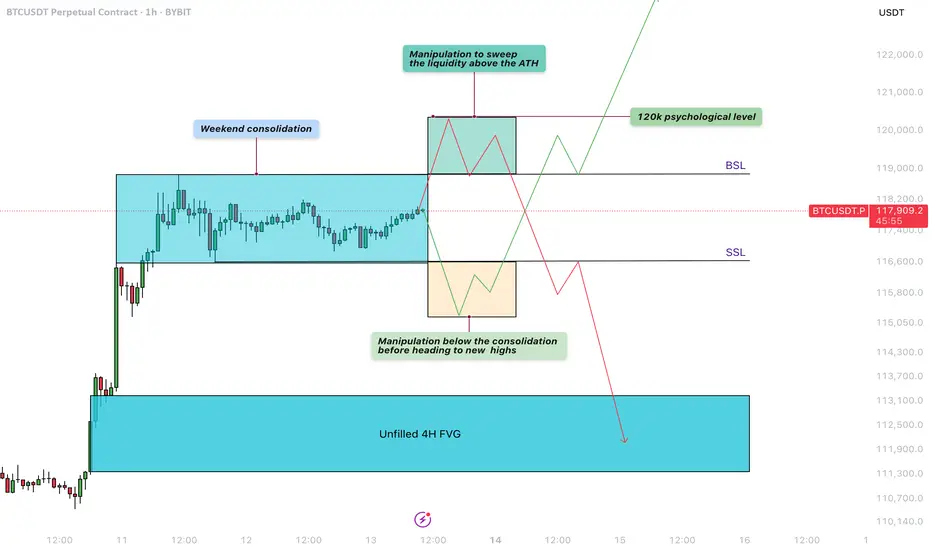
Bitcoin - Liquidity sweep before the next move!Weekend Consolidation
During weekends, Bitcoin often moves sideways as institutional players step back and retail traders prepare for the next move. During this consolidation phase between $117.000 and $119.000, liquidity builds up on both sides—sell-side liquidity below the range and buy-side liquidity above it. After these weekend consolidations, Bitcoin typically sweeps one side of liquidity before continuing in the opposite direction.
Manipulation Above the Buy-Side Liquidity
A significant amount of liquidity has formed just above the all-time high, right below the $120,000 level. Retail traders are positioning for a potential downward move, making this area a prime target for a liquidity sweep. This aligns perfectly with the psychological barrier of $120,000, a level where many traders are likely to take profits.
Manipulation Below the Sell-Side Liquidity
Over the weekend, traders are entering both long and short positions while placing stop-loss orders just below recent lows. This behavior creates a buildup of liquidity underneath the range. Bitcoin could dip below these lows to stop out retail traders before reversing to higher levels.
4-Hour Unfilled Fair Value Gap (FVG)
If Bitcoin sweeps the all-time high and enters a distribution phase, there’s a strong chance it will retrace to fill the unfilled Fair Value Gap on the 4-hour chart at $113.000 - $111.000. This imbalance was created during a sharp move up, leaving behind unfilled orders. Such levels often get revisited as price action seeks to rebalance.
How to Execute This Trade
Wait for Bitcoin to sweep either the low or the high of the weekend range. Avoid entering the market immediately after the sweep. Instead, wait for confirmation that price is returning back inside the range, signaling a clean sweep. On lower timeframes, such as the 5-minute chart, you can look for entry models like an inverse Fair Value Gap to refine your entry.
Final Thoughts
At this point, it’s unclear which direction Bitcoin will take next. The best approach is to wait for a clear liquidity sweep and signs of a reversal before entering any trades. That said, there’s a possibility we may first move up to test and claim the $120,000 psychological level before revisiting and filling the lower 4-hour imbalance zones.
Thanks for your support. If you enjoyed this analysis, make sure to follow me so you don't miss the next one. And if you found it helpful, feel free to drop a like and leave a comment, I’d love to hear your thoughts!
Atomic Pump Exploded, You Missed It! Now What?Ever opened your charts after a few hours off and realized the market just exploded upwards without you?
That feeling of missing out, regret, and mental chaos is real.
But here’s the thing: if you missed the move, what should you do next?
This post is for you the ones who feel like the train left the station, but still want to win the next round.
Hello✌
Spend 3 minutes ⏰ reading this educational material.
🎯 Analytical Insight on Bitcoin :
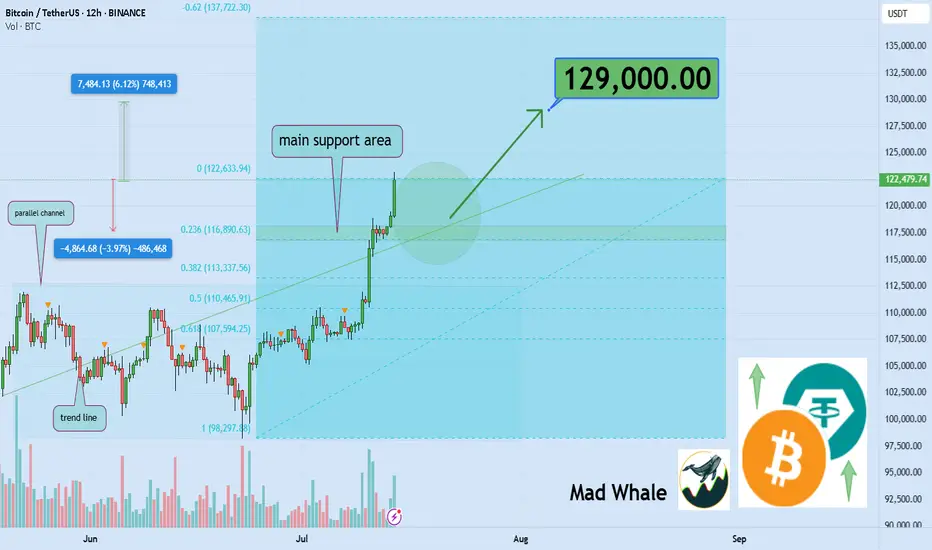
Volume remains the decisive factor driving BINANCE:BTCUSDT toward higher price levels 📈. Across various scenarios whether it’s market battles, FOMO spikes, institutional capital flows, or extended periods of consolidation volume confirms the strength behind the move. Discussions about Bitcoin as the new global currency continue to fuel interest and momentum. In the short term, I’m targeting $129,000 for Bitcoin, representing roughly a 6% upside from current prices 🚀.
Now , let's dive into the educational section,
🧠 Understanding the Trader Psychology After Missing a Market Nuclear Explosion
When the market suddenly pumps, the first thought for many traders is: “I missed it.” That’s where the mental storm begins. Your mind starts blaming you, your analysis, or even bad luck. But all of that is just an emotional response.
The real question is can you use this moment to build your self-awareness and grow as a trader?
🧨 Turning Mistakes into Opportunities Without Self-Blame
Missing a pump isn’t necessarily a mistake it’s just an outcome. Maybe you didn’t check the charts, maybe fear held you back. What matters is: what did you learn?
A real trader documents every misstep, studies it, and adjusts next time. Turn that missed opportunity into a "pivot moment".
Keep a trading journal. Write why you missed it. What signs were there that you ignored? What can you do differently next time?
📊 TradingView Tools to Hunt the Next Big Move 🚀
When the market explodes, jumping in without a plan is a recipe for disaster. Step one? Turn off your emotions. Step two? Open up TradingView.
In moments like these, a few key tools can help you figure out whether the pump is over — or just getting started. One of the most powerful tools is Volume Profile Visible Range (VPVR). It shows you where volume is stacking up.
Heavy pumps usually lead to corrections, but if VPVR shows strong volume still holding higher levels, the opportunity may not be gone yet.
Next is the Relative Strength Index (RSI). If RSI is already above 70, chances are you're showing up late. But here’s the twist if there’s a small dip, RSI cools down, and then starts rising again… that might be your real chance to enter.
💥 When the Market Blows Up Like a Nuclear Bomb, How Do You React?
When green candles start stacking and everyone’s flexing profits, you’re left behind staring at a chart that feels like it betrayed you.
This is exactly when people make emotional decisions. But urgent hype is the enemy of good analysis. Your first job here: stay calm and look at the trend like a surgeon.
🧩 Greed vs. Logic Entering at the Top or Waiting for a Pullback?
The question isn’t whether to enter now. The real question is: why are you entering?
Because you feel left out? Or because your system gives you a signal?
If your decision isn’t based on a clean setup, you’re not trading you’re gambling. Logic must win over emotion. Every. Single. Time.
🧱 Coping With the Psychological Wall of Missing Out
The pain of missing out is real. It’s like arriving at the station just to see the train’s dust.
But here’s the truth: this wasn’t the last train.
One of the best traits of a great trader is the belief in future opportunities. If you chase what’s already gone, you’ll keep losing.
Instead, focus on rebuilding your mindset.
🎯 Smart Goal Setting: Prepare for the Next Wave, Don’t Chase the Previous One
Don’t chase a pump that’s already peaked. Instead, watch for early signs of the next one.
Look at coins that haven’t moved yet but are building momentum.
Focus on price action, volume behavior, hidden news, and reliable chart patterns. Let logic lead the way not FOMO.
🔄 What’s the Best Move After Missing a Pump? Maybe… Do Nothing
Sometimes, doing nothing is the best strategy.
The market isn’t a one-time lottery ticket. It gives out chances regularly but your impatient mind makes you believe you’re running out of time.
If your next move feels rushed, pause. Train your discipline to only trade with a cool head.
💡 Pro Tips to Come Back Stronger in the Next Big Move
Instead of regret, build a killer watchlist.
Set smart price alerts.
Go back to your past data and find recurring setups.
Sharpen your skills, study tools that help, and prepare for different scenarios.
Being prepared = staying ahead.
✨ Need a little love!
We pour love into every post your support keeps us inspired! 💛 Don’t be shy, we’d love to hear from you on comments. Big thanks , Mad Whale 🐋
📜Please make sure to do your own research before investing, and review the disclaimer provided at the end of each post.
BTCUSDTHello Traders! 👋
What are your thoughts on BITCOIN?
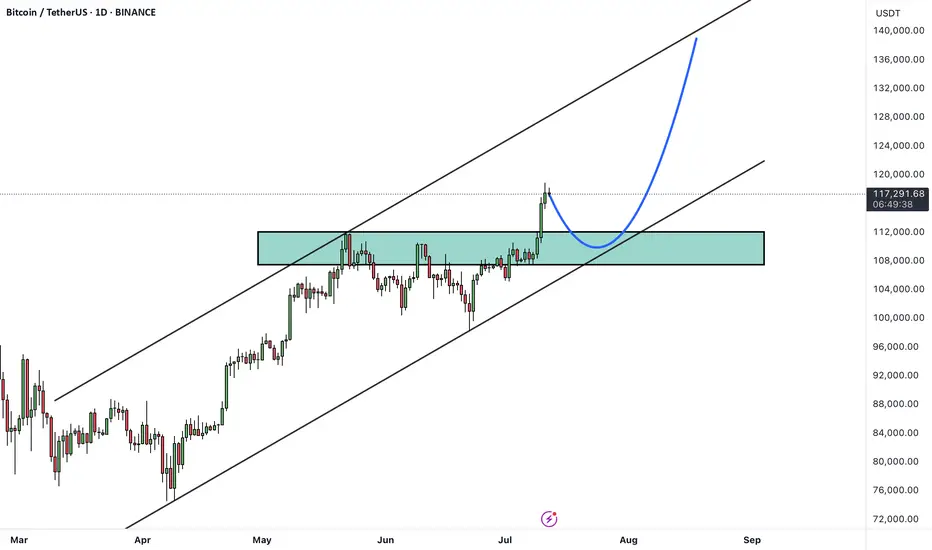
Bitcoin has recently broken above its all-time high and printed a new record high, signaling strong bullish momentum. Currently, the market has entered a consolidation phase, which is typical after such a major breakout.
A pullback toward the previous breakout level (the old all-time high) is expected, which now acts as new support.
After this consolidation and pullback, the price could resume its bullish trajectory and move toward higher targets, including the upper boundary of the current bullish channel.
As long as the price remains above the key support zone, the overall trend remains bullish and any dip could be seen as a buying opportunity within the broader uptrend.
Will this consolidation lead to the next leg up, or is a deeper correction ahead? Share your thoughts below! 🤔👇
Don’t forget to like and share your thoughts in the comments! ❤️
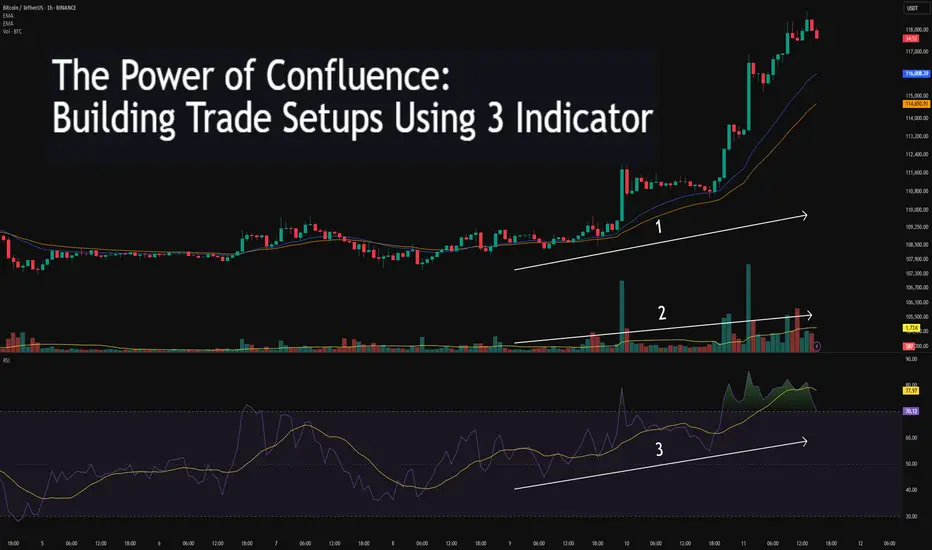
The Power of Confluence: Building Trade Setups Using 3 Indicator🔵 INTRODUCTION
Many traders fall into the trap of relying on a single indicator to make trading decisions. While one tool might work occasionally, it often leads to inconsistent results. The key to consistency lies in confluence — the strategic combination of multiple indicators that confirm each other.
In this article, you'll learn how to build high-probability trade setups by combining three essential components: trend , momentum , and volume .
🔵 WHY CONFLUENCE MATTERS
Confluence refers to multiple signals pointing in the same direction. When different indicators agree, your trade idea becomes much stronger. It helps reduce noise, avoid false signals, and increase confidence in your entries.
Think of it like crossing a busy road: you wait for the green light, check both sides, and make sure no cars are coming. The more confirmations you have, the safer your move.
🔵 WHAT IS CONFLUENCE IN TRADING?
Confluence means agreement. In trading, it’s when different methods, indicators, or tools all point toward the same outcome.
Think of it like this:
One green light? Maybe.
Two green lights? Worth watching.
Three green lights? That’s a trade worth considering.
Imagine you're planning a road trip. You check the weather forecast (trend), Google Maps traffic (momentum), and ask a local for advice (volume). If all three say “go,” you’re more confident in your decision. Trading works the same way — using multiple tools to validate a setup reduces risk and removes guesswork.
Important: Confluence is NOT about cramming 10 indicators onto your chart. It’s about using a few that each offer different types of information — and only acting when they align.
🔵 THE 3-STEP CONFLUENCE SETUP
1️⃣ Identify the Trend (Using EMAs)
Before entering any trade, you need to know the market direction. You can use:
Moving Averages (e.g., 21 EMA and 50 EMA crossover)
Structure-based analysis (e.g., higher highs = uptrend)
Trade only in the direction of the prevailing trend.
2️⃣ Check Momentum (Using RSI, MACD, or Stochastic)
Momentum tells you whether the market supports the current trend or if it's weakening.
RSI above 50 → Bullish momentum
MACD histogram rising → Acceleration
Stochastic crossing above 20 or 80 → Momentum shifts
Avoid entering when momentum is fading or diverging from price.
3️⃣ Confirm with Volume (To Validate Participation)
Volume reveals the strength behind the move. A breakout or trend continuation is more reliable when it's backed by volume.
Look for:
Volume spikes at breakout points
Increasing volume in the direction of the trend
Volume confirmation after pullbacks or retests
No volume = no conviction. Watch how the market "votes" with actual participation.
🔵 EXAMPLE TRADE SETUP
Let’s say you spot a bullish trend with 21 EMA above 50 EMA. RSI is above 50 and rising. A pullback forms, and volume picks up as price starts to push higher again.
That’s trend + momentum + volume lining up = a confluence-based opportunity.
🔵 BONUS: HOW TO ENHANCE CONFLUENCE
Add price action patterns (flags, wedges, breakouts)
Use support/resistance zones for cleaner entries
Combine with higher timeframe confirmation
Wait for retests after breakouts instead of chasing
Confluence doesn't mean complexity — it means clarity.
🔵 CONCLUSION
The best traders don’t guess. They wait for the market to align. By combining trend, momentum, and volume, you filter out weak setups and focus only on the highest-probability trades.
Start testing confluence-based setups in your strategy. You’ll likely find more consistency, fewer fakeouts, and greater confidence in your execution.
Do you trade with confluence? What’s your favorite trio of indicators? Let’s talk in the comments.
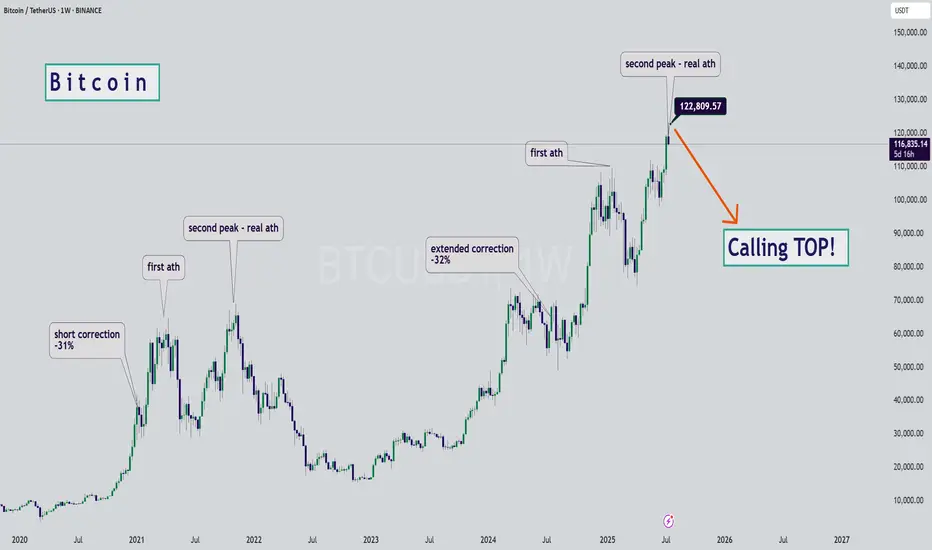
BTC - Calling the Start of the Bearish SeasonHello Watchers ☕
This was my previous Bitcoin update where I had a target of $116K, and also then closed all open positions at $122K:
I'm calling the top here mainly because of the way the chart looks, it really is classic Wyckoff if you look at the duration of the current bullish cycle, which has lasted a whole 973 Days with a 564% increase. What goes up, must come down!
Just for interest sake, the previous bullish cycle ran for 600 days with a 700% increase.
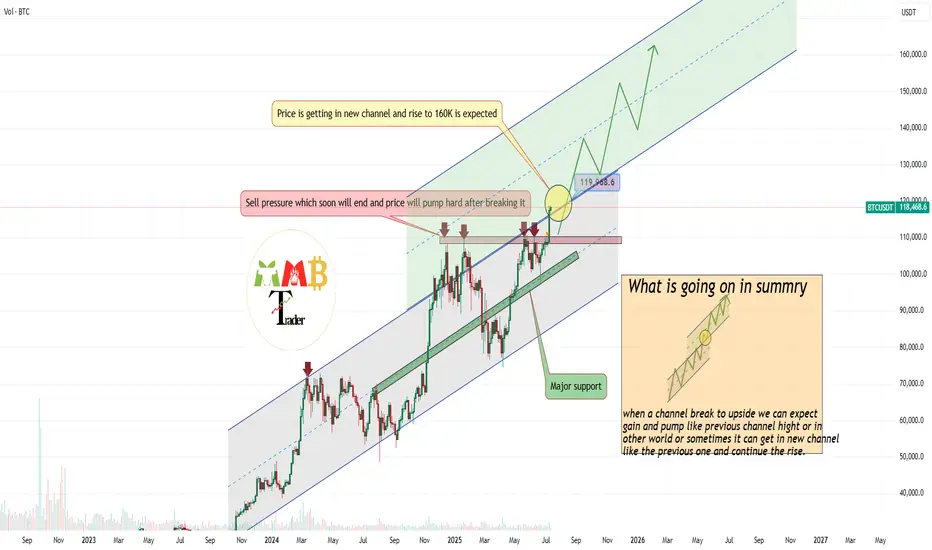
Bitcoin in New Ascending channel wait for 160K$As we can see Price broke previous ATH & channel resistance together and is holding strong, if it continue soon new channel is path to claim for Price based on chart and targets like 160K is just easy to hit.
So get Ready for new Highs and ATH here also this breakout to upside was mentioned in previous analysis and now that it is happening don't get surprise if you see notifications like Bitcoin new ATH 150K$.
DISCLAIMER: ((trade based on your own decision))
<<press like👍 if you enjoy💚
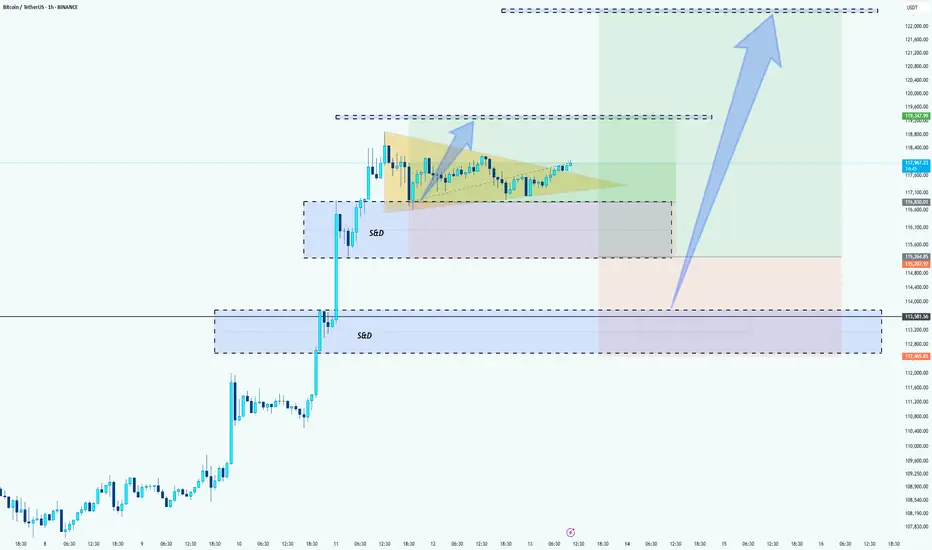
BTC Bullish Setup: Two Long Positions Aligned for ContinuationHello guys!
Bitcoin is currently in a strong uptrend, consolidating after a sharp move up. The chart highlights a textbook bullish continuation pattern (pennant/triangle), suggesting momentum is building for another leg up.
Attention:
This is not an either-or setups. Both long entries are valid and could trigger one after the other, offering layered opportunities for bulls.
1- First Long: Breakout from Bullish Pennant
Price is tightening inside a triangle after a strong impulse move.
A breakout above the resistance around $118K would confirm continuation.
Entry on the breakout targets the upper liquidity zone near $122K.
2- Second Long: Pullback to S&D Zone (around $115K)
If the breakout happens and then retraces, watch for price to revisit the S&D zone at $115,200–$115,800.
This area will act as support and provide a second long opportunity.
target: around $122k
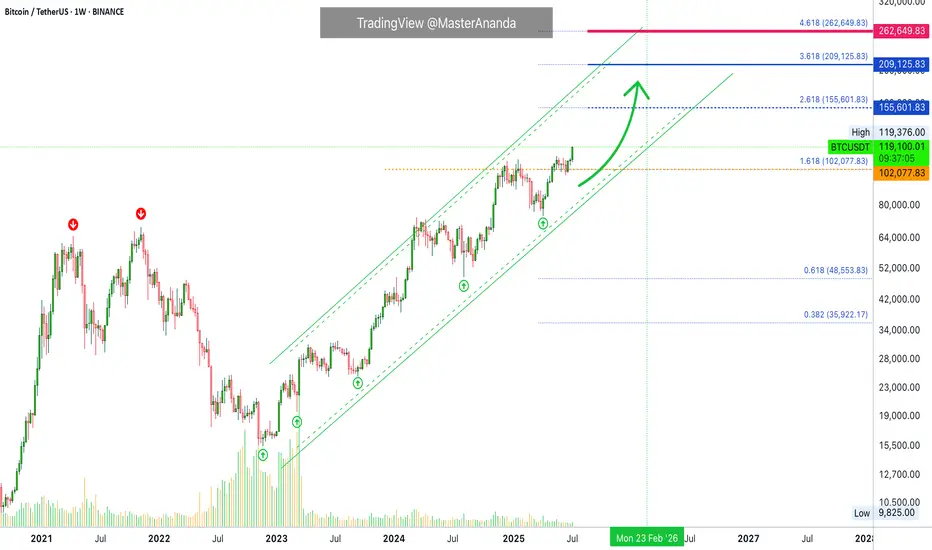
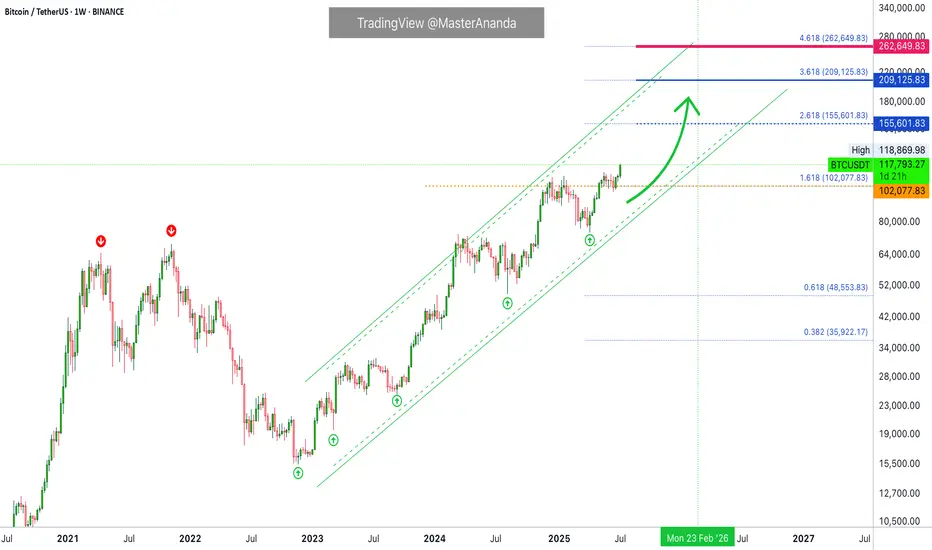
Bitcoin Crash? No! The Bullish Wave Starts Now! $155,601 Next!Some people are still expecting for "Bitcoin to go down." Poor bastards, the advance is just starting. Bitcoin just broke out of a 210 days long consolidation phase. After this huge, long-term consolidation, expect a major advance. Next target is now set at $155,601.
This week is the first week green after the consolidation finally ends. The market was sideways for seven months, with some fluctuations, and the result is a bullish breakout. Why a breakdown? Why expect a drop? If the market just broke up—think about it—why would it go down?
If resistance is confirmed; you remember the range between $100,000 and $110,000. If resistance is confirmed then Bitcoin would start crashing down from $110,000. If the break of $110,000 does happen and Bitcoin moves to $112,000 as a bull-trap, then you would expect a major crash happening from $112,000 and no more. But, reality is saying, showing, something much different. We have a major advance. Resistance has been flipped into support.
Now, the first that is needed is the weekly close. It is still very early into this move but Bitcoin is showing maximum strength. Remember the altcoins? These confirm that the advance is just new, early, because these are recovering from all-time lows or major lows. There is still plenty of room for growth.
My people, wake up! Bitcoin is going up.
The next target is $155,601 and it can go higher, this is only the mid-term target based on the long-term. When Bitcoin consolidates for 7 months, it tends to grow some 137% on average, it can be less but it can also be much more. And it tends to grow at least for 1-2 months, but this also is just the average, Bitcoin can grow straight up for 4 months.
So, are you still bearish?
Oh please no! The bulls already won.
The 2025 bull market final phase starts now, soon you will experience a marketwide bull-run. We have not seen the euphoria phase, this is only the start. Prepare for additional growth.
I am calling out all of the bears, never bet down on Bitcoin; Bitcoin is going up.
Namaste.
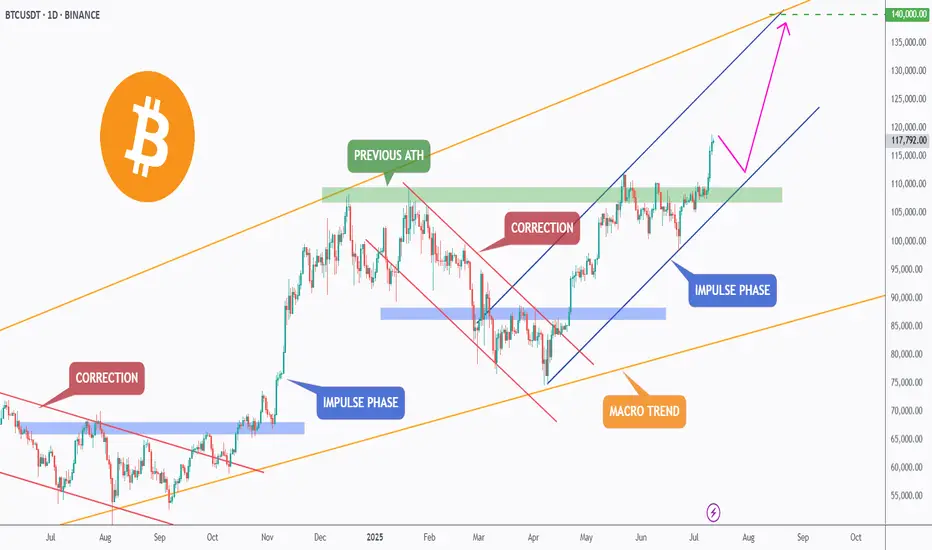
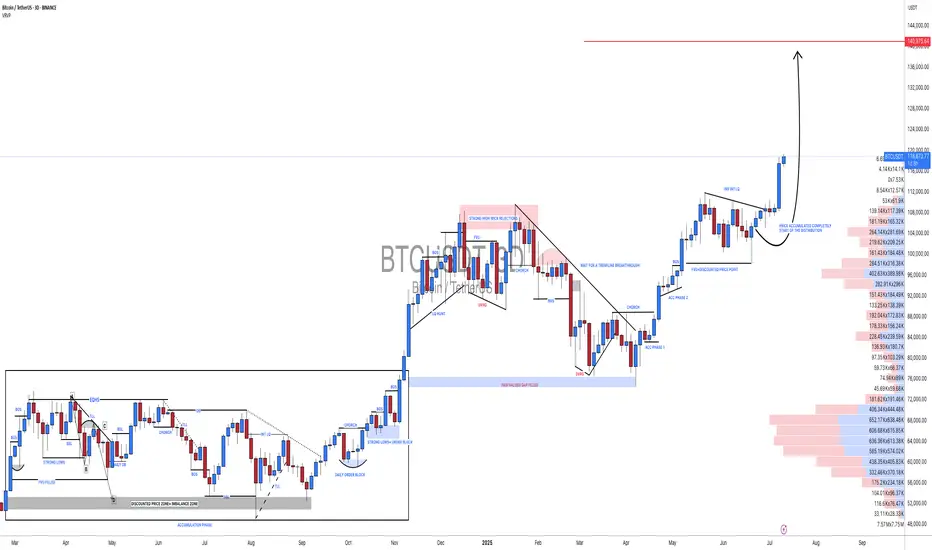
BTC is Back in Price Discovery Mode — Targeting $140K!After a clean break above the previous all-time high, Bitcoin has officially entered a new impulse phase, trading within a steep rising channel.
The green zone around the previous ATH is now acting as a strong support zone, confirming the shift in market structure.
🟠 The macro trend remains intact, and bulls are clearly in control.
🌀 Corrections continue to offer opportunities for trend-following entries, and if momentum holds, BTC could be on its way toward the $140,000 mark — the upper boundary of the macro channel.
Until then, every dip is a gift in this bullish cycle. 🔥
🧠 Trade with the trend. Manage your risk. Stay ready.
📚 Always follow your trading plan regarding entry, risk management, and trade management.
Good luck!
All Strategies Are Good; If Managed Properly!
~Richard Nasr
BTC - Last Chance to Prepare for Potential Flash Crash (Full) Expanding on my previous update - this chart is the zoomed out and expanded look at correction movement and liquidity zones to these lows.
Pathway to these levels is filled with long position stop losses - sell orders leveraged.
Orders triggered will create a cascading chain reaction and this is why we see fast movements and “stop hunts” as they are AKA.
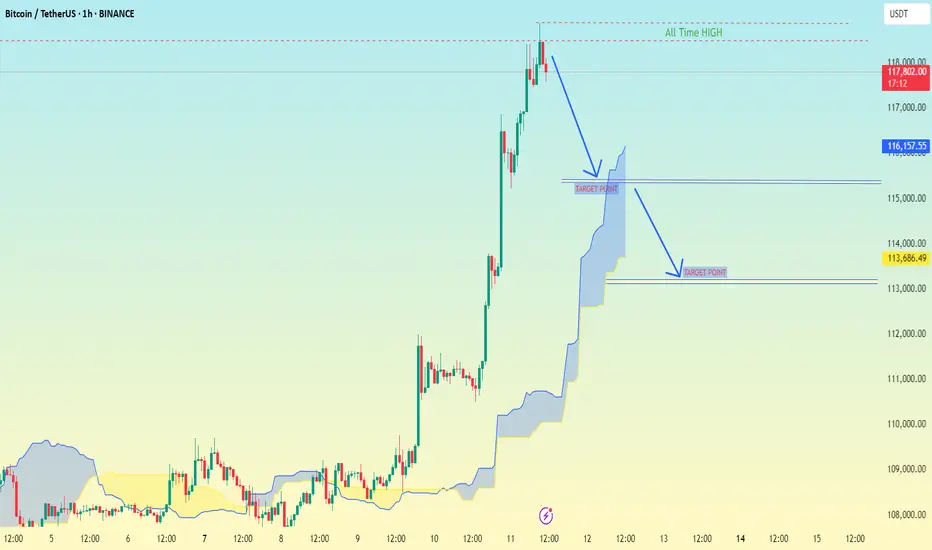
Bitcoin (BTC/USDT) on the 1-hour timeframeBitcoin (BTC/USDT) on the 1-hour timeframe:
🔽 Bearish Target Points (Downside Levels):
First Target: ~116,157.55 USDT
This level is close to the upper edge of the Ichimoku Cloud (Kumo), which can act as initial support.
Second Target: ~113,686.49 USDT
This is the deeper pullback level, marked clearly as the main "Target Point" on the chart. It aligns with historical structure and is near the lower part of the cloud.
🧠 Summary:
The chart suggests a potential pullback from the recent all-time high (~118,110 USDT).
If price breaks below 116k, the next major support is ~113.6k.
Traders might look for buy entries at these levels if price action confirms support.
#BTCUSDT[BITCOIN]: What Next Now For Bitcoin? We’ve published multiple analyses on Bitcoin, and as expected, the price has moved in line with our predictions. Now that it’s reached an emotional level of 120k, the main question is: will price hold on to the bullish volume and continue the bull move to the next target, which could be 130k or 150k? In our opinion, price will remain bullish until it touches the 130k region. At that point, we could see a short-term bearish correction for Bitcoin. Please do your own analysis and risk management.
Team Setupsfx_
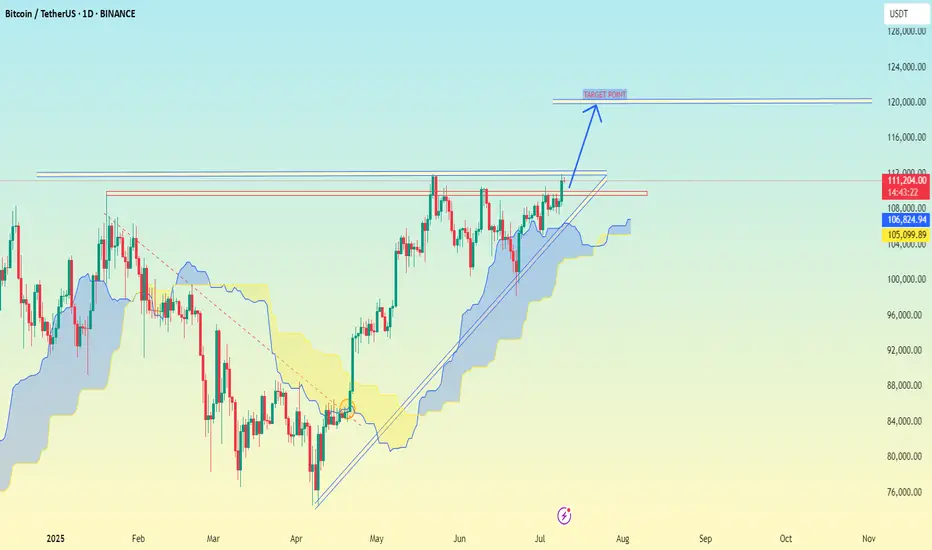
(BTC/USDT) appears to be around $120,000.(BTC/USDT) appears to be around $120,000.
Here's a quick analysis of what the chart suggests:
Timeframe: 1D (Daily)
Current price: ~$111,150
Technical Indicators:
Ascending triangle breakout is indicated.
Ichimoku Cloud shows bullish momentum (price above the cloud).
The breakout is targeting a horizontal resistance zone around $120,000.
✅ Target Zone:
Target Point (based on breakout projection): $120,000 – $124,000
This target aligns with previous resistance levels and technical breakout patterns.
Let me know if you want a more detailed technical breakdown (e.g., support/resistance zones, volume analysis, RSI, etc.).
bitcoin - Time to buy again!As I mentioned, the price has started the third bullish wave and has shown good growth so far, with the bullish wave still ongoing. In my opinion, the price could rise to $127k, after which it may correct to form the fourth corrective wave.
previous analysis
DeGRAM | BTCUSD ATH📊 Technical Analysis
● Daily close above the purple 2-month trend-cap and 114.8 k horizontal flips both into support, confirming the grey ascending triangle break.
● Measured move and channel geometry aim at the 125 k supply band; higher-lows keep bulls in control while risk is contained by the 107 k–109 k demand shelf (confluence of mid-line and former wedge top).
💡 Fundamental Analysis
● Spot-ETF net inflows (>10 k BTC since 8 Jul) and stable miner balances signal shrinking sell pressure, while softer US CPI has pushed real yields to 3-week lows—reviving crypto bid.
✨ Summary
Long 109–112 k; hold above 114.8 k targets 120 k → 125 k. Invalidate on a daily close below 107 k.
-------------------
Share your opinion in the comments and support the idea with a like. Thanks for your support!
Bitcoin Struggles Below $120K:Will the CME Gap Pull Price Lower?Bitcoin ( BINANCE:BTCUSDT ) has been experiencing a high momentum bullish trend in recent days, which few people expected, especially when it crossed $120,000 . However, in the past 24 hours , Bitcoin has fallen back below $120,000 .
Bitcoin is currently trading in the Resistance zone($119,720-$118,240) and Cumulative Short Liquidation Leverage($118,757-$117,829) on the 1-hour time frame .
In terms of Elliott Wave theory , Bitcoin appears to be completing a main wave 4 . Main wave 4 is likely to have a Zigzag Correction(ABC/5-3-5) .
I expect Bitcoin to attack the Support lines and fill the CME Gap($115,060-$114,947) in the next hour.
Cumulative Short Liquidation Leverage: $123,087-$120,922
Cumulative Long Liquidation Leverage: $116,305-$114,325
Do you think Bitcoin can create a new ATH again?
Note: Stop Loss(SL)= $121,000
Please respect each other's ideas and express them politely if you agree or disagree.
Bitcoin Analyze (BTCUSDT), 1-hour time frame.
Be sure to follow the updated ideas.
Do not forget to put a Stop loss for your positions (For every position you want to open).
Please follow your strategy and updates; this is just my Idea, and I will gladly see your ideas in this post.
Please do not forget the ✅' like '✅ button 🙏😊 & Share it with your friends; thanks, and Trade safe.
TradeCityPro | Bitcoin Daily Analysis #125👋 Welcome to TradeCity Pro!
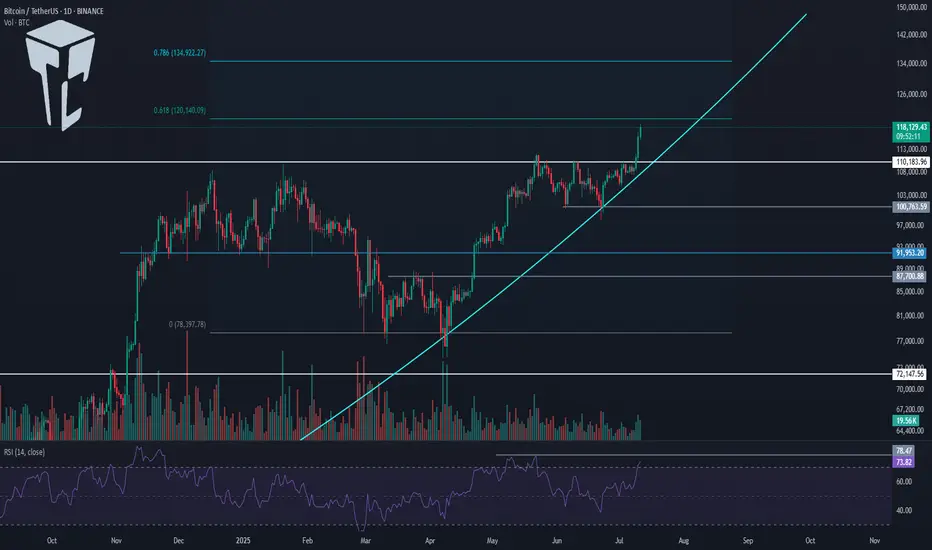
In this Bitcoin analysis, I want to switch to a higher timeframe and analyze the daily chart because a very significant resistance has been broken and it’s important to take a closer look.
📅 Daily Timeframe
On the daily chart, as you can see, a bullish trend started around the 80000 level and in the first leg moved up to 110183. After a prolonged correction, the price has now managed to break that previous high and begin a new bullish leg.
⚡️ As shown, volume was sharply decreasing during the correction phase, but in the past few candles, significant buying volume has entered the market, enabling the price to break above 110183.
💥 The RSI oscillator is entering the Overbuy zone in today’s candle, which could be a sign of continuation of this bullish move. The next RSI resistance is around 78.47.
🎲 Meanwhile, based on Fibonacci levels, 120140 and 134922 are key zones that could mark the end of this bullish leg. The price is currently very close to 120140, and we need to watch for the market's reaction to this level.
✅ If 120140 is broken, Bitcoin will likely head toward 134922. In that case, I believe this leg could be the final bullish leg of this bull run, since I’ve previously mentioned that my target range for Bitcoin in this cycle is between 130000 and 180000.
📊 The curved trendline I’ve drawn is very important in this leg. As long as the price remains above this trendline, the market momentum will stay bullish, and the likelihood of continued upward movement increases.
🔽 If this trendline is broken, we could see the first signal of a trend reversal. A close below 110183 would confirm that the breakout was fake, and a break below 100763 would open the door for a longer-term short position.
❌ Disclaimer ❌
Trading futures is highly risky and dangerous. If you're not an expert, these triggers may not be suitable for you. You should first learn risk and capital management. You can also use the educational content from this channel.
Finally, these triggers reflect my personal opinions on price action, and the market may move completely against this analysis. So, do your own research before opening any position.