Bitcoin ATHBINANCE:BTCUSDT This is amazing for crypto community because this level-up all of lover crypto currencies.
Next target: 120.000K
Best for pollback levels: 111.000K & 105.500K
👓We are this time keep calms emotional in buy or sell.
BTCUSDT trade ideas
BTC/USDT Analysis — Hidden Buyer
Hello everyone! This is the daily analysis from the CryptoRobotics trading analyst.
Yesterday, Bitcoin continued its move toward the local low and formed a false breakout.
Throughout the decline, we observed a positive delta, which may indicate gradual accumulation of long positions. At the same time, the descending trendline has not yet been broken, and there was strong absorption of market buys around ~$118,400 and ~$118,800 — which makes entering long positions very risky at the moment.
Our main expectations are based on further rotation within the range marked in yesterday’s analysis. In the short term, we are watching for a test of two local zones to assess the reaction from sellers. If the reaction is weak, a test of the upper boundary of the new sideways range is quite possible.
Buy zones:
$116,200–$115,000 (volume anomalies)
$110,000–$107,000 (accumulated volume)
Sell zones:
~$118,400 and ~$118,800 (local resistances)
This publication is not financial advice.
Bitcoin Retests Broken Trendline Minor Resistance in Focus!Bitcoin has recently taken support from the lower levels and moved upward, successfully breaking above a key trendline resistance. Currently, the market appears to be forming another minor trendline resistance on the short-term chart. Interestingly, the previous trendline that was broken is now acting as a support zone, indicating a potential shift in market structure.
If the price manages to break this newly developing minor trendline resistance, we may expect a possible retest of that level. Should the retest hold, it could provide a strong bullish signal, allowing Bitcoin to continue its upward movement toward higher liquidity zones or resistance levels.
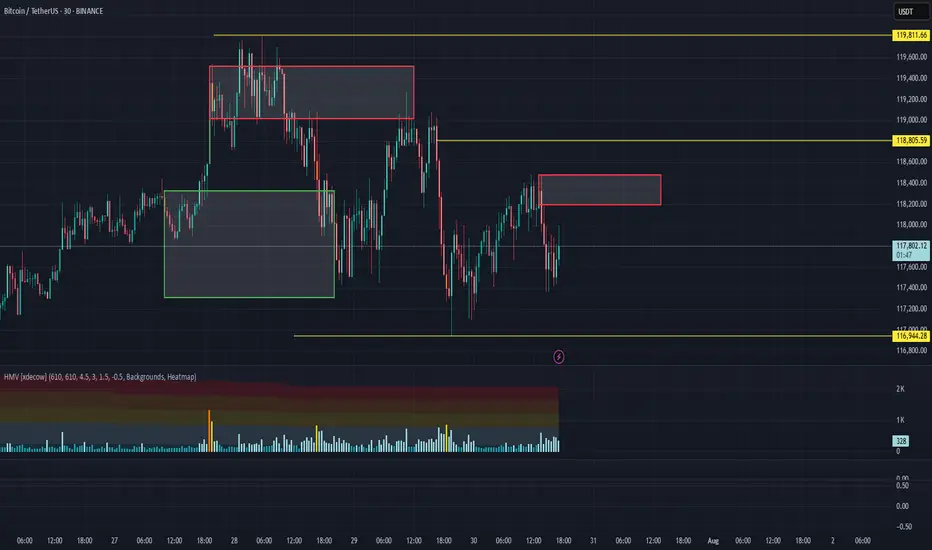
BTC/USDT Analysis — Potential Sideways Range
Hello everyone! This is the daily analysis from the CryptoRobotics trading analyst.
Yesterday, Bitcoin experienced a local reversal. At this point, two zones previously marked by us have been worked out:
Buy zone — $118,300–$117,300
Sell zone — $119,500–$119,000
We now expect continued rotation within the $117,400–$119,800 range, with potential expansion in both directions. The overall context remains positive, so a full breakout to the upside could occur in the near future.
Buy zones:
$116,200–$115,000 (volume anomalies)
$110,000–$107,000 (accumulated volume)
This publication is not financial advice.

Hunting for liquidity. Retest resistance before a fallBitcoin is still in correction, but is rebounding from the local low of 117.4, formed during the pullback, and is heading back up towards the zone of interest at 119.8-120.1, which it did not reach during the main upward movement. I see no fundamental or technical reasons for the correction to end and for growth beyond 121K. I expect a rebound from the resistance zone towards 115-114K. However, in the medium term, I expect the market to attempt to close half or all of the gap between 112K and 114.8K, thereby expanding the key trading range.
Resistance levels: 119.77, 120.1K, 120.8K
Support levels: 117.4, 116.37, 115.68
Technically, a false breakout (liquidity capture) of key resistance and price consolidation in the selling zone could trigger bearish pressure on the market, which in turn would lead to a correction.

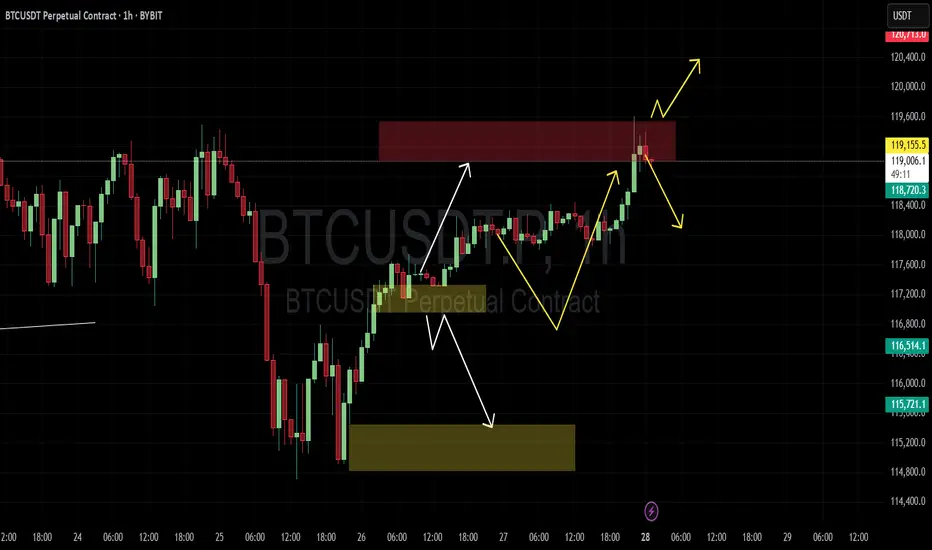
#BTC Update #11 – July 29, 2025#BTC Update #11 – July 29, 2025
Bitcoin continues to move within the channel and has completed several corrections of its last impulsive move. It is currently undergoing a correction within a correction. There was a liquidation zone around the $117,000 level, which was mostly filled, triggering a reaction.
From what we can observe now, Bitcoin is facing rejection from the upper boundary of the channel. If it manages to break out of the channel and continue its climb, I believe it will target the high liquidity zone near $122,000.
At this stage, Bitcoin is not in a suitable position for either long or short trades.

BTC SMALL CORRECTION ? we did an amzing long and gained good profit
now looking for a short and a breakout for long
posted next moves
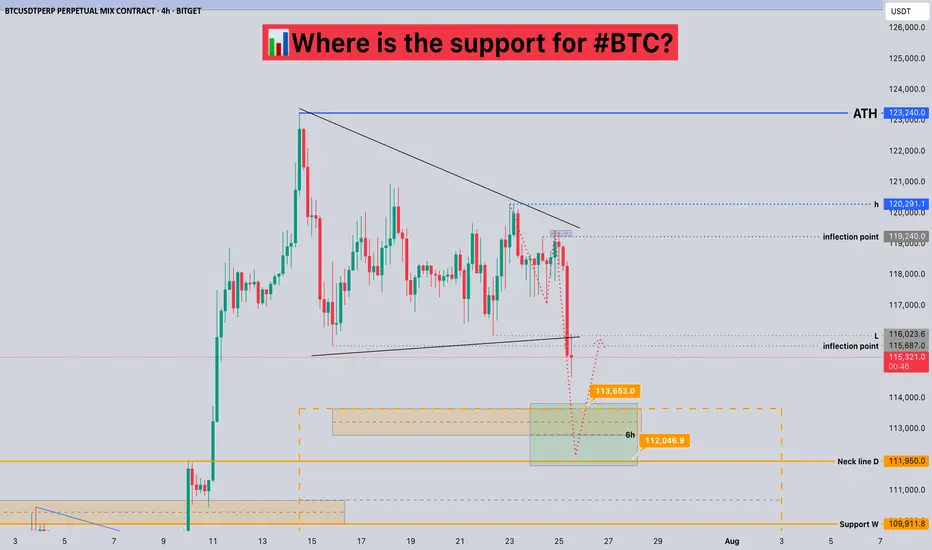
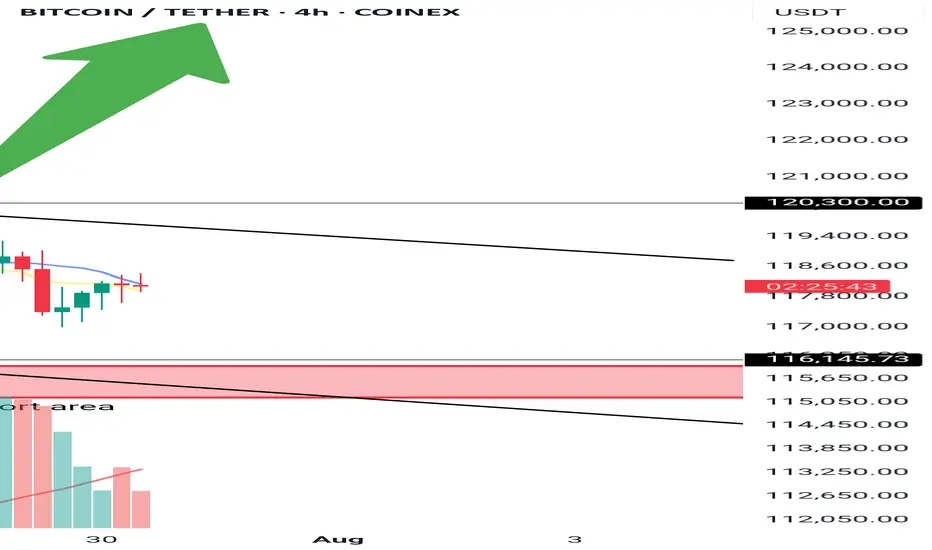
Where is the support for #BTC?📊Where is the support for #BTC?
🧠From a structural perspective, we did not stabilize after breaking through the inflection point of 119240, but broke down quickly. According to the current structure, the short-term support area is 112000-113700.
➡️From a morphological perspective, we failed to successfully break through the h point, but chose to break down, so we need to be vigilant about further pullbacks!
🤜If you like my analysis, please like 💖 and share 💬
BITGET:BTCUSDT.P
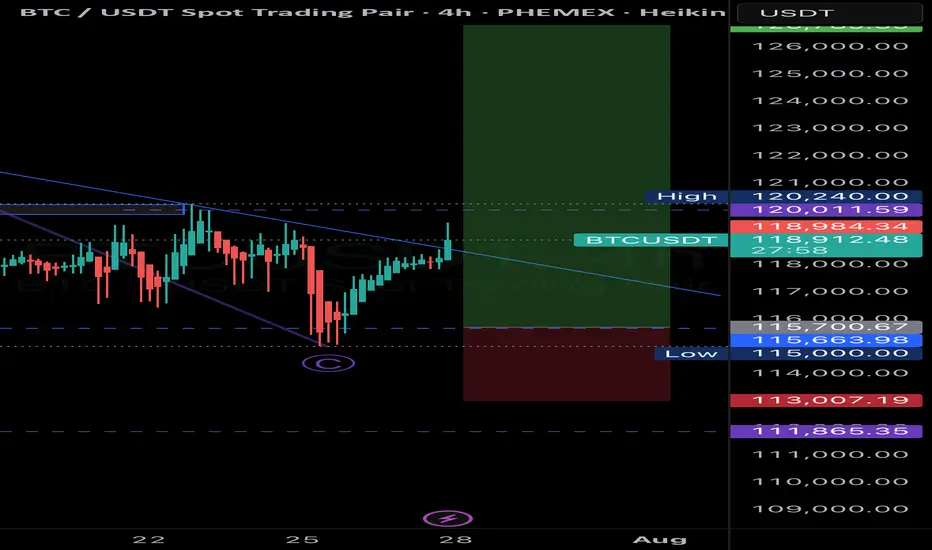
BTC setup projection🚨 BTCUSD Trade Setup – 5M Chart
📉 Entry Zone: 118,950–119,000
🎯 Target 1: 120,280
🎯 Target 2: 120,779
🎯 Final TP: 123,221
🛡️ SL Zone: Below 118,447
✅Confidence level 7.5/10
Bias: Bullish 📈 – anticipating a reversal from the demand zone with clean upside liquidity targets.
Stay patient, wait for confirmation before entry. Let the setup come to you.
As always, manage risk. Risk what you’re okay to lose. 💼

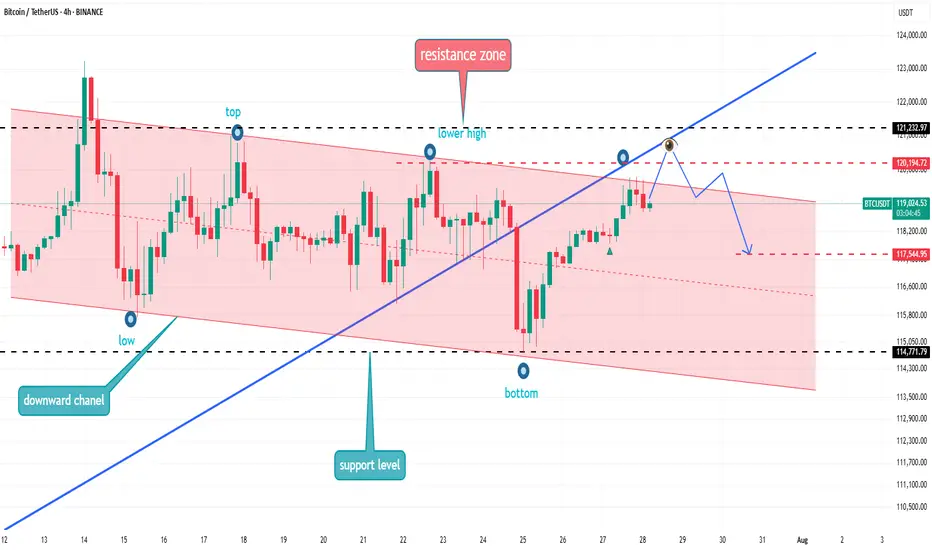
BTCUSDT Range-Bound Market: Short-Term Bearish MoveBTCUSDT
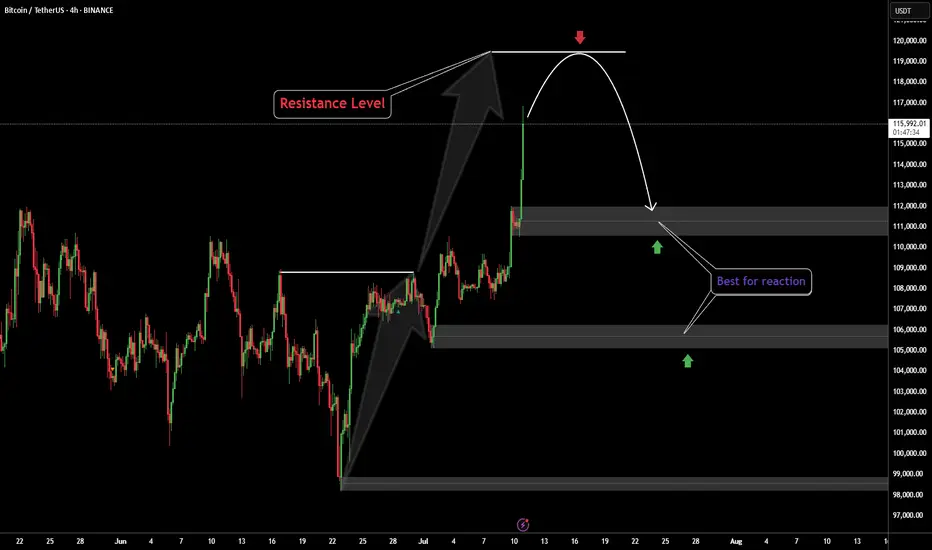
has failed to break through the descending resistance near 120,000 and is now forming a lower high within the broader resistance zone. The price action follows an impulsive leg up and is currently tracing a potential reversal pattern under key structural resistance. As long as the market remains capped below 120,000, continuation toward 117,500 is likely. The downward bias is supported by weakening momentum after the bull trap and resistance rejection.
📉 Key Levels
Sell trigger: Breakdown below 119,000
Sell zone: 119,400 – 120,000
Target: 117,500
Invalidation: Break and close above 120,500
ABC BTC LongCurrently in a Long position on btc, closed the short out in profit from previously posted short abc. Now in a great position from the start of the new ABC long as depicted on chart
BTC & ETH Structural Market Analysis🚀 Don’t forget to hit follow and smash the 🚀 button if you enjoy this analysis! 🚀
BTC & ETH Structural Market Analysis
⭕️Methodology:
• Dow Theory
• 1D: HWC
• 4H: MDC
• 1H: LWC
Market Outlook:
Yesterday's structural analysis remains valid for today, but let’s review the key levels again.
Today’s approach:
1️⃣ Wait for Total2 to react at 1.53 – if it breaks upward, we hold our positions.
2️⃣ Take profits quickly – if weakness is spotted in the trend, close positions without hesitation.
Note: There’s a chance of fake breakouts on long positions, but personally, I’m willing to take this risk. If TOTAL breaks its key resistance, we may see a strong rally.
Key Levels & Scenarios:
♦️ BTC ♦️
• Important levels: 115 and 120.
• A breakout of these levels will define bullish or bearish scenarios.
• Long trigger remains at 120.
♦️ BTC.D ♦️
• Bullish above 61.44 and 62.17 – bearish momentum in altcoins.
• Bearish below 60.83 and 60.42 – bullish rally in altcoins.
• If BTC dominance climbs, 62.74 is the limit where we stay bullish on BTC pairs. Beyond that, focus shifts fully to BTC itself.
• If BTC breaks 119,500 while dominance drops, it confirms holding or entering longs on altcoins.
♦️ TOTAL ♦️
• Still struggling with the 3.85 resistance level.
♦️ TOTAL2 ♦️
• Successfully broke 1.48, leading to the recent altcoin move.
• Next critical level: 1.55 – a breakout could trigger a strong altcoin rally.
♦️ USDT.D ♦️
• Breakdown of 4.22: keep positions open.
• Breakdown of 4.13: start of a new bullish trend in BTC & altcoins.
• Fake breakout around 4.13: expect range-bound movement between 4.13 – 4.37.
• If 4.37 breaks upward: expect corrections in BTC & altcoins.
♦️ ETH ♦️
• Weakness visible in ETH/USDT chart; candles are not giving strong signals.
• ADX oscillator suggests a sharp move is coming (direction TBD).
• If RSI climbs above 70 with current ADX conditions: expect a sharp bullish move.
🔥 If this analysis helps you, hit that follow & smash the 🚀 to support my updates! And share your comments 🔥

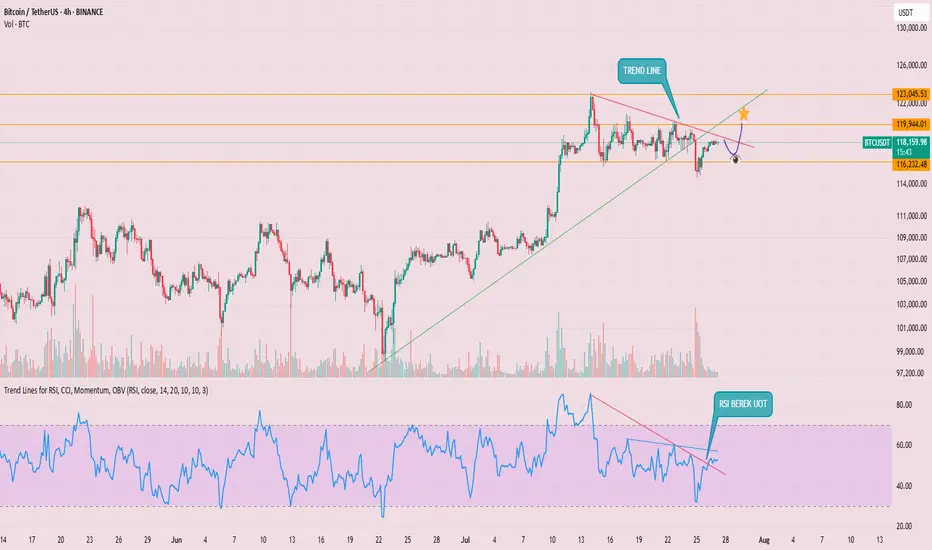
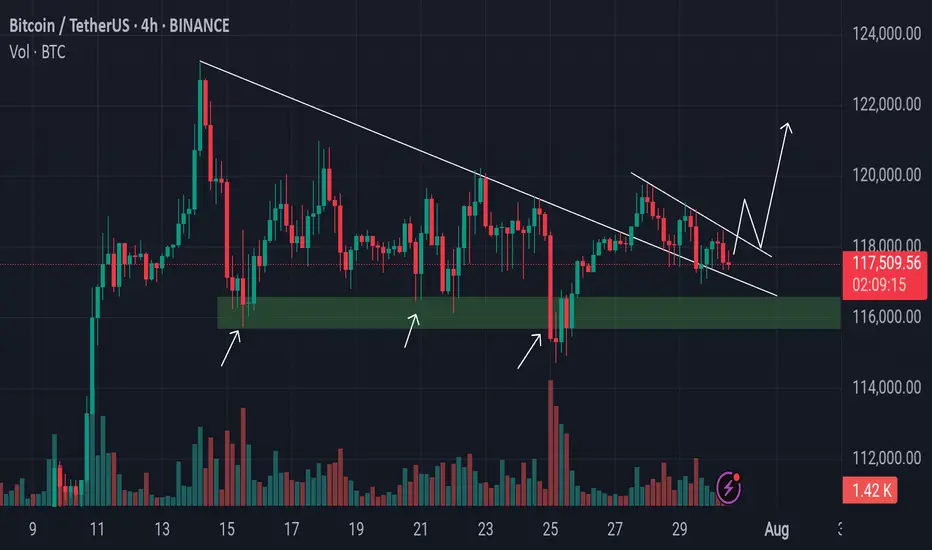
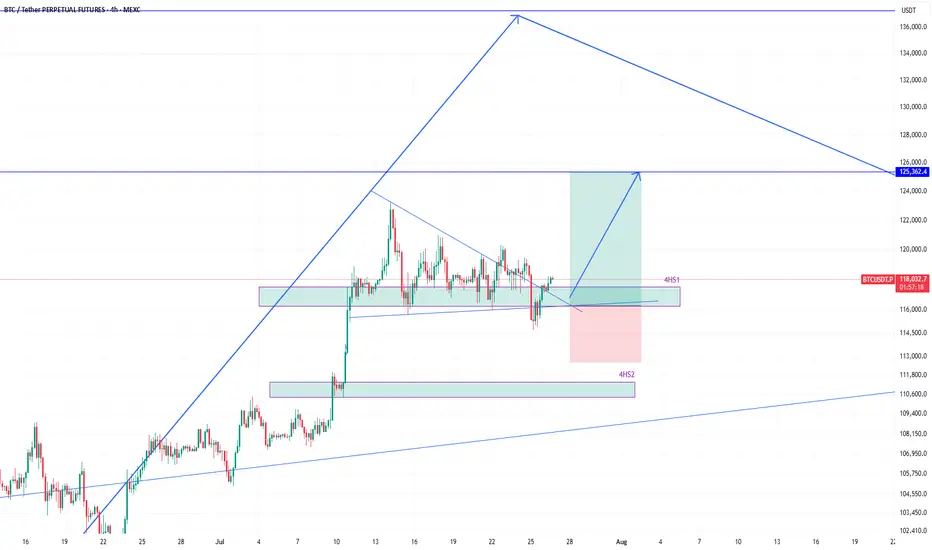
BTCUSDT eyeing 125k next after bounce from 116k zoneEarlier I shared the high time frame view of #BTCUSDT. We know that its heading higher and that helps in holding spot positions.
However, the move to the high frame target will not happen in a straight line, instead with various push to the upside and then subsequent corrections to the down side.
Therefore, as a trader, we must profit from those movements as we see some good high probability setups.
And there is one right now which is a long position.
The price broke 4h support 4HS1, but quickly reclaimed it. That is a sign of demand and strength required to move higher.
Therefore, this presents a long opportunity where the target of this long position should be 125k.
As the price enters into 4HS1 zone, I will scale into long position.
It is quite likely that the price will bounce hard once it taps into 4HS1 zone.
I am talking this long position targeting 125k. What about you? Share with me what you think.
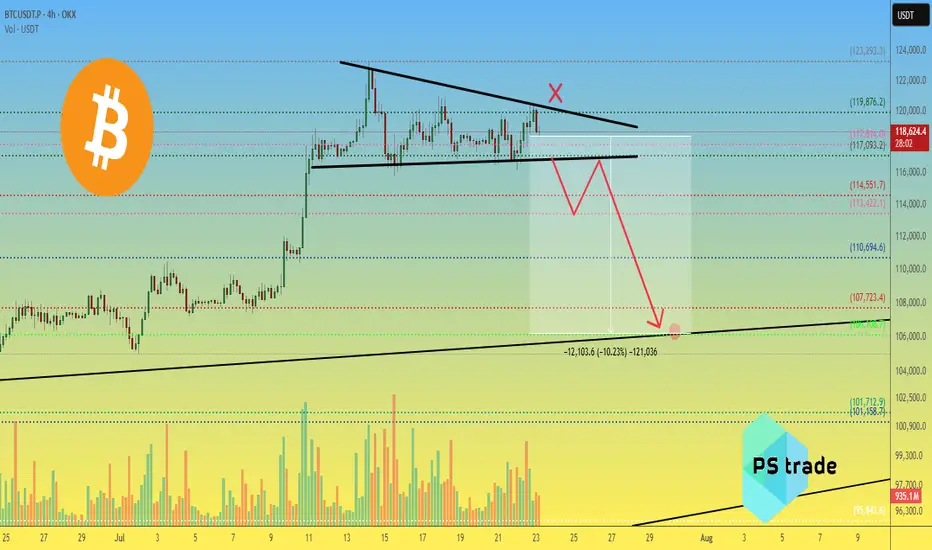
BTCusdt — Descending Triangle. Preparing for a BTC Breakdown?OKX:BTCUSDT chart (4H) shows a well-defined descending triangle.
Price is being compressed under a descending trendline, and volume is steadily declining — a typical signal of an upcoming strong move.
📉 Downside target: $106,100 – $101,700
🔺 Invalidation: breakout above $119,876
📊 Key levels:
Resistance: $117000 / $113,500
Support: $110,694 / $107,723 / $106,108 / $101,712
⚠️ Pay attention — breakout is likely soon.
_____________________
Did you like our analysis? Leave a comment, like, and follow to get more
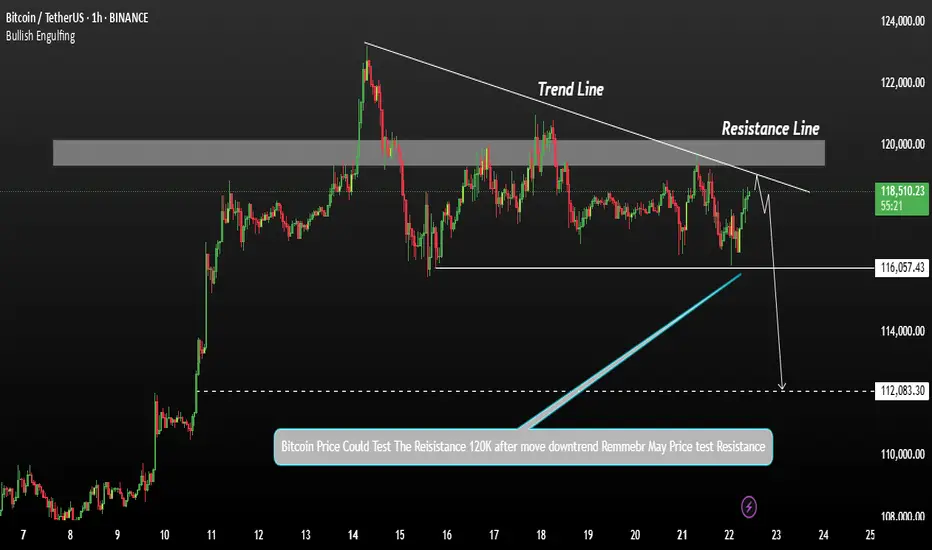
Bitcoin shows signs of a potential declineBitcoin's price shows signs of a potential decline after testing resistance levels. A correction at this stage is generally a healthy sign for the market, allowing for consolidation before any strong upward move.
Bitcoin may test the resistance line after the current decline. If the price falls below 118,000, there is interim support, but further downside may be expected. 116K and 112K A break below 112,000 could open the door for deeper bearish momentum.
You May find more details in the chart.
Trade wisely best of Luck.
Ps Support with like and comments for better analysis Thanks for Supporting.
BTC New Upodate (4H)This analysis is an update of the analysis you see in the "Related publications" section
We previously stated that Bitcoin lacks the strength to move upward, and we expect the price to soon reach the green zone (114K-112K).
The price is now dropping toward this zone, which is the rebuy area.
The process of reaching the green zone has been and still is somewhat time-consuming, and during this time, it may repeatedly mislead beginners.
For risk management, please don't forget stop loss and capital management
Comment if you have any questions
Thank You
#BTC Update #14 – Aug 02, 2025#BTC Update #14 – Aug 02, 2025
Unfortunately, Bitcoin has closed below its current channel and now appears to be retesting that level. If this retest confirms, I expect a pullback down to the $110,000 zone. However, if Bitcoin manages to re-enter the channel, its first target will be $118,800. Although it’s a descending channel, moving within it suggests a relatively stable market. Closing below it may not end well and could deepen the retracement. That's why I recommend caution with all coins right now.
Even though it seems like a distant possibility at the moment, don’t forget there’s also an imbalance zone around the $103,500 level. A sharp wick or a significant drop could bring Bitcoin back to revisit that area. The probability is currently low, but it can’t be ruled out completely. I don’t recommend rushing into any long or short positions at this stage.

2 Scenarios for BTCNow that the cup and handle formation has been reached and the correction finished, I think we have 1 more leg up.
It's also possible that we fall from here, but I think another fakeout upwards is likely as bearish divergence forms on the month, but isn't quite there yet (RSI needs 1 more higher high to confirm bearish divergence)
Either way, my short targets are the 0.618 fibs. I am expecting the typical -70-75% crash by 2027 before the next cycle begins

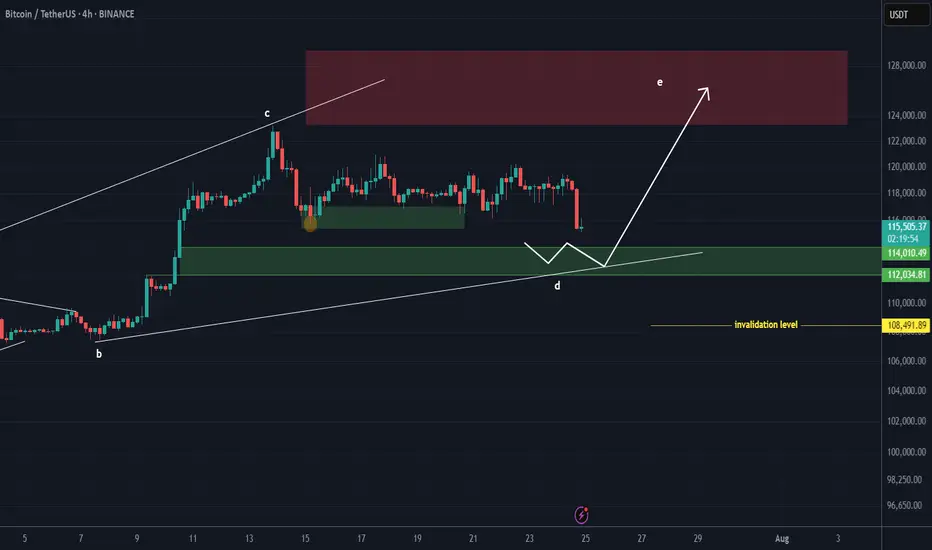
The Curtain Falls on the Script: Why I Believe It's Time to StopHello everyone, this is EC.
From late June through July, we experienced a full-fledged primary uptrend in crypto, driven by a weakening U.S. Dollar. From the script preview to the execution of the plan, every step has been clearly documented.
However, today, I want to share a different, more cautious perspective: I believe this script may be nearing its end.
I. Reviewing the Script and the "Bubble's" Manifestation
After our call on July 4th that the "main bull wave" was starting, the market perfectly delivered on our expectations. What was more interesting was the clear internal divergence we saw, which precisely confirms our thesis about the "bubble phase" from my June 20th article, "The Restlessness Before the Storm."
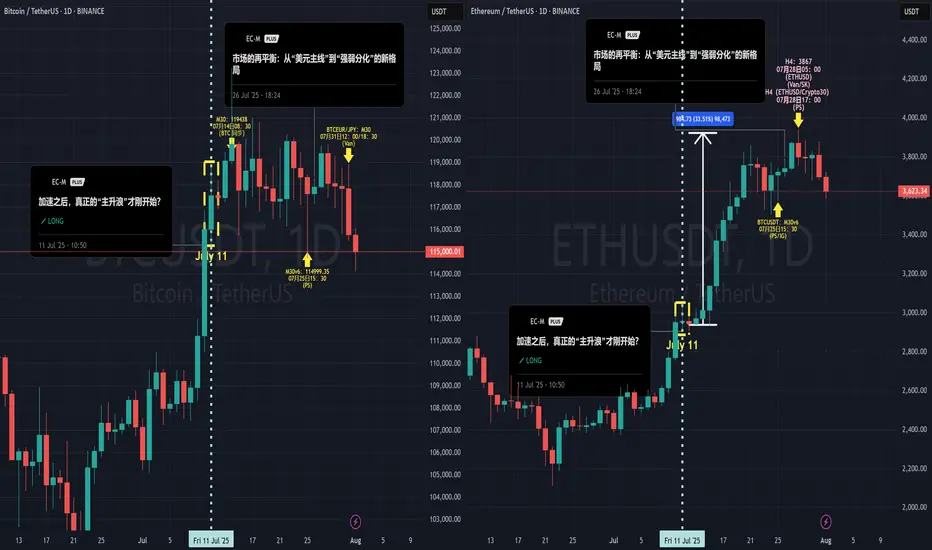
When the market's sentiment "balloon" is inflated to its limit, capital flows from the leader (BTC) to assets with higher elasticity (ETH).
The data shows that from July 11th until now, ETH took the baton and rallied approximately 35%, while BTC gained only around 6% in the same period. When BTC is already showing signs of fatigue while ETH is still in a solo rally, that in itself is a major signal that the bubble is nearing its end.
II. A Shift in the Winds: The Hand Inflating the Balloon is Loosening
I've chosen to end this script at this moment based on signal changes on two levels:
The "External Factor" Shift: The Potential Strengthening of the USD
As I pointed out in my July 28th analysis, "The Market's Rebalancing," the market has entered a phase of "strength-weakness divergence." This trend is now becoming more evident: the U.S. Dollar, cushioned by the extreme weakness of currencies like the Japanese Yen, has begun to show signs of a broad strengthening. Concurrently, U.S. and European stock markets are pulling back in sync, and global risk appetite is cooling.
The external environment that fueled the bubble (a weak USD) is beginning to falter.
The "Internal Factor" Signal: The Needle Point Inside the Balloon
The crypto market itself is also showing warning signs of resistance (see attached ETH daily chart). When the leading asset, ETH, begins to show signs of stagnation and distribution at its highs, it's like the balloon meeting the needle point. The exhaustion of internal momentum is a more direct warning than changes in the external environment.
III. Conclusion: Don't Be Greedy for the Last Dessert
When the core logic driving the rally (a weak USD) begins to waver, and the market simultaneously shows internal signs of exhaustion, my choice is to end this script and take profits off the table.
This doesn't mean I think crypto will crash immediately. But "no longer suitable to hold" implies that, in my view, the risk/reward ratio at the current level is no longer attractive. A grand feast is coming to an end, and being greedy for the last dessert is not a wise move. Shifting from "buying the dip" to "cautious observation" is the rational choice.
Thank you for your attention and for following along this past month.
#Crypto #BTC #ETH #TradingView #MarketAnalysis #RiskManagement
Bitcoin Go 135000Bitcoin has not yet reached the channel ceiling and should bounce back after the resistance.
BTC, ETH & Indexes daily analyze 🚀🔥 BTC, ETH & Indexes daily🔥🚀
💎 Daily Market Routine, Structure-Based Crypto Analysis & Watchlist Insights
💥 Like – Follow – Comment to keep this momentum alive!
👋 Hey everyone! Welcome to our daily crypto trading routine:
📅 Daily:
🔹 BTC & ETH analysis
🔹 Full market structure review (TOTAL, BTC.D, USDT.D…)
📅 Weekly (Every Sunday):
🔸 Top 10 Altcoins Analysis (excluding BTC & ETH)
🔸 🆕 Coming soon: Weekly Watchlist Picks!
💛 Your likes, follows, and comments give me the motivation to continue this journey and share deeper insights!
🟡 Methodology
💠 Long-Term Cycle (HWC): 1D timeframe
💠 Mid-Term Cycle (MWC): 4H timeframe
💠 Short-Term Cycle (LWC): 1H timeframe
💠 Market structure review:
TOTAL / TOTAL2 / TOTAL3 / BTC.D / USDT.D
💠 Technical approach: Dow Theory
💠 Fundamental events + news tracking
🔥 Today Could Be the Most Important Day of the Week!
📢 The Fed’s interest rate decision is expected today. Market consensus leans toward no change, but Powell’s press conference could trigger major volatility.
📈 If BTC starts a bullish trend in the coming days, ETH, BNB, and AVAX are likely to outperform – and this probability is high.
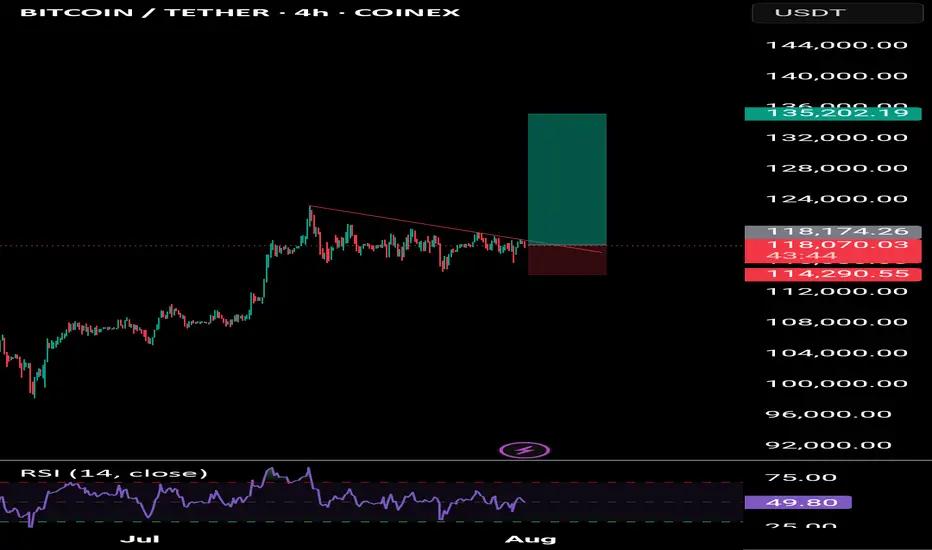
♦️ BTC/USDT – Market Still Ranging
💎 Bulls have failed to break above 120,000, but bears also haven't broken below the critical 115,000 zone.
📊 This two-week range is not surprising – it's likely a time correction, consolidation, or even distribution phase.
🚀 If 120K breaks with strong momentum and volume, price may rally to 123K → 135K → 150K.
❗ If 115K breaks, expect a drop to 110K → 100K.
⭕ Breakouts need strong candles and volume – otherwise expect fakeouts.
🟡 My strategy doesn't allow shorts at this phase. I only seek bullish confirmation – though bearish signs like buying exhaustion and profit-taking near 118K exist.
📌 I’ll re-enter long on breakout above 120K, using buy stops and proper risk control. Even if it hits my stop-loss later, I’m okay with that.
🔥 BTC must break 120K to unlock full altcoin rally potential.
♦️ BTC.D – Decision Time Nears
📉 Recent downtrend shows weakness, but not a bullish reversal yet.
🔸 Watch levels:
• 🟢 Break below 60.42 → Confirmed altcoin rally
• 🔴 Break above 62.17 → Likely altcoin crash
♦️ USDT.D – Position Before the Break!
🟡 We must take altcoin & BTC positions before USDT.D breaks 4.13.
⏳ A break there likely triggers a sharp upward move in alts.
• 🔹 Pullback to 4.64 = still bullish for alts
• 🔹 Current key zones:
• 4.44: Not tested yet
• 4.13: Likely to be retested
♦️ TOTAL Market Cap
💎 Break above 3.91T → Bullish confirmation – be in the market!
♦️ TOTAL2 (Altcoin Market Cap)
🟡 Major resistance ahead: 1.54T
♦️ TOTAL3 (Altcoin Market w/o BTC & ETH)
🟡 Important level: 1.08T
♦️ ETH/USDT – Institutions Are Accumulating!
💼 Institutional buying continues – a strong bullish signal.
💎 Buyers are trying to flip 3750 into support. Heavy order blocks detected.
📌 Key Level: 3900
• 🔹 Break & hold above = Easy ride toward 4000+
• 🔻 Bearish view: Break below 3750 = Drop to 3500–3600
🟡 Recent demand spike and fresh capital inflow = bullish sentiment
♦️ Strategic Outlook
1️⃣ Still focused on long setups
2️⃣ If BTC breaks 120K and ETH breaks 4K then ranges → and BTC.D drops = 🎉 Altcoin Party!
3️⃣ If BTC fails to break 120.3K, we won’t get a strong rally
4️⃣ If BTC keeps ranging and BTC.D keeps dropping → alts will gain, but not full bull run yet
💬 Drop your thoughts in the comments below!
🚀 Smash that ROCKET, hit LIKE, and don’t forget to FOLLOW for daily setups!
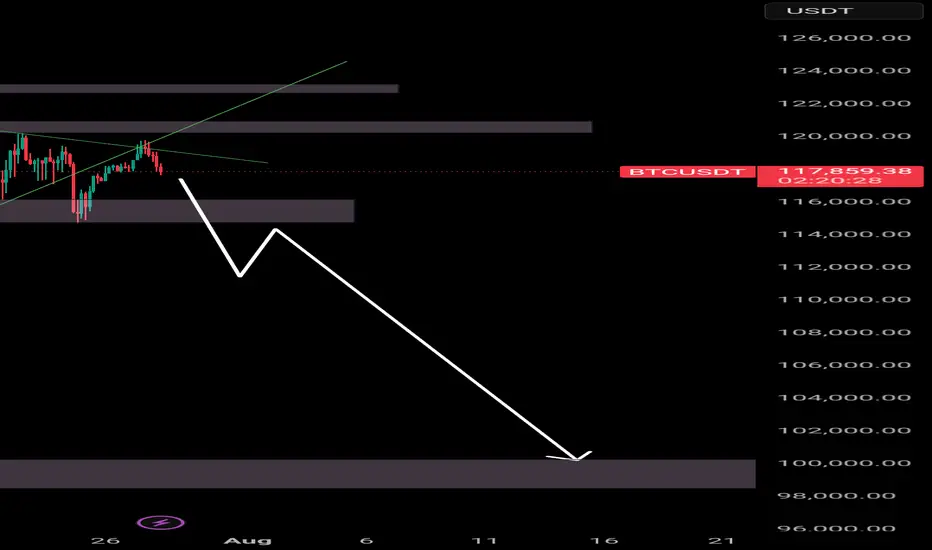
Btc is fallingHello, considering the breakdown of the upward trend line and the pullback to the downward trend line that I drew, the price will most likely fall to the specified support level and we will enter a resistance phase.