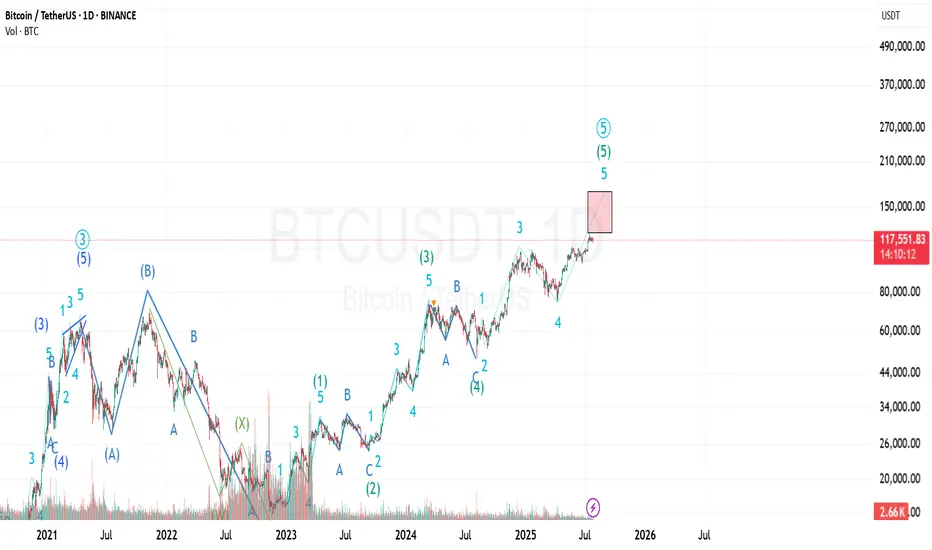
Bitcoin Prediction UpdateI've just modified the wave count and still the previous analysis is valid...
I'm not sure about the target of the last wave (the 5th of 5th wave) because it can be an extended wave...
The shown box is where I'll investigate to find any ending pattern...
BTCUSDT trade ideas
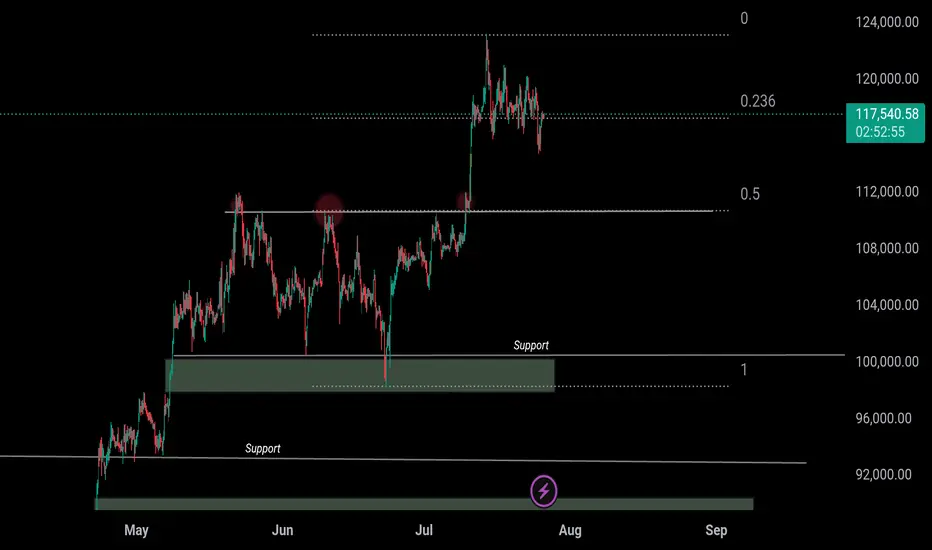
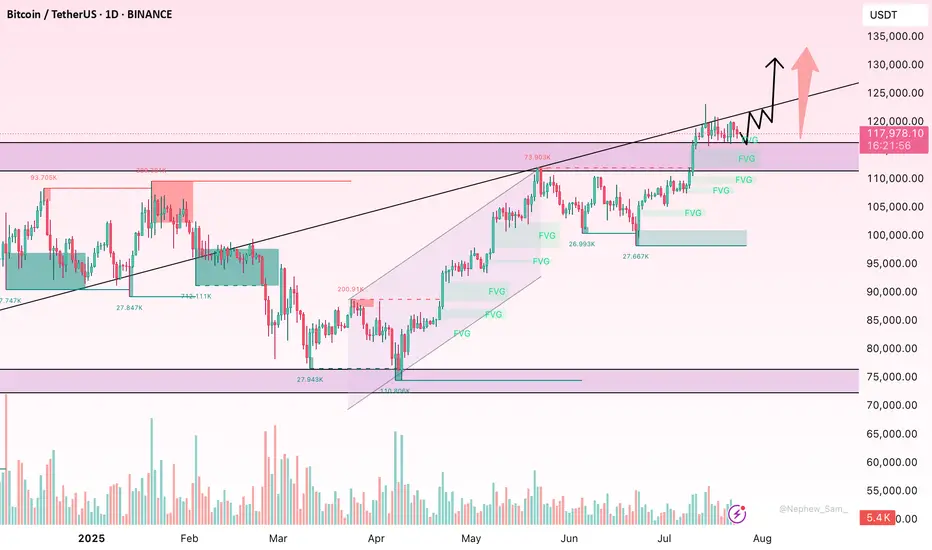
BTC 110k or 150k ??𝗪𝗶𝗹𝗹 CRYPTOCAP:BTC 𝗕𝗼𝘂𝗻𝗰𝗲 𝗮𝘁 $𝟭𝟭𝟬𝗞 𝗼𝗿 𝗖𝗿𝗮𝘀𝗵 𝗕𝗲𝗹𝗼𝘄 $𝟭𝟬𝟬𝗞? ‼️‼️
Breakout rallied from $110,500 → $123,293
Now pulling back toward 0.5 Fib retracement $110K
Retest Scenario:
– Hold above $110K = Bullish continuation toward $150K ATH
– Breakdown below $110K = Risk of deeper correction below $100K
Drop your thoughts below — bounce or breakdown?
CRYPTOCAP:BTC
Btcusd outlook
Price tapped into our area and showed strong reaction.
Now watching how it behaves around 118.4k and 120.7k.
If bulls stay in control, 122k could be next.
Let’s see how it unfolds. 🔍📈

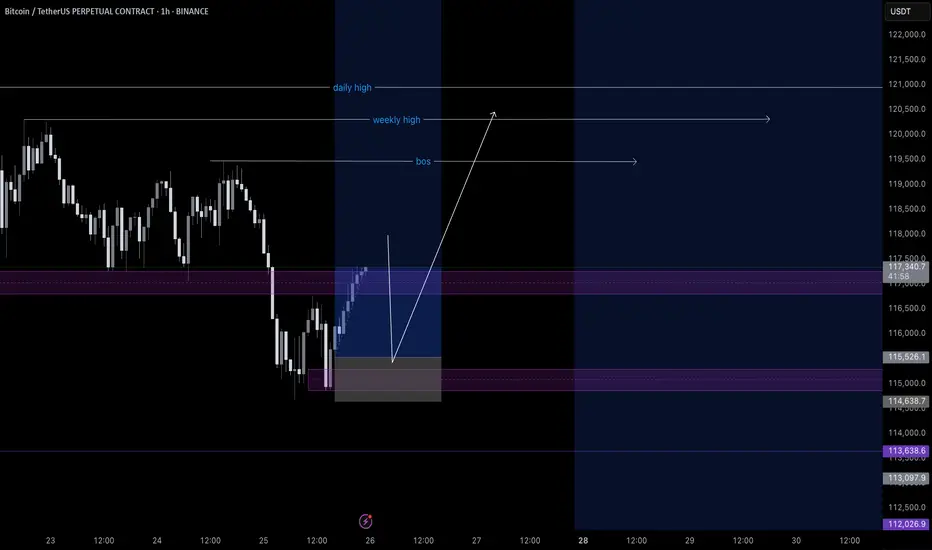
Bitcoin AnalysisWe have an order block in 1Hour TF, price can retest this before bullish continuation. If it breaks below bearish momentum continues.
TradeCityPro | Bitcoin Daily Analysis #133👋 Welcome to TradeCity Pro!
Let's dive into the Bitcoin analysis and key crypto indexes. As usual, in this analysis, I’m going to review the triggers for the New York futures session.
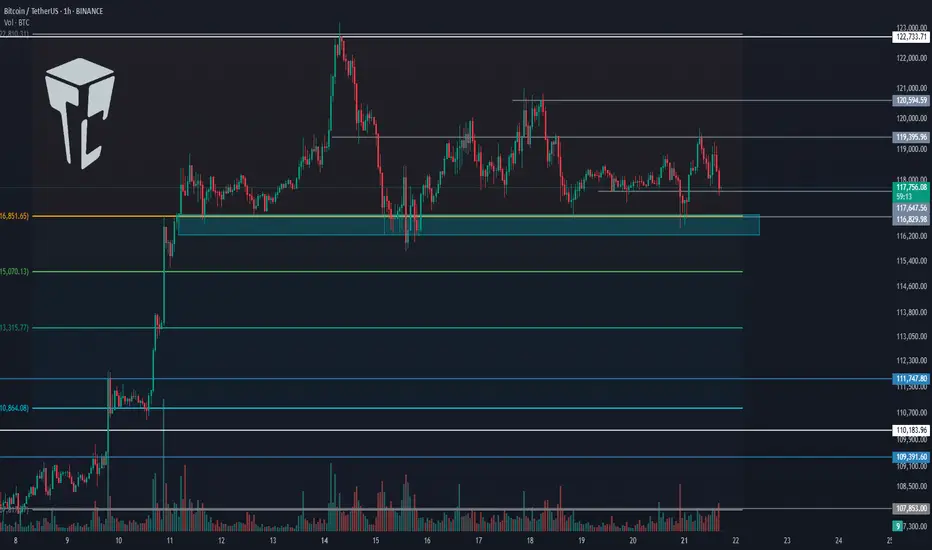
⏳ 1-Hour timeframe
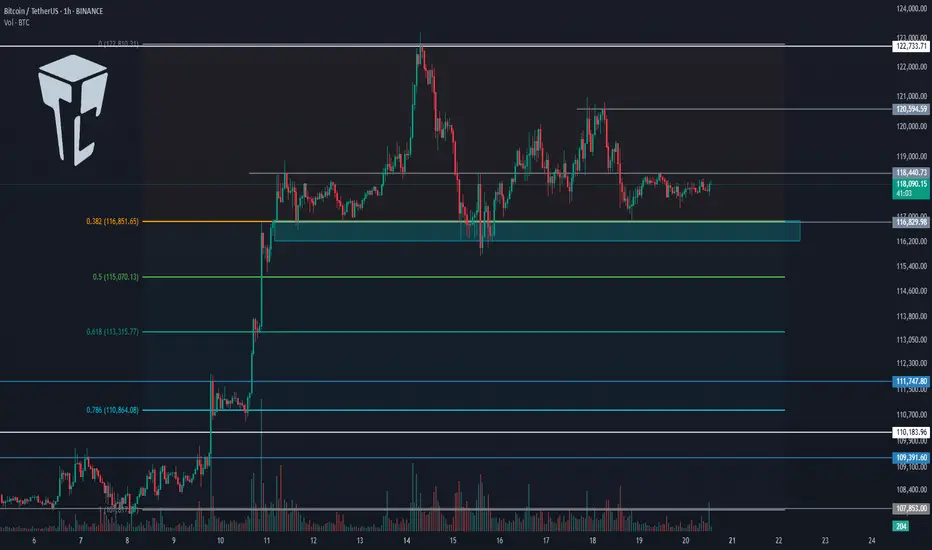
On the 1-hour timeframe, Bitcoin has once again dropped to the support area at 116829 and reacted to it. Currently, it is fluctuating above this level.
✨ If 119395 is broken, the price could move toward the highs at 120594 and 122733.
📈 So for a long position, we can enter on the breakout of 119395. Pay attention to Bitcoin dominance, because if it’s in a downtrend, Bitcoin setups might not be ideal, and altcoins may offer better opportunities.
✔️ If the price stabilizes below 117647, it will enter the box between 116829 and 117647, and this time the likelihood of breaking the 116829 bottom and heading toward lower supports for deeper corrections becomes very high.
👑 BTC.D Analysis
Now let’s look at Bitcoin Dominance. BTC.D is still falling and after breaking the 61.45 level, it has reached 60.46.
⭐ If this level breaks, the next bearish leg may begin. The trend is strongly bearish with no visible weakness, and we’ll have to see how long this continues.
📅 Total2 Analysis
Let’s move to Total2. This index has broken the 1.5 resistance and is moving toward 1.62.
💫 At the moment, I don’t have a trigger for it, and we need to wait until its structure gives us the next setup.
📅 USDT.D Analysis
Now let’s look at Tether Dominance. This index has stabilized below the 4.22 level and is now moving downward after a pullback to this area.
🧩 The next support is at 4.08, and the index has room to fall to that level. I still see the USDT Dominance trend as bearish for now.
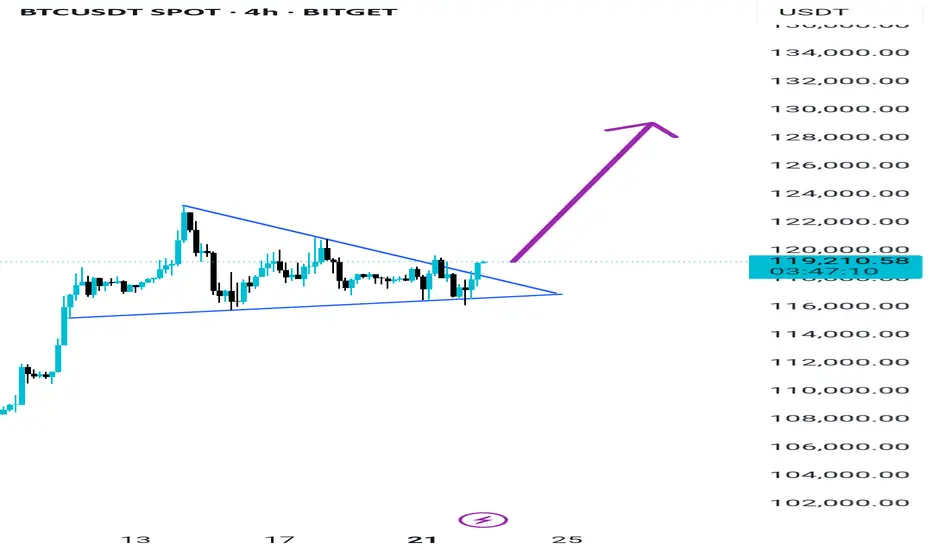
$BTC Bullish falling wedge pattern (Daily TF)Bitcoin forms a falling wedge pattern on the daily time frame. This pattern is a continuation pattern with the target around $128,000.
$128K SOON

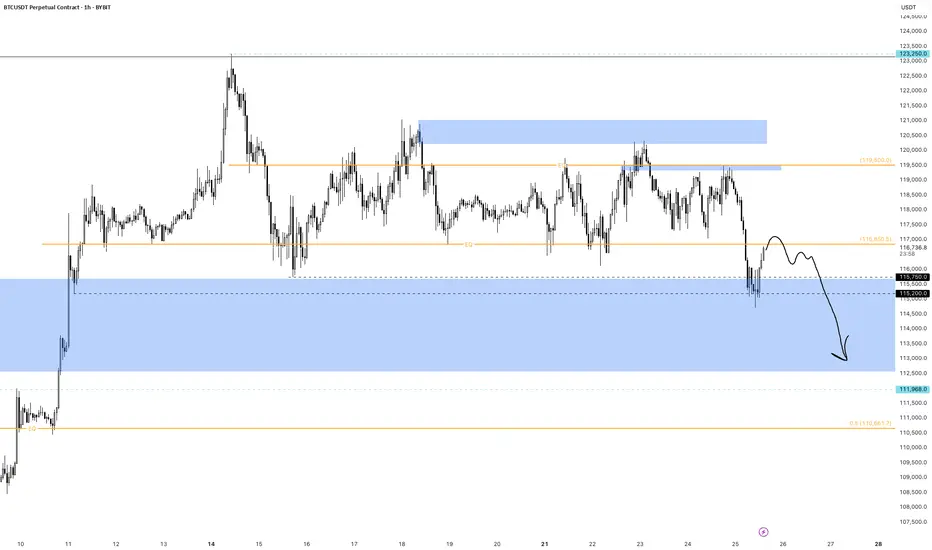
Bearish retest or deviation for Bitcoin117000 is key. it’ll decide whether this is a bearish retest or just a deviation. i believe it’s a bearish retest and we’re setting up for 110-114 next.
last drop came when price kept failing to hold above EQ. now we’re below the EQ of the ath/previous ath range. if price can’t reclaim that either, a deeper drop is likely. a 12h close above EQ could open the path toward 120-121k, but that’s the less probable case in my view.
why? nasdaq and spx are in premium zones (fib extensions), and holidays are near for big players. as profit taking hits there, pressure will echo here. simple cause, predictable effect.
127k after small fall to 112k . buy altcoins in 112k
Hello. Wait for a small correction to the 112k range. There is still wave 5 left to end this bullish move, which I think will make a new record in the 127k range.

BTC AI Prediction Dashboard - 6h Price Path (23.07.25)
Prediction made using Crypticorn AI Prediction Dashboard
Link in bio
BTCUSDT Forecast:
Crypticorn AI Prediction Dashboard Projects 6h Price Path (Forward-Only)
Forecast timestamp: ~11:15 UTC
Timeframe: 15m
Prediction horizon: 6 hours
Model output:
Central estimate (blue line): -118,153
Represents the AI’s best estimate of BTC’s near-term price direction.
80% confidence band (light blue): 117,892 – 118,573
The light blue zone marks the 80% confidence range — the most likely area for price to close
40% confidence band (dark blue): 117,390 – 119,187
The dark blue zone shows the narrower 40% confidence range, where price is expected to stay with higher concentration
Volume on signal bar: 85.84
This chart shows a short-term Bitcoin price forecast using AI-generated confidence zones.
Candlesticks reflect actual BTC/USDT price action in 15-minute intervals.
This helps visualize expected volatility and potential price zones in the short term.

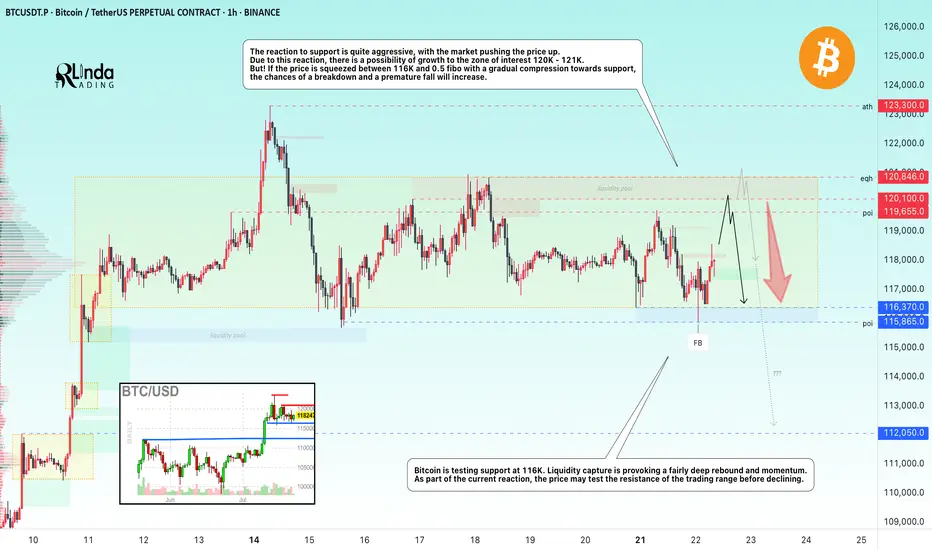
BITCOIN → Consolidation and compression to 116K. Correction?BINANCE:BTCUSDT.P continues to consolidate, with the price testing support at 116K, leaving behind the zone of interest at 120K-121K. Are there any chances for further growth?
(Alternative scenario (if growth to 120K does not occur))
Fundamentally, there is nothing particularly new, and the hype surrounding Bitcoin is stagnating. Technically, on D1, consolidation is underway with pressure from bears against the backdrop of an outflow of funds into altcoins. However, the dominance index is starting to rise, which could trigger some correction in the market. The price on the working timeframe, without updating local highs, is testing lows, and the latest retest of the liquidity zone is provoking a fairly aggressive reaction that could bring the price to retest the zone of interest at 120K-121K.
But! If the price is squeezed between 116K and 0.5 Fib with a gradual squeeze towards support, the chances of a breakdown and a premature fall will increase.
Support levels: 116370, 115860
Resistance levels: 119650, 120100
Technically, the market needs a breather or correction, which is generally a sign of health. The nuance with Bitcoin is that below 115860 there is no support until 112K, and if the market breaks the current consolidation boundary, the further correction could be quite deep. In the current situation, I do not yet see any drivers or reasons for another rally.
Best regards, R. Linda!
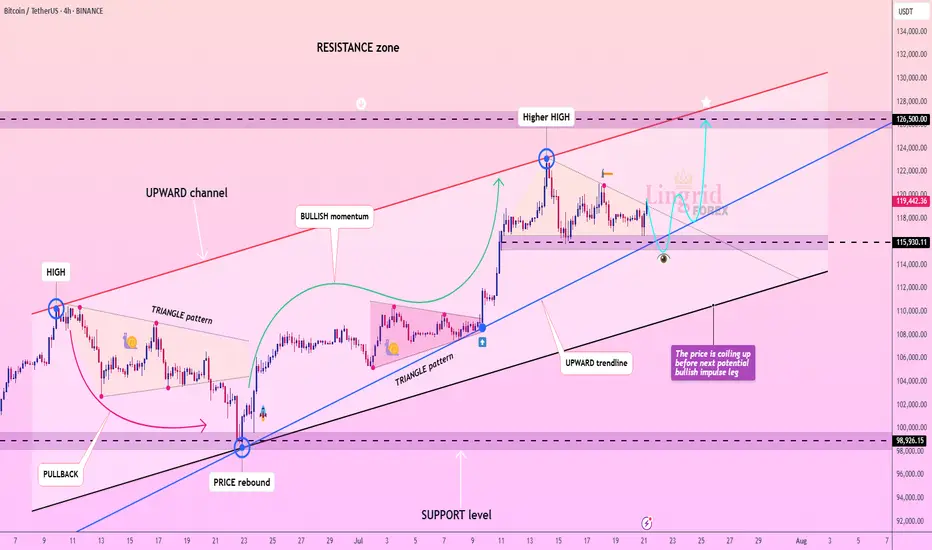
Lingrid | BTCUSDT Consolidation Expansion ScenarioBINANCE:BTCUSDT is coiling within a bullish continuation zone after rebounding strongly from the 115,930 support and holding above the blue ascending trendline. Price formed a higher high inside the rising channel, followed by sideways consolidation, suggesting preparation for another bullish leg. The triangle pattern breakout and price stability above the trendline favor upward continuation toward the resistance at 126,500. Momentum remains intact while the structure supports the next breakout push.
📉 Key Levels
Buy trigger: Break and hold above 120,000
Buy zone: 117,500–118,200
Target: 126,500
Invalidation: Close below 115,930
💡 Risks
Loss of support at the trendline
Strong rejection near red channel resistance
Weak market sentiment or macro news shocks
If this idea resonates with you or you have your own opinion, traders, hit the comments. I’m excited to read your thoughts!
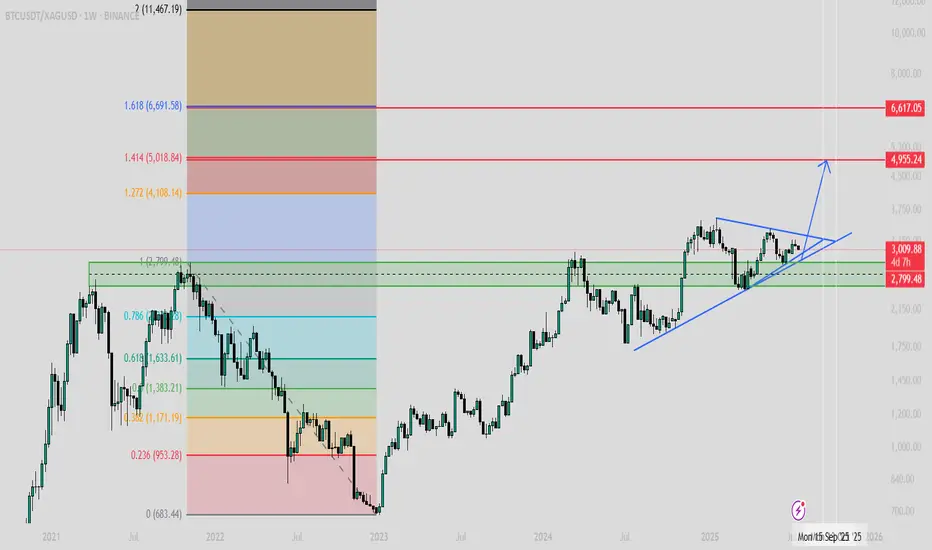
$BTCXAG - BITCOIN TO SILVER - BULLMARKET IS NOT OVER!I bet you haven't seen this chart anywhere! The Bitcoin to Silver chart is preparing for another explosion!
And yes, BULLMARKET IS NOT OVER!
BTC Consolidates Below Key Resistance – Is a Breakout Imminent?Bitcoin is currently consolidating beneath the major psychological resistance near $120,000. The medium-term trend remains bullish, supported by a series of higher highs and higher lows. However, recent candlesticks with long upper wicks reflect hesitation among buyers at elevated levels, pointing to potential exhaustion in short-term momentum.
Despite this, there are no clear signs of bearish divergence or strong reversal patterns. The sideways range between $112,000–$120,000 likely represents a healthy consolidation phase after a strong rally. If the price maintains support around $113,000 and breaks above $120,000 with convincing volume, the next leg higher could follow swiftly.
For now, buyers remain in control, provided BTC holds key structural supports. A breakout confirmation is crucial for bullish continuation.
"BTCUSDT Bearish Reversal: FVG Breakout & Sell Target Zone AnalyThis BTCUSDT 1D chart highlights a Bearish Market Structure, showing a Break of Structure (BOS) followed by a Fair Value Gap (FVG) and Breakout. A Support Level within the Demand Zone was tested, and the price is projected to fall toward the Sell Target Zone near 99,581 USDT.

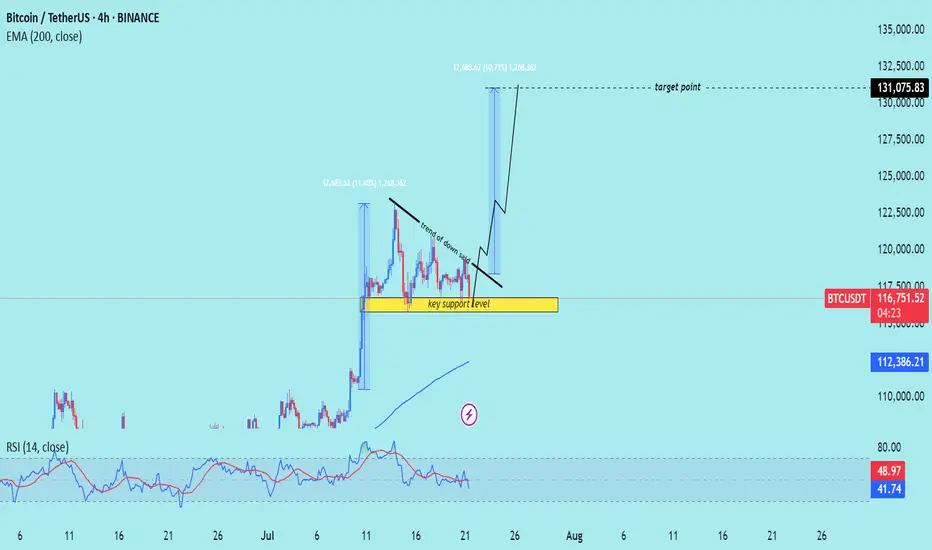
BTC/USD) Bullish trend analysis Read The captionSMC Trading point update
Technical analysis of Bitcoin (BTC/USDT) on the 4-hour timeframe, indicating a potential upward continuation after a period of consolidation above a key support level.
---
Analysis Summary
Pair: BTC/USDT
Timeframe: 4H
Current Price: 116,810.90
Bias: Bullish breakout continuation
---
Key Technical Insights
1. Key Support Zone:
The yellow box marks a strong support level, where price has bounced multiple times.
Acts as a launchpad for the next move higher.
2. Descending Trendline:
A trend of lower highs suggests short-term selling pressure.
Break above this trendline would signal a bullish breakout.
3. Projected Move:
If the breakout occurs, the projected target is around 131,075.83, representing a ~12% gain.
Similar move structure as the previous breakout earlier this month.
4. EMA 200 (Supportive):
Price remains above the 200 EMA at 112,386.80, affirming bullish trend bias.
5. RSI (14):
RSI hovering around 42–49, slightly oversold area, suggesting upside potential remains.
---
Target Point
Target: 131,075.83 USDT
Stop-Loss Suggestion: Below key support zone (~114,000)
---
Trade Idea
Direction Entry Stop-Loss Target
Buy Break above 118,000 Below 114,000 131,000–132,000
Mr SMC Trading point
---
Summary
Bitcoin is consolidating above a strong support zone and under a descending trendline. A confirmed breakout from this pattern could lead to a bullish rally toward 131,000+.
-
Please support boost 🚀 this analysis)
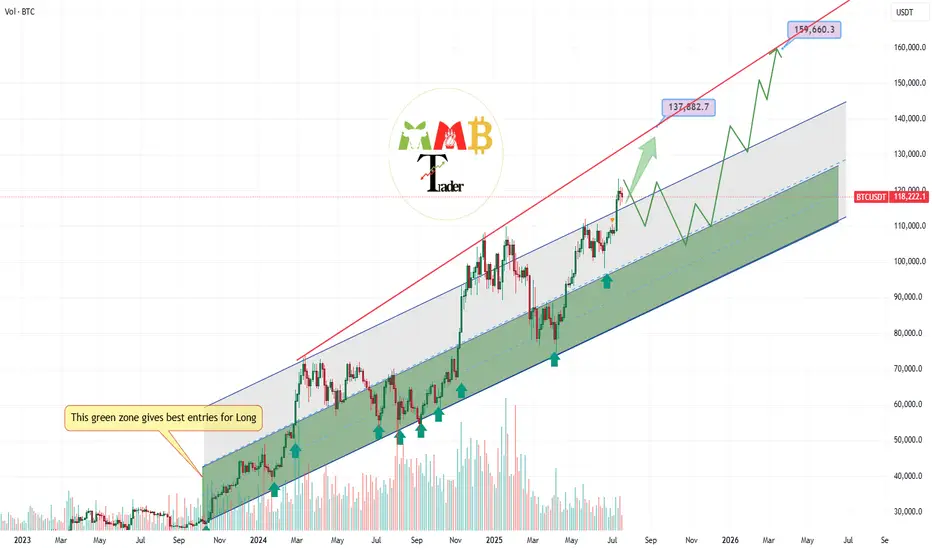
Bitcoin first target and short-term pump at least to 137K$ aheadAs we can see stop and next range zone for price can be near 135K$ to 137K$ and also major support zones now are 115K$ and 105K$ that can pump price once again if they touch.
Red trendline was strong resistance and it usually stop the pump and it is daily high detector now unless it breaks this time.
DISCLAIMER: ((trade based on your own decision))
<<press like👍 if you enjoy💚
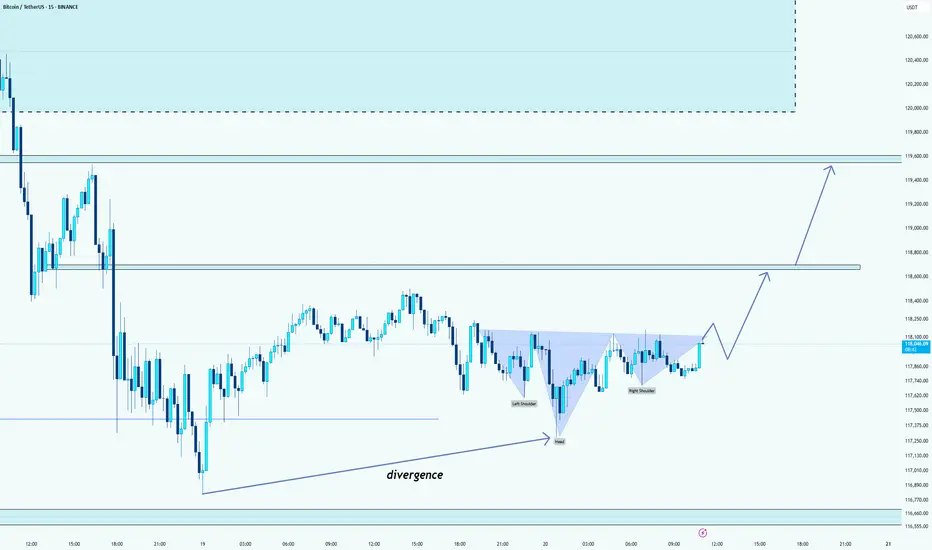
BTC: a Head and shoulders patternHello guys!
As you can see, a Head and shoulders and a divergence formed!
We can expect the price to rise until those two levels that I pointed out!
If the neckline breakout gets a long in retracements!
Are you Ready for Next Leg Up BTC Breakout is done on 4H wait for retest and you can take long after confirmation
TP 128K 130K For now
BTC BITCOIN THE BTC 135K ZONE ON the ascending trend line will like happen ,as the structure never lies.
at the moment am looking at a retest into 124k and we either get a double top structure to sell on rejection or we keep buying into 135k and sell from the supply roof of the ascending bullish trendline .
trading is 100% probability ,trade with caution.
ANY KEY LEVEL CAN FAIL .

BTC AI Prediction Dashboard - 6h Price Path (22.07.25)
Prediction made using Crypticorn AI Prediction Dashboard
Link in bio
BTCUSDT Forecast:
Crypticorn AI Prediction Dashboard Projects 6h Price Path (Forward-Only)
Forecast timestamp: ~10:15 UTC
Timeframe: 15m
Prediction horizon: 6 hours
Model output:
Central estimate (blue line): -118,624
Represents the AI’s best estimate of BTC’s near-term price direction.
80% confidence band (light blue): 118,260 – 118,867
The light blue zone marks the 80% confidence range — the most likely area for price to close
40% confidence band (dark blue): 117,702 – 119,570
The dark blue zone shows the narrower 40% confidence range, where price is expected to stay with higher concentration
Volume on signal bar: 120.84
This chart shows a short-term Bitcoin price forecast using AI-generated confidence zones.
Candlesticks reflect actual BTC/USDT price action in 15-minute intervals.
This helps visualize expected volatility and potential price zones in the short term.

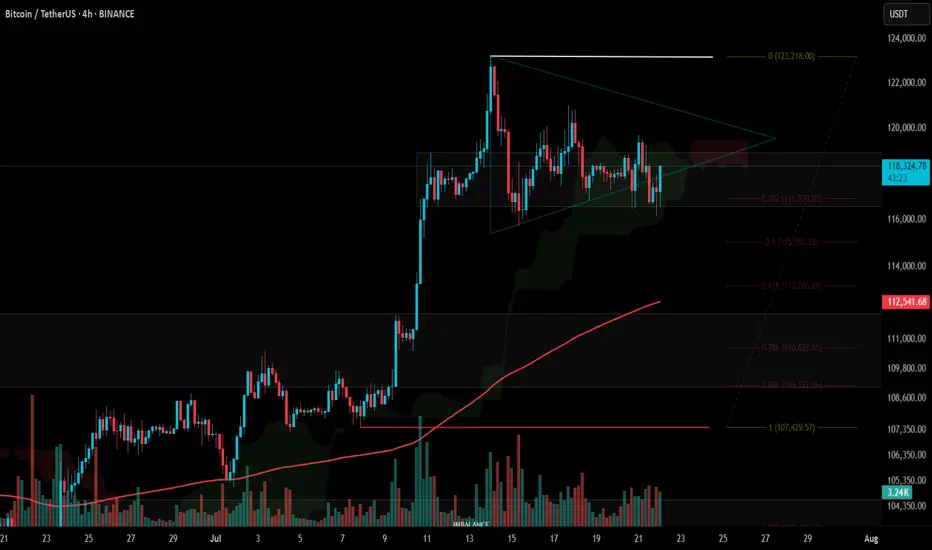
#BTC Update #9 – July 22, 2025#BTC Update #9 – July 22, 2025
As previously noted, Bitcoin is currently trading within both a horizontal range (box) and a tightening triangle formation. Although there was a drop last night, price didn’t pierce the lower boundary of the box and is now showing an upward reaction.
As long as BTC holds above this box, there’s no major risk. Bitcoin has already completed the 0.382 Fibonacci retracement from its previous impulsive move. If that correction is sufficient, the next upside target is $127,900.
However, one key point to watch: Bitcoin failed to break its previous high in its last three attempts — a clear sign of price compression and market indecision.
📌 No need to rush into Long or Short positions. It’s best to wait for a confirmed breakout before acting, as premature entries could carry elevated risk.
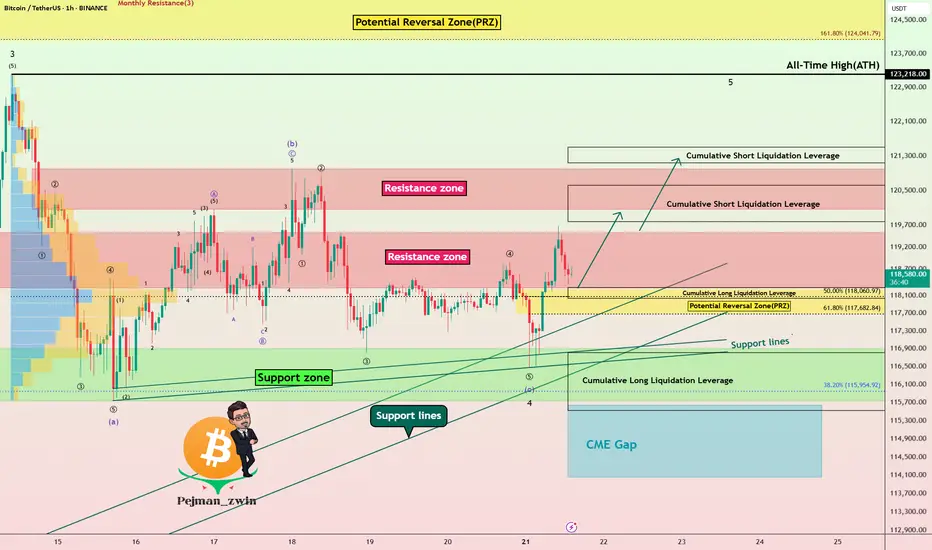
Bitcoin Technical Setup: Support Holds, Wave 5 in FocusBitcoin ( BINANCE:BTCUSDT ) filled the CME Gap($117,255-$116,675) and started to rise, as I expected in my previous idea .
Bitcoin is currently trying to break the Resistance zone($119,530-$118,270) . In the last week's movement, the price of $118,000 can be considered as one of the most important numbers for Bitcoin , with a lot of trading volume around this price.
In terms of Elliott Wave theory , it seems that Bitcoin has managed to complete the main wave 4 near the Support zone($116,900-$115,730) and Support lines . The structure of the main wave 4 is a Zigzag Correction(ABC/5-3-5) (so far). There is a possibility that the 5th wave will be a truncated wave because the momentum of the main wave 3 is high and Bitcoin may NOT create a new ATH and the main wave 5 will complete below the main wave 3.
I expect Bitcoin to start rising near the Potential Reversal Zone(PRZ) and Cumulative Long Liquidation Leverage($118,277-$118,033) , break the Resistance zone($119,530-$118,270) and reach the targets I have marked on the chart.
Note: Stop Loss(SL)= $116,960
CME Gap: $115,060-$114,947
Cumulative Short Liquidation Leverage: $121,502-$121,134
Cumulative Short Liquidation Leverage: $120,612-$119,783
Cumulative Long Liquidation Leverage: $116,810-$115,522
Do you think Bitcoin can create a new ATH again?
Please respect each other's ideas and express them politely if you agree or disagree.
Bitcoin Analyze (BTCUSDT), 1-hour time frame.
Be sure to follow the updated ideas.
Do not forget to put a Stop loss for your positions (For every position you want to open).
Please follow your strategy and updates; this is just my Idea, and I will gladly see your ideas in this post.
Please do not forget the ✅' like '✅ button 🙏😊 & Share it with your friends; thanks, and Trade safe.
TradeCityPro | Bitcoin Daily Analysis #132👋 Welcome to TradeCity Pro!
Let’s dive into the Bitcoin analysis and key crypto indices. As usual, in this analysis I’ll review the futures triggers for the New York session.
📅 1-Hour timeframe
On the 1-Hour timeframe, as you can see, Bitcoin is still holding the key support at 116829 and has been ranging between 116829 and 118440 since yesterday.
✨ Today, if the 118440 level breaks, we can open a solid long position. However, I still believe that due to Bitcoin Dominance being in a downtrend, altcoins are a much better choice for opening positions.
✔️ If you're only planning to trade Bitcoin, this trigger is suitable. The next entry points would be 120594 and 122733. If we open positions at all three triggers and the market moves upward, we can get strong risk-to-reward setups since we’ve entered with significant volume across three positions.
📊 If the 116829 level breaks downward, we might see sharper corrections. In that case, the next supports will be the 0.5 and 0.618 Fibonacci levels.
👑 BTC.D Analysis
Looking at Bitcoin Dominance, as you can see, the trend is heavily bearish and moving downward.
⭐ The downtrend in dominance is quite steep, and the next support we have is at 60.49. There’s still room for dominance to drop to this level.
📅 Total2 Analysis
Moving to Total2, yesterday the 1.46 trigger was activated and price moved to 1.5, and it is now sitting just below that level.
💫 If this level breaks, another bullish wave towards 1.62 could form.
📅 USDT.D Analysis
Looking at Tether Dominance, this index is also in a downtrend similar to Bitcoin Dominance, which shows that money is exiting both Bitcoin and Tether and entering altcoins.
🎲 So keep a close eye on altcoins in the coming days, because a lot of capital is flowing into them and they could see significant pumps.
❌ Disclaimer ❌
Trading futures is highly risky and dangerous. If you're not an expert, these triggers may not be suitable for you. You should first learn risk and capital management. You can also use the educational content from this channel.
Finally, these triggers reflect my personal opinions on price action, and the market may move completely against this analysis. So, do your own research before opening any position.