BTC/USDT 15min - Liquidity Sweep + OrderBlockPrice is approaching sell-side liquidity resting below equal lows, aligning with a key bullish order block. A potential W-pattern formation, combined with a volume spike at the sweep zone, suggests smart money accumulation. If confirmed, price may target the buy-side liquidity above, offering a high-probability reversal setup.
BTCUSDT trade ideas

Tariffs incoming...July 23: Markets are booming.
August 1st: Tariffs.
I'm just saying, it might be a nice discount...
#market #finance #tariff #trump #crypto #forex #stocks #economy #trading
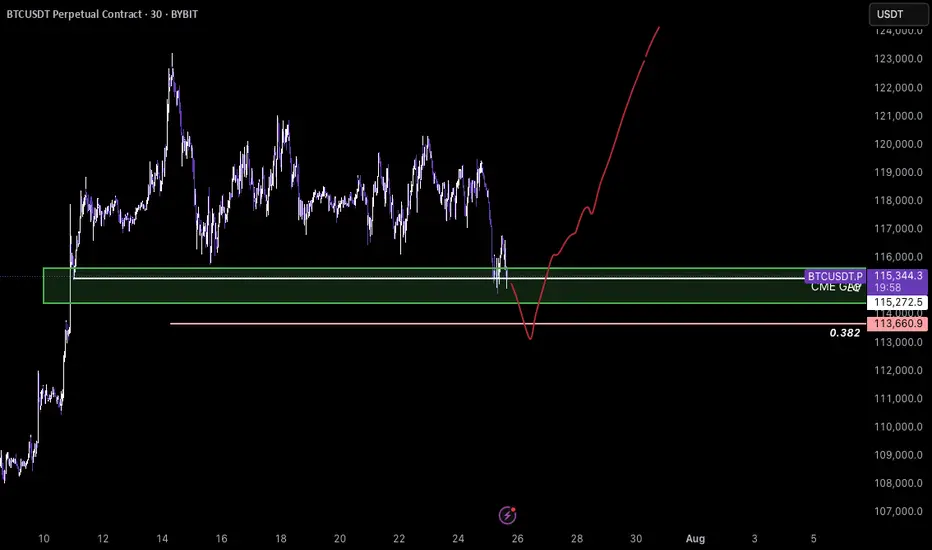
BTC- New ATH?BTCUSDT – Potential Reversal from CME Gap Support
Bitcoin is currently trading around a key demand zone aligned with a CME gap between ~$115,272 and $114,000. Price recently swept local lows with increased volatility and is showing signs of absorption just above the 0.382 Fibonacci retracement ($113,660), which adds confluence to the area.
If BTC continues to hold above this zone and shows volume confirmation, I expect a strong bullish reaction. This move could initiate a rally toward the previous high and potentially lead to a breakout to new all-time highs (ATH), as outlined in the red projected path.
Key levels- LQ, Fibbo 0.382, CME gap - futures
BTC dropping like a brick....bound to happen sooner or laterHard drops follow big spikes. Happens every time, just look back in time. But this time it's different? Maybe to some extent, but as long as there are short term profit takers and insane volatility this trend will continue. Only 2 cents is to not SHORT SELL. You will only contribute to the potential squeeze and will lose money. If you're up now, your priority should be to retain value and sell before it goes down to it's next support level which is under 100k! Maybe it does or not, but the dips do happen and with automated trading bots it could hit more aggressively and faster. If anything, but the dip when there's sufficient support. Best of luck!

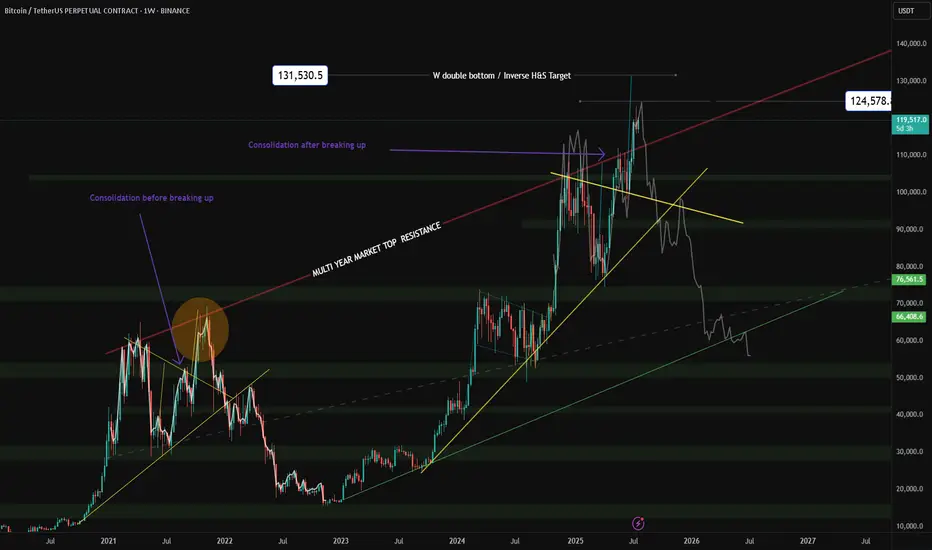
Potential head and shoulders pattern appears on Bitcoin’s globalHey everyone!
I've been on TradingView for a while, but this is my first post — so go easy on me 😄
I'll keep it short and straight to the point.
---
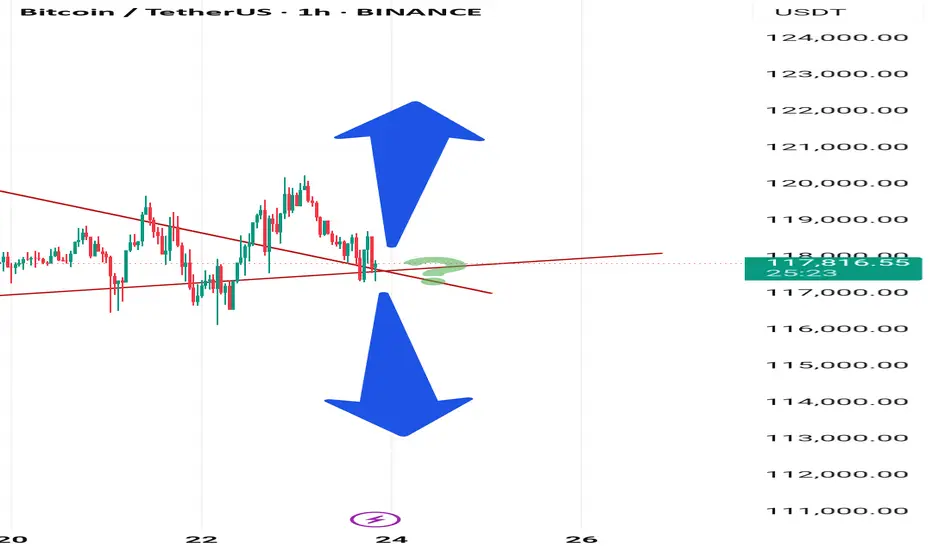
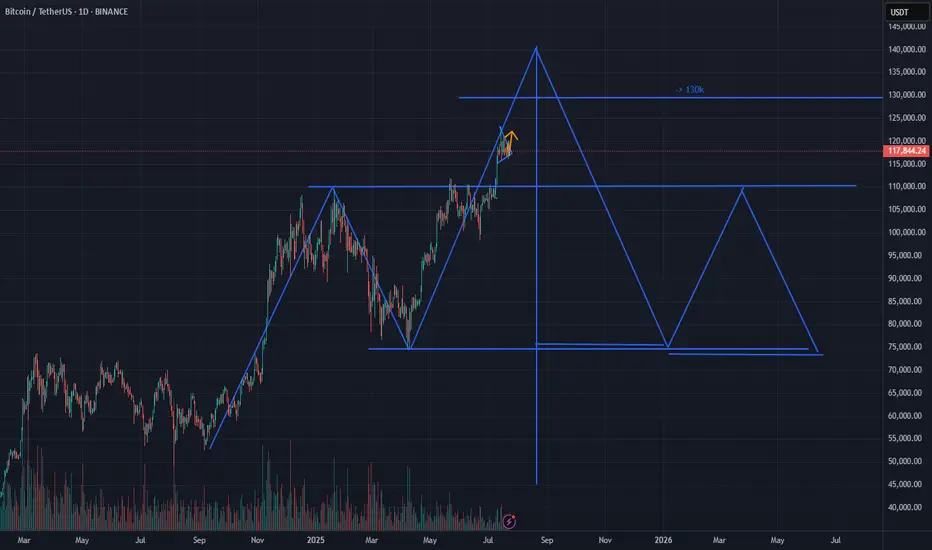
A head and shoulders pattern is forming on the global Bitcoin chart
The pattern is not yet fully formed, and it is difficult to draw any conclusions, but what has already formed may indicate the implementation of this pattern, which we may see in the near future, which means that an upward movement is possible, before the head is formed
Current price: $118k
With this pattern, there is a low probability of a price breakout to $103.4k
The head of the pattern may be at $124k or $129k, provided there is no strong positive news background from the US government regarding Bitcoin
This analysis is based on the technical pattern and also incorporates AI to provide more accurate results.
---
I'd be happy to hear your thoughts, feedback, or any constructive criticism in the comments!
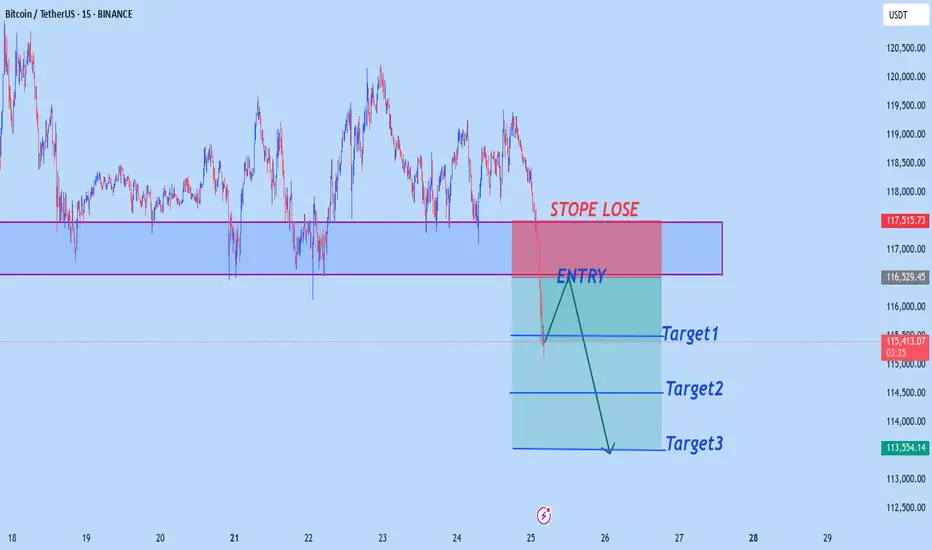
BTCUSD M15 OUTLOOKBtcusd sell from 116,500
target1 115,500
target2 114,500
target3 113,500
Stope Lose 117,500
Trade at your own risk
BTC - RotationsStill pingponging between VAL and VAH, so there is not much to update on BTC.
I think patience is key here, most of all don't chase moves but position at the extremes for opposite side, then you are much better placed for continuation moves.
I never try to have much expectations, but there is a smol gut feeling that ETH puts in a new high locally (let's say around 3920-50) while BTC takes out the internal highs at 121k and makes a lower high.
I can be wrong and we simply keep drifting higher, but divergences between ETH and BTC are often worth watching, because the market as a whole usually struggles to maintain strength when alts attract more capital than BTC does (relative to mc).

Is it time for BTC big reverse?According to oscillators and volumes, we can expect BTC to soon undergo a significant correction:
- RSI peaks are declining, forming a divergence. A divergence is also observed on the weekly timeframe.
- MACD also shows a divergence.
- Falling volumes amid rising prices.
Horizontal lines mark two levels with minimum volumes in the profile. Such volume drops usually characterize support levels, which can be used as targets for shorting.

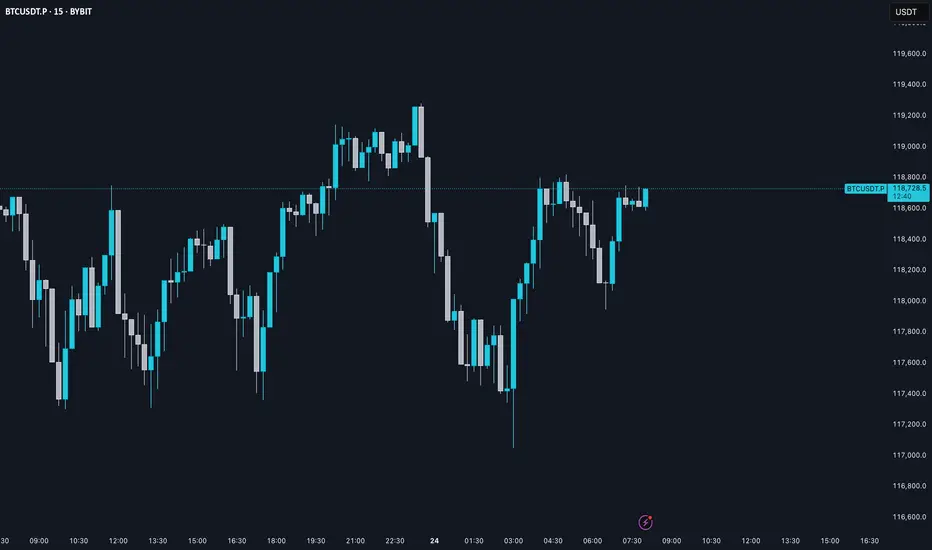
BTC AI Prediction Dashboard - 6h Price Path (23.07.25)
Prediction made using Crypticorn AI Prediction Dashboard
Link in bio
BTCUSDT Forecast:
Crypticorn AI Prediction Dashboard Projects 6h Price Path (Forward-Only)
Forecast timestamp: ~11:00 UTC
Timeframe: 15m
Prediction horizon: 6 hours
Model output:
Central estimate (blue line): -118,258
Represents the AI’s best estimate of BTC’s near-term price direction.
80% confidence band (light blue): 118,206 – 118,719
The light blue zone marks the 80% confidence range — the most likely area for price to close
40% confidence band (dark blue): 117,712 – 119,423
The dark blue zone shows the narrower 40% confidence range, where price is expected to stay with higher concentration
Volume on signal bar: 133.21
This chart shows a short-term Bitcoin price forecast using AI-generated confidence zones.
Candlesticks reflect actual BTC/USDT price action in 15-minute intervals.
This helps visualize expected volatility and potential price zones in the short term.
[SeoVereign] BITCOIN BULLISH Outlook – July 24, 2025We are the SeoVereign Trading Team.
With sharp insight and precise analysis, we regularly share trading ideas on Bitcoin and other major assets—always guided by structure, sentiment, and momentum.
🔔 Follow us to never miss a market update.
🚀 Boosts provide strong motivation and drive to the SeoVereign team.
--------------------------------------------------------------------------------------------------------
Hello.
This is SeoVereign.
I am still holding the long position that I suggested in the idea posted on July 9th.
Regarding the upward trend that started around 107,200 USDT, I have consistently maintained my position without much doubt until just before posting this idea, as there were no clear signs indicating a decline.
However, at the time of writing this idea, some elements suggesting downward pressure are gradually being detected. Nevertheless, this idea is constructed around the upward scenario. The reason is that, as mentioned in this idea, a ‘single upward move’ is expected to occur with relatively high probability. Whether this rise leads to a trend reversal or serves as a precursor to a downturn will likely depend on how the chart unfolds.
The average TP (target price) is set around 119,300 USDT.
As always, I will carefully observe how the chart develops over time and will update with further explanations that organically integrate the detailed interpretations and grounds of this idea accordingly.
Thank you.

BTCUSDT Forming Bullish WaveBTCUSDT is currently forming a bullish wave pattern, signaling a potential continuation of its upward momentum. This technical setup suggests a series of higher highs and higher lows, indicative of strong buyer demand and consistent market optimism. With volume remaining robust, the foundation for a significant breakout is solid. If the pattern plays out, analysts expect a 09% to 10% gain in the mid to long term, which could be fueled by renewed institutional interest and global adoption.
Bitcoin has historically responded well to bullish wave formations, often leading to aggressive rallies once key resistance levels are breached. As the largest cryptocurrency by market cap, BTCUSDT not only reflects investor sentiment in Bitcoin itself but also often sets the tone for the broader crypto market. The current price action shows consolidation with positive volume spikes, which further supports the bullish thesis and provides a potential launchpad for another major leg upward.
With increasing attention on macroeconomic shifts, regulatory developments, and halving cycles, Bitcoin continues to position itself as a hedge against traditional market uncertainties. The bullish wave pattern now forming could signal that Bitcoin is entering a new phase of growth, especially as global interest in decentralized finance, ETFs, and blockchain innovation surges.
Traders and long-term investors alike should closely monitor this structure. A breakout with volume confirmation could offer an excellent entry point, backed by strong technicals and a solid fundamental backdrop. The combination of a bullish pattern and broader adoption trends makes BTCUSDT one of the most watched assets in the market right now.
✅ Show your support by hitting the like button and
✅ Leaving a comment below! (What is You opinion about this Coin)
Your feedback and engagement keep me inspired to share more insightful market analysis with you!

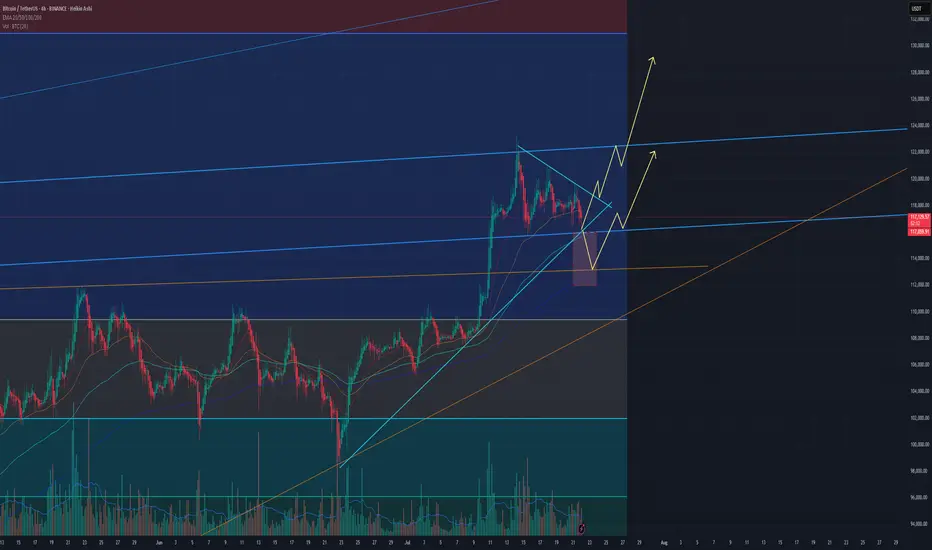
Bitcoin Ready for the Next Leg Higher!Bitcoin is currently consolidating within a symmetrical triangle on the 4-hour timeframe, showing signs of a potential breakout. After a strong rally earlier in July, BTC has entered a compression phase, forming lower highs and higher lows — a classic setup for a volatility breakout.
Price is moving near the apex of the triangle, suggesting that a decisive move is imminent. The 50 EMA and 100 EMA are both acting as dynamic support, helping bulls maintain control of the structure. A breakout above the descending trendline could initiate a sharp move toward the $130K–$133K target zone.
Cheers
Hexa
BINANCE:BTCUSDT

Accumulate BTC over 115K💎 BTC PLAN UPDATE (July 23rd)
NOTABLE NEWS ABOUT BTC
Bitcoin (BTC) and Ripple (XRP) are approaching their all-time highs, while Ethereum (ETH) continues to grow steadily toward the important $4,000 mark. These top three cryptocurrencies by market capitalization are showing signs of a new bullish momentum, supported by strong technical structures and increasing investor interest.
TECHNICAL ANALYSIS PERSPECTIVE
1. Main Trend
The overall trend remains bullish, with a clearly rising price channel (black diagonal line).
However, BTC is currently in a short-term correction phase, consolidating sideways after the recent strong surge.
2. Key Price Levels
🔵 Strong Support Zone: 116,000 – 117,000 USDT
This zone includes the 200-day moving average (MA200), horizontal support, and a previous bottom — making it a decisive area for the short-term trend.
If this zone breaks, BTC could fall to a deeper support area around 111,000 USDT.
🔴 Resistance Zone: 122,000 – 123,000 USDT
This is a previous peak and a recently “false breakout” area — a strong psychological resistance.
If broken convincingly, BTC could surge to the 130,000 USDT zone (Fibonacci extension 1.618).
3. Possible Scenarios
✅ Bullish Scenario:
Price retests the 116,000 – 117,000 support zone and then bounces.
If it breaks through the 122K resistance, the next target is 130,000 USDT.
❌ Bearish Scenario:
If price breaks below MA200 and the 116K support zone → it could drop to the deeper zone around 111,000 USDT.
4. Technical Signals
There is a triangle accumulation pattern (with flat tops and bottoms).
The “false breakout” at the resistance zone shows that buyers are not yet strong enough and a retest of support is needed.
Follow the channel for the latest and continuous updates on XAUUSD, CURRENCIES, and BTC.
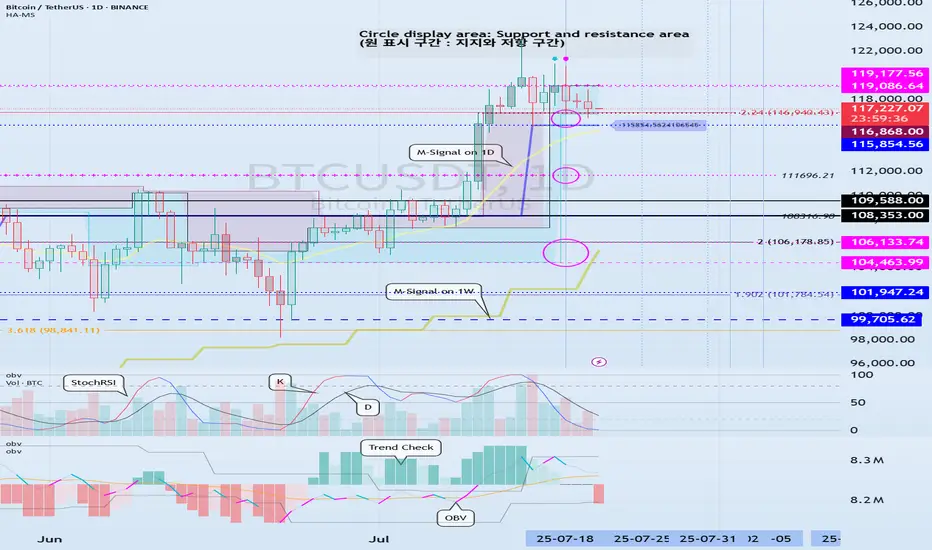
Support around 115854.56-116868.0 is the key
Hello, traders.
If you "Follow", you can always get the latest information quickly.
Have a nice day today.
-------------------------------------
(BTCUSDT 1D chart)
The DOM(60) indicator of the 1W chart is generated at the 119177.56 point, and the DOM(60) indicator of the 1D chart is generated at the 119086.64 point, and then shows a downward trend.
However, since the HA-High indicator is formed at the 115854.56 point, it is difficult to say that it has yet turned into a downward trend.
Accordingly, it is necessary to check whether it is supported in the HA-High ~ DOM(60) section.
The next volatility period is expected to occur around July 25 (July 24-26).
However, the important volatility period is expected to be around August 2-5 (maximum August 1-6), so we need to look at what kind of movement it shows as it passes through the volatility period that will occur in the future.
-
Since the StochRSI indicator has entered the oversold zone, there is a possibility that the decline will be restricted.
Therefore, the key is whether there is support around 115854.56-116868.0.
This is because if it falls below the HA-High indicator, there is a possibility that a downtrend will begin.
Also, since the M-Signal indicator on the 1D chart is rising around 115854.56, it can be seen as an important zone.
--------------------------------------------------
An indicator called Trend Check has been added to the OBV indicator.
This indicator is an indicator that comprehensively evaluates the StochRSI, PVT-MACD oscillator, and OBV indicators and expresses them in a column.
Accordingly, if the TC indicator rises from the 0 point, it can be interpreted that the buying force is dominant, and if it falls, the selling force is dominant.
Therefore, if it rises above 0, it is likely to show an upward trend, and if it falls below 0, it is likely to show a downward trend.
Also, if the TC indicator touches the highest point (6) or lowest point (-6), there is a high possibility that the trend will reverse, so you should think about a response plan for this.
-
Thank you for reading to the end.
I hope you have a successful trade.
--------------------------------------------------
- Here is an explanation of the big picture.
(3-year bull market, 1-year bear market pattern)
I will explain the details again when the bear market starts.
------------------------------------------------------
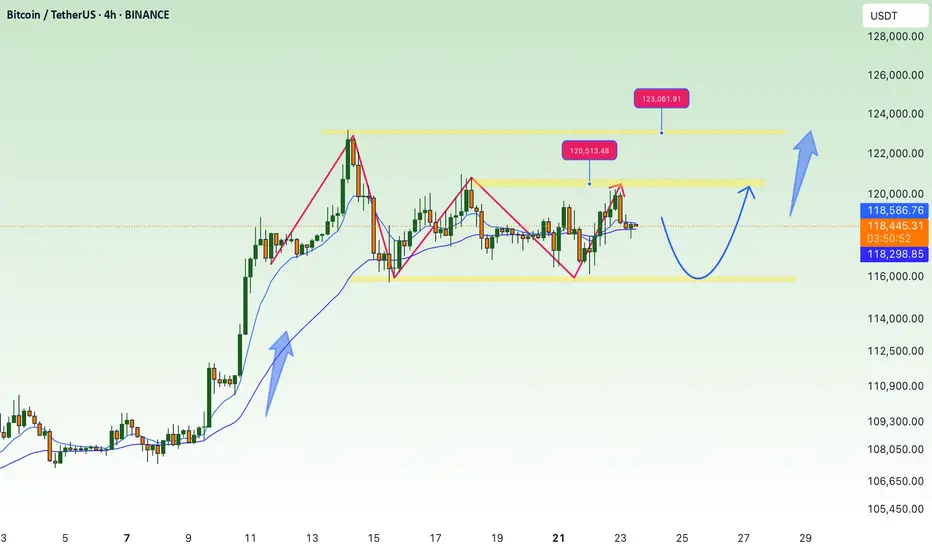
BTC/USDT – 2H Chart Update!!BTC/USDT – 2H Chart Update
Breakout Confirmed:
BTC has broken above the descending trendline but is currently facing resistance at around $ 119,500.
Support Zone:
Strong ascending support between $ 117,000 and $ 118,000 remains intact.
Moving Average:
Price is currently testing the 2H MA (~$118.3). Holding above this could confirm bullish continuation.
Outlook:
If BTC holds above $ 118,000, a move toward $ 123,000–$ 125,000 is likely.
Failure to hold may retest $117K support.
Bias: Short-term bullish unless price breaks below ascending trendline.
Thanks for your support!
DYOR. NFA

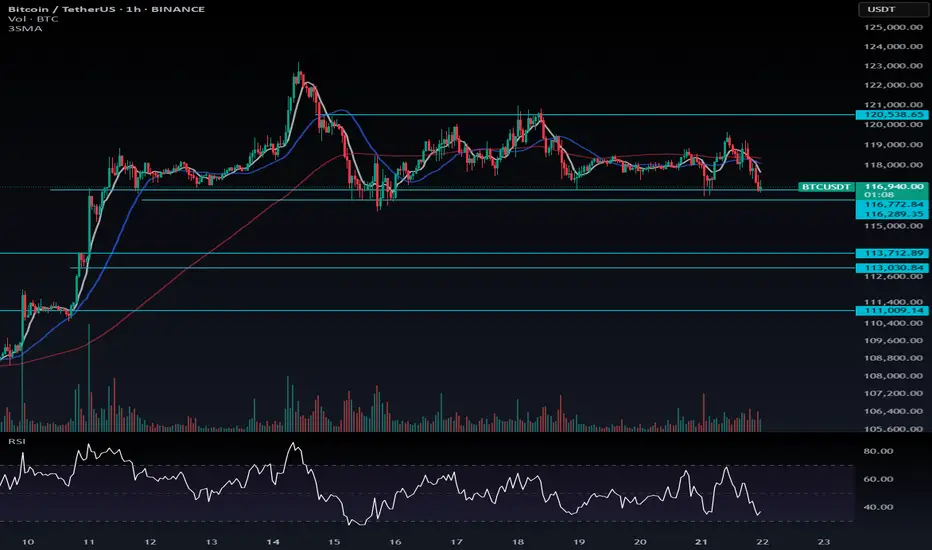
BTC Ranging After $123K Pump 📈 BTC Ranging After $123K Pump — Key Support/Resistance & Altcoin Outlook
After a strong rally to $123,000, Bitcoin is now ranging, and what’s important to note is that BTC Dominance was falling both during the pump and the consolidation — a sign of strength in altcoins.
🧠 Key Levels to Watch:
If $116,289.3 breaks, consider partial profit-taking, especially if you're in alt positions, or adjust your stop-losses upward.
The zone between $116,289 – $116,773 is critical. If it fails, we could see a drop toward $113,000 – $113,713.
As long as BTC is above $111,000, the bullish structure remains intact — I’m personally not shorting in this range.
The next bullish trigger I’m watching is around $120,538.6 — not confirmed yet.
🧭 Dominance Signal:
If BTC corrects, I expect BTC Dominance (BTC.D) to bounce to around 62.73%–63.17%.
But if BTC continues to range or goes higher while dominance drops, altcoins may outperform — keep your eyes on strong setups.
---
💬 What are your top altcoin picks in this BTC range? Let me know below!
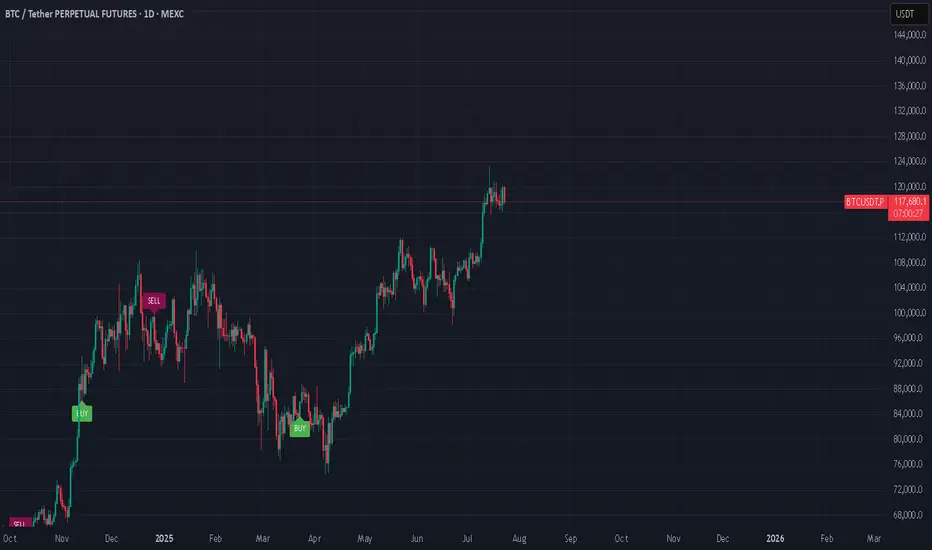
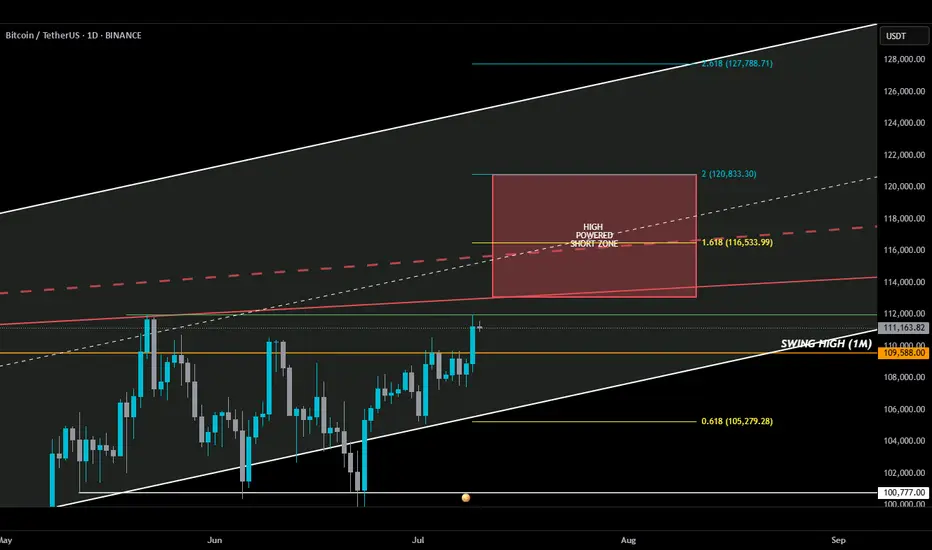
HIGH POWERED SHORT ZONE 2.0HIGH POWERED SHORT ZONE ⚡️
Usually, a 3% move doesn’t make anyone blink—but this one? It sent BTC into all-time high territory. I almost popped the champagne… until I remembered I’m in a short.
Not because I don’t believe in upside—but because my add zone in the HIGH POWERED SHORT ZONE hasn’t been tagged. Yet.
Here’s the breakdown 🧵👇
________________________________________
Before anyone goes bUCK wilD and cracks open that dusty bottle of Veuve, double-check something:
📅 The July 10th daily candle needs to close above the monthly swing high (orange line).
If BTC bulls lock that in, then a move deeper into the HIGH POWERED SHORT ZONE becomes real...
play-the-game real…
________________________________________
Where’s this HIGH POWERED SHORT ZONE coming from?
🔻 Solid red line – a trendline from Dec 2024 that has held strong through three separate tests — marking it as a key line on the sand.
🔻 Dashed red line – goes all the way back to Dec 2017. A seasoned veteran of resistance.
I also drew in a white ascending channel—not just for looks. If BTC breaks out, this channel will help us ask:
“How high is too high?”
________________________________________
Now enters Fibonacci — where nature maps out key alignments on the chart. 🌱
🟡 Gold lines = Fib golden ratios
🔵 Teal lines = Fib Degen Ratios
It’s wild how they just line up:
• 2.618? Right on the top of the channel.
• 1.618? Sitting on the 2017 trendline.
• 0.618? Near current support + bottom of the channel.
Also had to draw that horizontal support white line to keep an eye on.
A Bounce or bust? Ask the bUCKmOON!
This time it's not different. Still The same macro structure. This time it's not different. we are in the last phase of the bull market cycle.
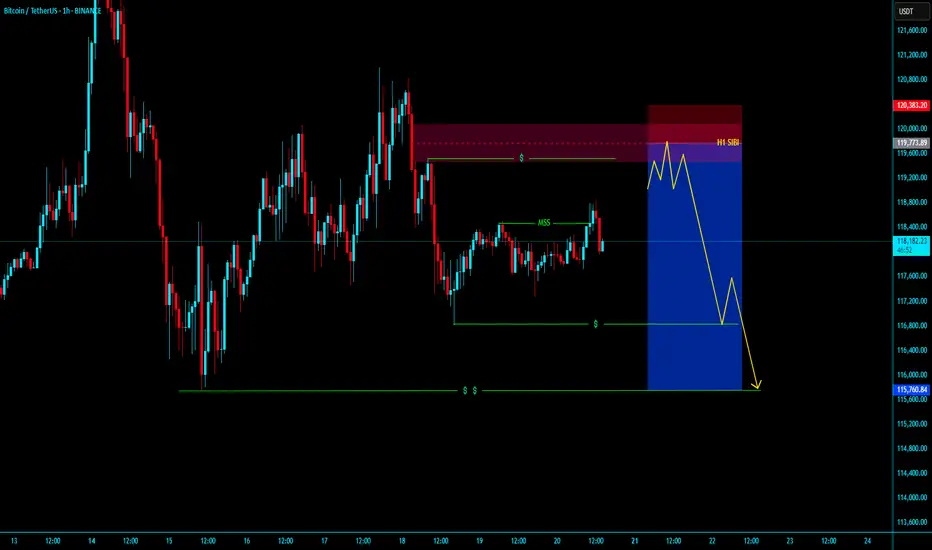
BTCUSDT BEARISH H1 SIBI SELL SHOTBTCUSDT BEARISH H1 SIBI SELL SHOT
Market is Bullesh Right now market is going to h1 sibi in LTF with valid mss with valid obi
entyr with tight sl and Target is our nearest Liquidity .....enjoyyyyyyyyyyy
KGB Priyabrat Behera
ICT Trader & Advance Mapping SMC Trader
2 Possible Scalps for BITCOINThere are 2 Demand areas which have specified on the chart,
Both could be good for some scalps.
As long as price keeps 116.400 area UpTrend is on the card.
