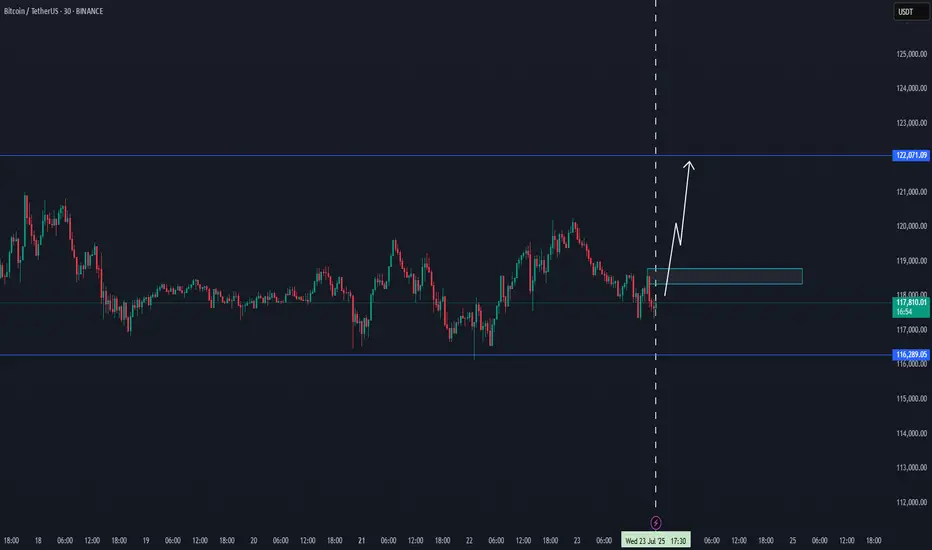
BTC / USDT : Broke down and now going for retestBitcoin Analysis:
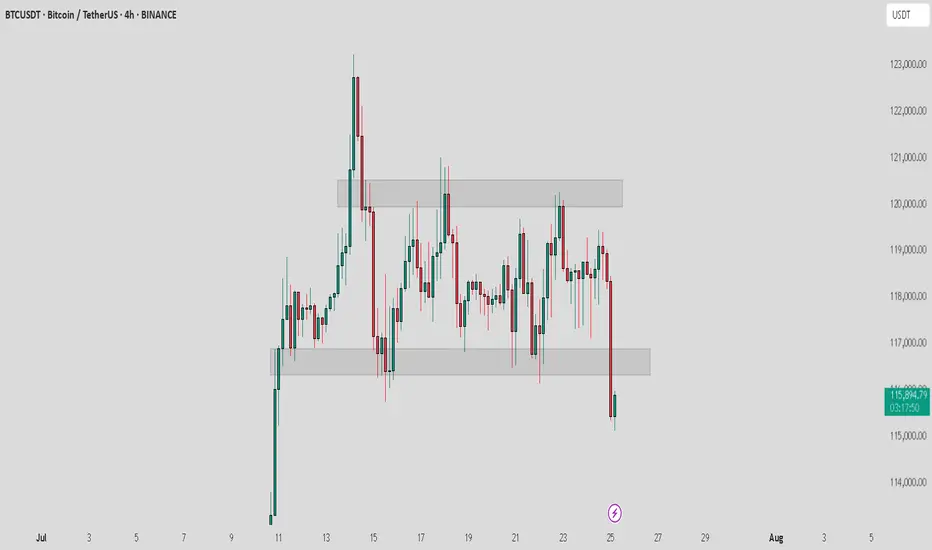
Bitcoin has broken down and is now retesting the support zone. As mentioned earlier, a shakeout can happen at any time, and this looks like the potential retest phase.
Bullish Scenario:
Reclaims Resistance: If BTC manages to break through the resistance after the retest, it will stabilize for the short term. This could lead to a move towards higher levels.
Bearish Scenario:
Failure to Break Resistance: If the retest fails and BTC can't reclaim the resistance, further downside could be expected.
Targets: Keep an eye on the CME gap at $114,000 and 92K as key levels to watch for potential price action.
Note:
Manage your risk carefully. The market is volatile, and a shakeout could happen anytime. If BTC fails to break resistance after retest, more pain may be ahead.
BTCUSDT trade ideas
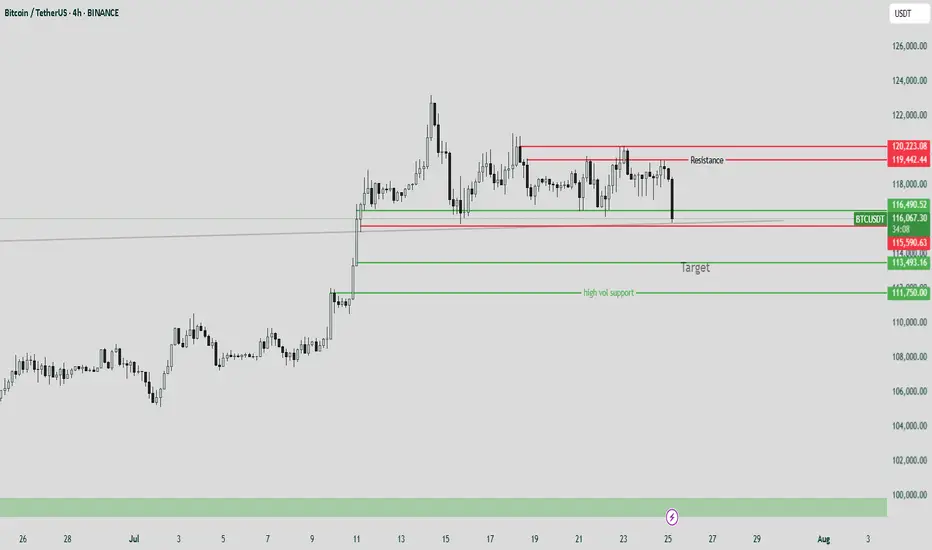
BTC SHORT IDEA114500 is TP1
113 is TP2
BTC is in Price Discovery Mode...
New ATH was created recently.
500M Shorts were Liquidated at 122k Region.
All the dips are healthy.
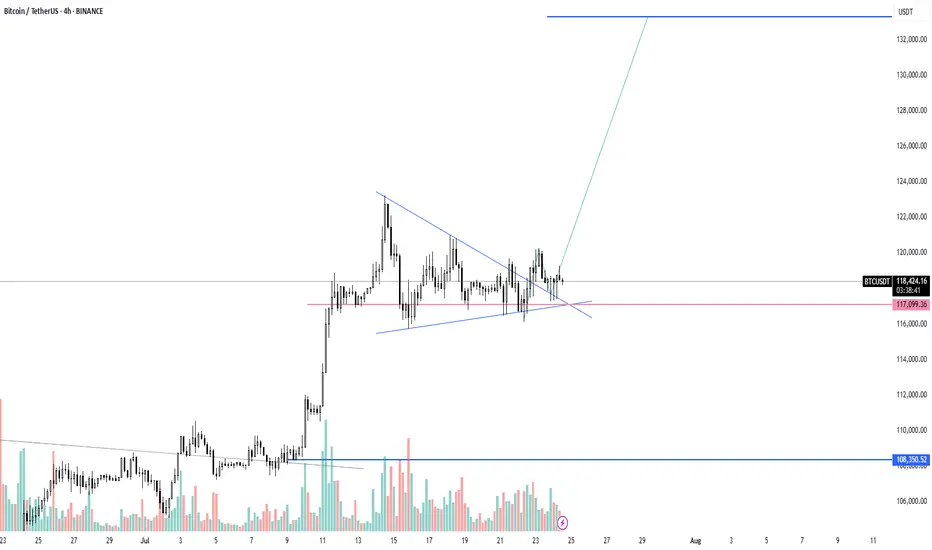
BTC - Nuke down to 104k?Hahhaa noo, but payttern shall commence in orange for a good move altogether!

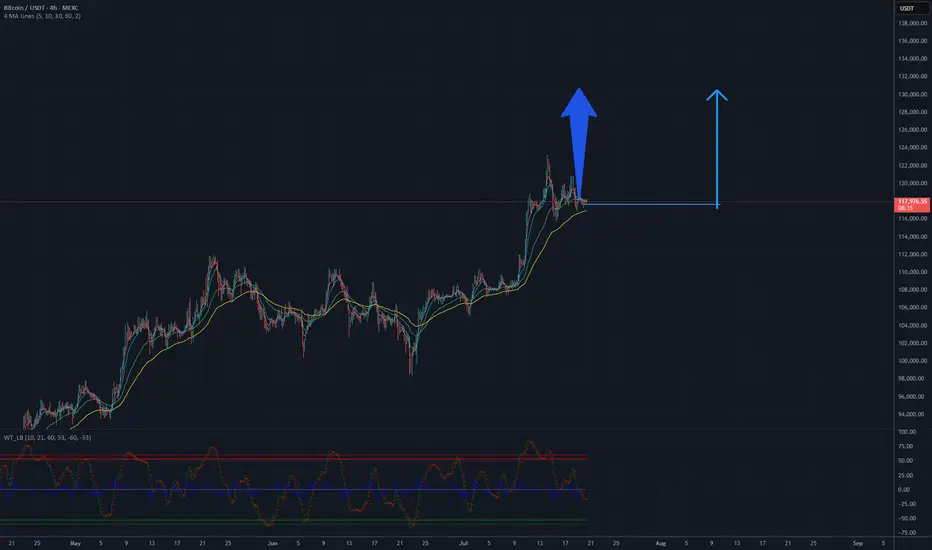
BTC will be 130 K USD? Potential target 130 000 USDAnalysis of the Bitcoin (BTC/USDT) chart on the MEXC platform indicates a positive upward trend. The price is currently hovering around $117,823, with clear support at approximately $100,000, as confirmed by the lower channel line. Moving averages (MA) suggest a sustained upward trend, and the trend line drawn from the lows points to potential for further growth. The current resistance is in the $120,000-$125,000 range, but if momentum holds and this level is breached, the price could head toward $130,000 in the short to medium term. It is recommended to monitor volume and key support and resistance levels to confirm further upward movement.
Potential TP: 130 000 $
Bitcoin is testing the triangle ┆ HolderStatBINANCE:BTCUSDT is ranging $132K–$137K in a triangle pattern. Breakout above $137K may target $143K. Decision point near.
BTCUSD NEW OUTLOOKBTCUSD market Continuously running in both sides from last couple of days now market will be touch the support zone you have to great chance to go long from
SOPPORT ZONE if you want
TRADE AT YOUR OWN RISK
REGARD ALBERT

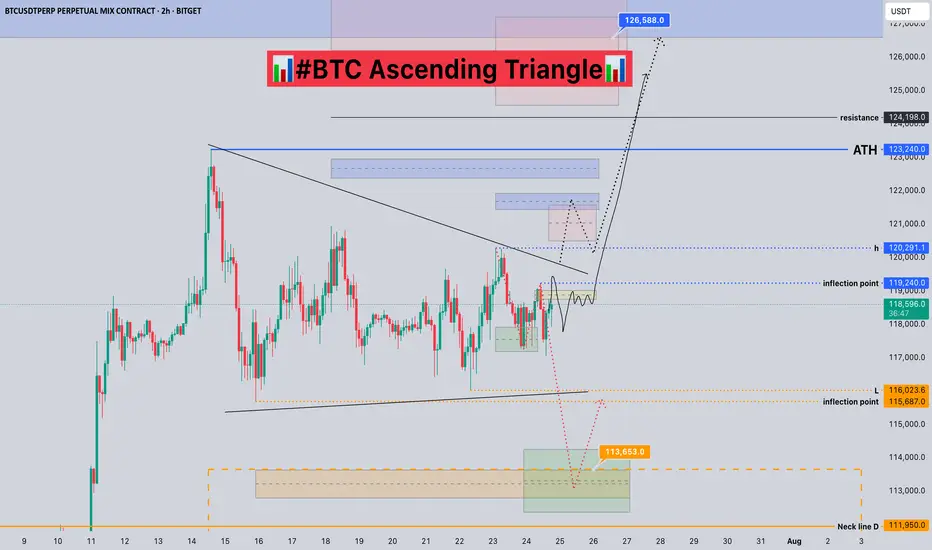
#BTC Ascending Triangle📊#BTC Ascending Triangle📊
🧠From a structural perspective, we are still in a sideways consolidation phase. We have already built a short structure. If we want to continue to rise, we need to break through the blue turning point 119240 and stabilize before we can usher in a big surge.
➡️From a morphological perspective, an ascending triangle is forming. After breaking through h, it is confirmed that the upward breakthrough will occur. The subsequent pullback is worth our participation.
⚠️If we fall below the low point near 116000, we cannot blindly go short, because the sideways consolidation time is too long. After the selling pressure is exhausted, the lows that appear are all opportunities for us to participate in long transactions.
🤜If you like my analysis, please like 💖 and share 💬 BITGET:BTCUSDT.P
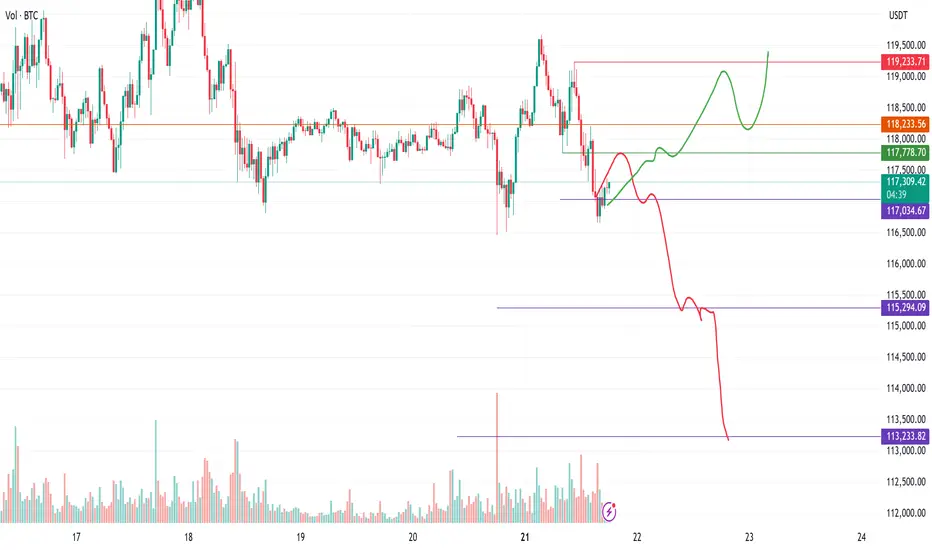
BTC Correction in progress - Can it invalidate? BTC downside pattern triggered on 30 min chart. If it can get back above the green line it will invalidate, though right now the red downside path is looking more likely.
Bitcoin longLong from 115k region.
Sweep 4h lows and then i think it will show some strength to the upside.

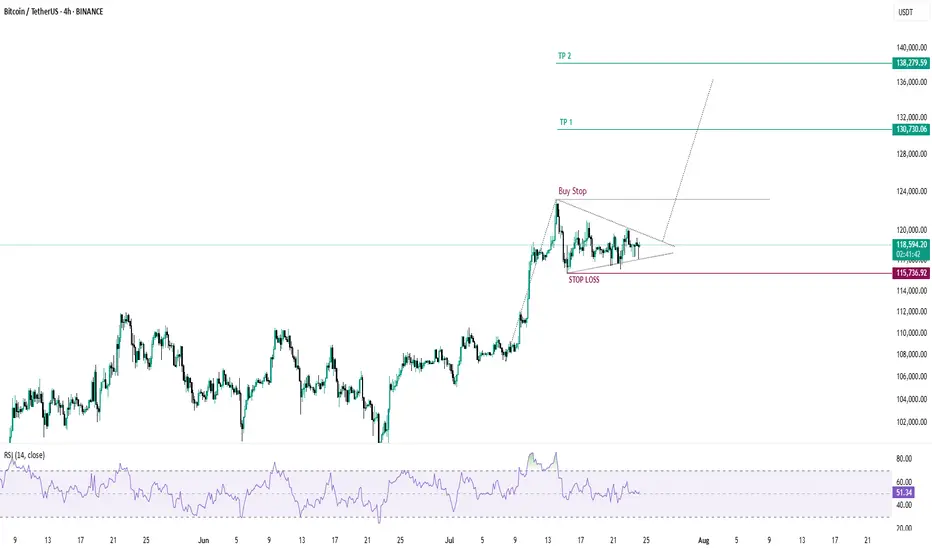
BTCUSDT-LONG IDEABTCUSDT is in accumulation forming a triangle if it break this triangle then it will be heading toward top end of the pole buy using a buy stop Stop loss and take profit is mentioned in the chart
Bitcoin (BTC): Liquidity Hunting + Buyside Dominance | Bullish!What a week we have had so far; it has moved this whole week so far like one big rollercoaster, but nevertheless we are still above the $116K zone so we are bullish.
While we see slight buyside dominance,, we also see huge order limits sitting at $115K,, which means we might still see some kind of "last liquidity hunting."
That being said, we are keeping an eye on $116K and $115K zones.
Swallow Academy

Crypto Market Update & BTC & ETH Analysis
🚀 Crypto Market Update & Technical Analysis
🟢 Bullish News & Positive Signals:
• Altcoin Season Index is rising + CZ calls this the “FOMO season” → signaling emotional growth in altcoins, especially in short timeframes.
• Fear & Greed Index hits 74 → market is in a greedy phase; growth continues but a correction might be near.
• Goldman Sachs: Possible rate cuts from 2025 → expectations for a looser monetary policy, which is good for risk assets like BTC and ETH.
• Whales and institutions buying ETH (over 50K ETH in 48 hours) → suggests accumulation or preparation for the next Ethereum rally.
• $332M inflow into U.S. Ethereum ETFs → strong mid-term bullish fundamental for ETH.
• A whale withdrew 76,000 SOL from exchanges → usually a sign of HODLing and price growth expectations.
🔴 Warning News & Caution Signals:
• Bitcoin selling by long-term holders (high CDD) → selling pressure near historical highs could slow the rally, but not end it.
• Whale opened a 10x leveraged DOGE long ($19.82M) → could cause high volatility and liquidation risk for traders.
• TRON rings Nasdaq bell but TRX is negative → promotional event, but no strong demand reaction.
• BNB market cap surpasses Starbucks, but price is negative → long-term positive, but short-term market may be overheated.
• High Greed Index → short-term correction risk for BTC and alts.
✅ Analytical Summary (News + Charts):
• If technical signs of selling appear (especially on BTC or ETH), take them seriously as news supports selling pressure from some whales.
• Big institutional entries into ETH and SOL confirm the strength of the bigger trend.
• Market is emotional but still has a strong support base under BTC & ETH. Possible corrections = better buying opportunities, not exit signals.
📊 Technical Analysis
Strategy I use:
I analyze HWC (1D), MWC (4H), and LWC (1H).
Entry is based on breakouts in MWC (4H) and confirmation in LWC (1H).
♦️BTC/USDT♦️
• BTC is moving in the 116.2 – 120 range, keeping a bullish structure intact.
• I will not look for shorts as long as 110 holds.
• To keep the bullish scenario alive, we need high volume and sharp candles to break 121 – slow moves won’t work anymore.
• Stop-buy orders near 121 can be used to enter a long if the breakout is strong.
♦️BTC Dominance (BTC.D)♦️
• After a sharp drop last week, BTC.D is now correcting.
• Key level 61.31 was broken.
• The next resistance zones are 62.17 – 62.74 (currently being tested).
• If BTC.D holds above these levels, altcoins could see a bigger drop.
• If BTC.D rejects this zone, alts near breakout points will become our focus with better entry levels.
♦️USDT Dominance (USDT.D)♦️
• Showing signs of forming a bullish structure.
• Next resistance levels: 4.36 – 4.44.
• For a bullish continuation in coins, 4.14 must break down.
• Early but important level: 3.83 – if reached, we must rethink position management.
TOTAL / TOTAL2 / TOTAL3 /♦️ ♦️OTHERS.D
• Currently bearish, but BTC.D and USDT.D will show earlier signs of whether the correction is ending.
• Key levels to watch:
• TOTAL: 3.91
• TOTAL2: 1.55
• TOTAL3: 1.08
• OTHERS.D: 8.05 (a lower high may form if the uptrend resumes).
♦️ETH/BTC♦️
• Key level: 0.02975 (not reached yet).
♦️ETH/USDT♦️
• 3470 is the crucial level to keep the bullish structure.
• Many buyer orders (maker/taker) are stacked here, so the breakout may not be easy.
• Possible fake breakout in this area → could reset the bullish scenario again.
🎯 Conclusion:
The altcoin market correction is not over yet, but BTC & ETH are holding key support zones.
Focus remains on BTC.D and USDT.D.
If BTC breaks 121 with volume and dominance drops, it’s a green light for altcoins.
📣 If this analysis helped you, hit the 🚀, leave a comment 💬, and follow for more updates!
AI called it, Bitcoin listened! Now, will BTC stay the course?My AI saw Bitcoin's path weeks ago, and it's playing out PERFECTLY!
Uptrend, check.
Sideways pause? Check.
This cutting-edge tool is rewriting how we trade.
But now the stage is set for suspense...will it stay the course? Can it continue to defy the odds?
Lets see

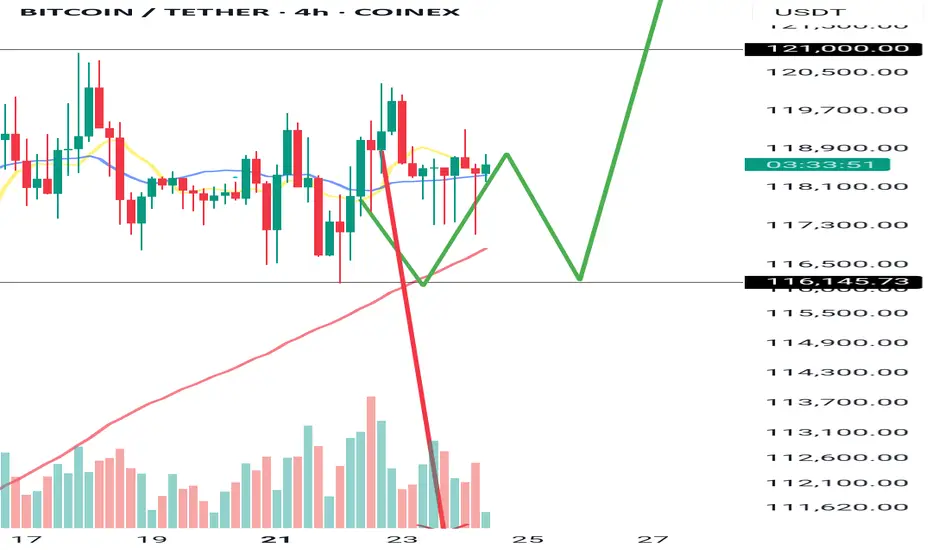
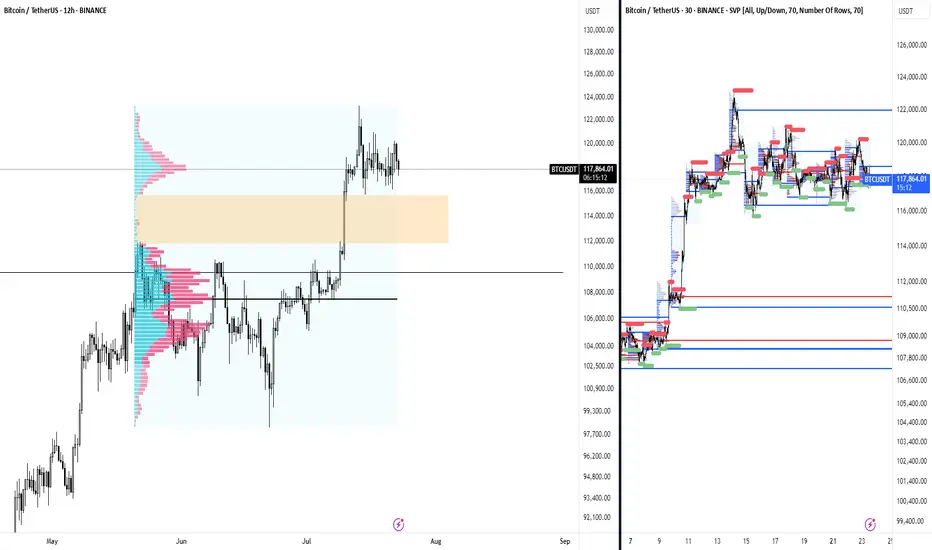
BTC NEW VOLUME TREND 122KThis is a small time frame update, where BTC can try to target 22K again in the coming time frames. Since the last 15H breakdown volume, BTC can enter new uptrend volume
From the box level, there is a good chance for a new uptrend.
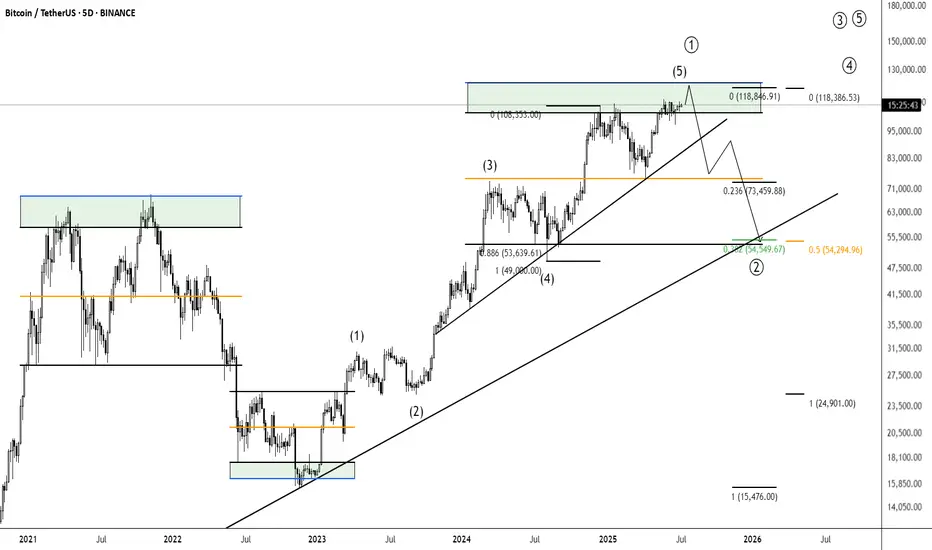
A bearish 12 Month candle could be in the cardsBitcoin made an yearly high of 20% after 6 months in on the yearly candle
This does not make me feel great about the rest of the year
a clear sell signal would be an higher timeframe close under 100k after an upthrust to new ath around 110k - 120k
around 50k-54k for me is an good buy level to build an longterm position:
0.382 fib retracement for an primary 1-2 wave
0.500 fib retracement from the 25k low
0.886 fib retracement from 49k low
50% pullback from current high to projected low
where will bitcoin go ? i don't know, but i do know where i want to buy and when i want to sell
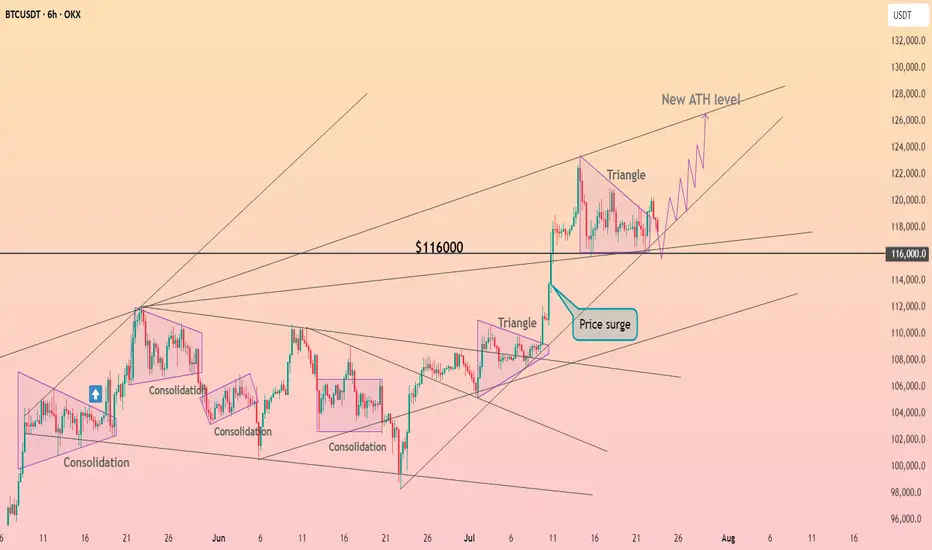
BTC Triangle Consolidation: Ready for TakeoffBTC is gearing up for its next move following a triangle consolidation
Bitcoin overall: sideways range, new ATH soonMy previous hypothesis of a sharp correction (scenario 3) looks to be incorrect. I believe the most likely corrective structure is a contracting triangle at this point (scenario 1), and the last leg should be bought for new ATH, however, it is also possible we had the last major low for this correction and new ATH are imminent (scenario 2)—which will be on the table if the indicated line gets taken out. In any case, new ATH should occur shortly!

BTC - Long SET-UP BINANCE:BTCUSDT
Bitcoin AMC Pattern Forming?
BTC is showing signs of an AMC-style accumulation after a range-bound consolidation. A clean breakout is possible if price respects the 113k–113.8k support zone — potential entry zone for smart money 📈
Alternatively, deeper liquidity may be tapped at the 110k–112k OB zone, offering another high-probability buy setup🔁
Watch for signs of bullish intent in these key zones — price structure suggests upside potential once liquidity is swept✅

BTC possible failed range breakout - Aggressive Move The BTC ATH rally began post cash close and had very thin volume on the break out before setting this range on the higher time frames. Normally, a range after ATHs are made I would be extremely bullish and I am.
Aside from the failed breakouts at the highs, the attempts paired with nuances such as the crypto week impulses, the day of signing GENIUS and new regulatory acts being drafted now, the attempts to break those ATHs were nudged off.
Sometimes come failed moves come fast moves, and so I have to be prepared that BTC will trade between these thin areas on the volume profile from 111k to 115k. 113k being the most noticeable node in the entire profile.
Similar to my analysis on the break to ATHs, I would expect this move to be aggressive and remind us of a 2020 cycle style flush in Altcoins. Kind of already seeing it with the performance of alts today preempting the failed move up on BTC at range highs.
I will NOT be shorting anything in crypto, these are just areas that I am heavily interested in buying. Currently flat perps and will wait for BTC to make its mind up.
BTC correction august/septemberBTC has reached overbought territory, there is also bearisch divergence. It also didnt go above 123k anymore. i expect a correction in august/september.
dont chase FOMO, be prepared. Nothing goes in a straight line. there are always corrections.
CRYPTO:BTCUSD BINANCE:BTCUSD CME:BTC1! BINANCE:BTCUSDU2025

BTCUSDT - UniverseMetta - Signal#BTCUSDT - UniverseMetta - Signal
H4 - Formation of a triangular formation in continuation of the trend, for a more confident entry you can wait for a retest and formation of the 3rd wave. Stop behind the minimum of the 1st wave.
Entry: 119294.13
TP: 123240.75 - 127823.91 - 130624.74 - 135239.73
Stop: 115824.93

BTC Analysis (2H)Bitcoin is currently consolidating within a symmetrical triangle, suggesting indecision in the market. However, a breakout is imminent — and when it comes, it will likely be sharp.
🔹 Bullish Scenario:
A breakout above $120K would likely lead to a new All-Time High near $124K.
🔹 Bearish Scenario:
A breakdown below $116,400 opens the door for a quick drop toward the $112K–$110K zone, which should be considered a buy opportunity.
⚠️ Pro Tip:
There’s a volume imbalance just below the $116.4K level. If price breaks below it, the move down may be faster and more aggressive than expected — so plan accordingly.
Regardless of short-term volatility, the macro trend remains bullish, and Bitcoin will rise again.
Thanks for reading.

My thoughts on Bitcoin.. ABC -> 129K Top?I think we correct down to 112K area to fill the FVG and CME then we Turn up, topping at 129K and then the rest of the Alts blow off top from there..
Thoughts?
