$BTC Macro UpdateBitcoin Macro Outlook BINANCE:BTCUSDT.P
Weekly
Bias & momentum remain bullish. Price is pressing toward new ATHs despite last week’s pullback.
Next macro target: ~$133,550 (extension of the current DeCode V-Range: 111,959.5 – 77,111.0).
A weekly close back inside that range (<111,968.0) = Failed Auction → serious red flag for reversal.
Daily
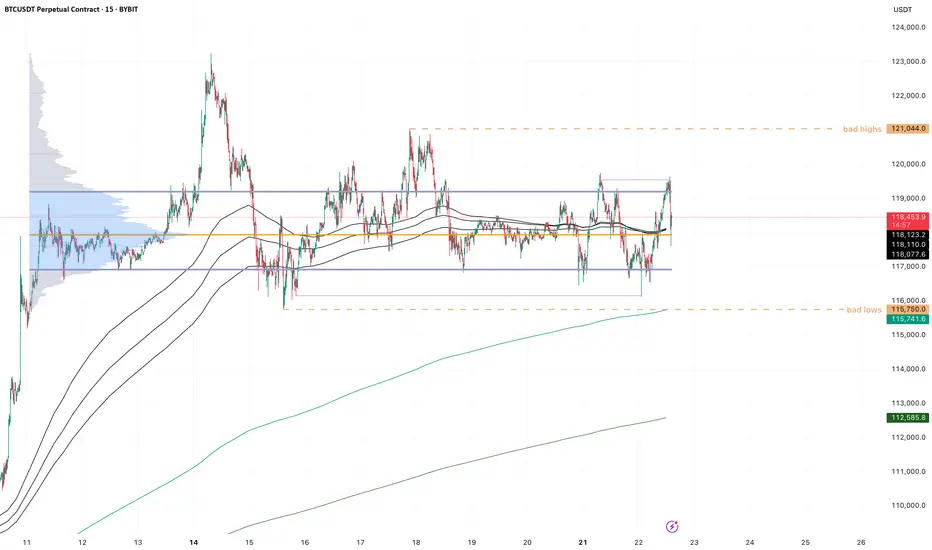
Clean rejection off the 21-Day Rolling VWAP + bounce at the structural HL V-Level (116,862.4).
A strong bullish engulfing today would set the tone for follow-through this week.
10-Hour
Structure is still bullish. Multiple Failed Auctions from ~116,960.0 are driving price toward the ATH.
Intraday
Choppy and hugging range lows → harder read. That behavior near balance edges triggers AMT Rule #5: “If time/volume builds at the edge of balance, price is likely to push through.”
Auction Market Theory – Quick Reminders
Price : advertises opportunity
Time : regulates opportunity
Volume : tells you if the auction is succeeding or failing
Rule #5 (above) is in play right now. Stay patient, wait for confirmation, and don’t FOMO.
BTCUSDT trade ideas

targetRemember, day trading is risky and most traders lose money. You should never trade with money you can’t afford to lose. Prove profitability in a simulator before trading with real money.
❗❗My results are not typical. We do not track the typical results of past or current customers. As a provider of trading tools and educational courses, we do not have access to the personal trading accounts or brokerage statements of our customers. As a result, we have no reason to believe our customers perform better or
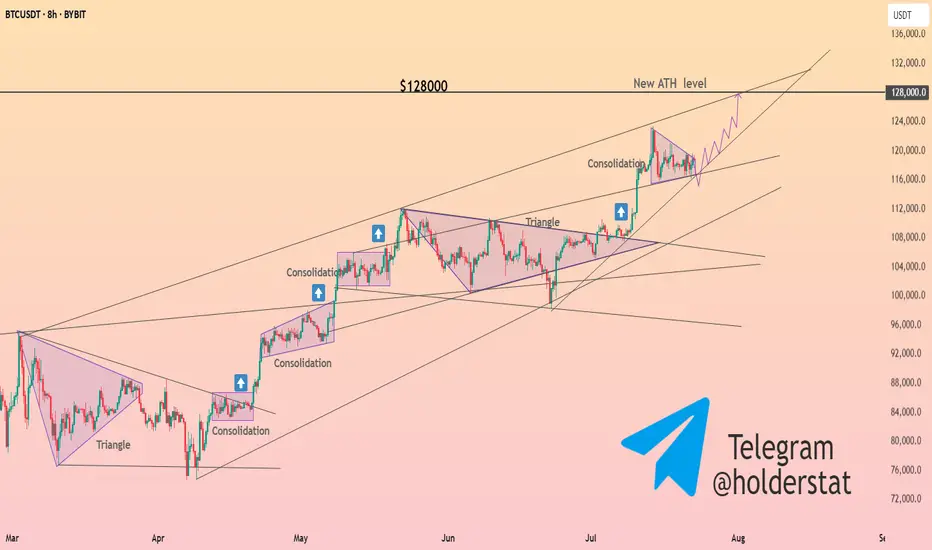
HolderStat┆BTCUSD consolidatedBINANCE:BTCUSDT is consolidating between $129K and $137K. Breakout above $137K could lead to new highs. Key support remains at $125K.
Guys. Thoughts?Just having a conversation with a trading jedi master and then they taught them to set a buy stop with heavy risk above the lower high at the top of the market cycle in the sell side of a previously resolved block after exceeding the statistical high of the dealers range for the day. Just for some more insight, this all happened while venus was in retrograde. Hopefully that paints a clear enough picture. Don't hesitate to ask questions.
Signing off, yours faithfully,
ChartCharmer.
BTC - LTF Breakout? Here is an update to our last post:
After monitoring for a breakout we are seeing early signs of just that.
We saw a rejection from yesterday's test but this morning have broken above our white dotted line with the first breakout candle. Now with this 4H candle we could be seeing the confirmation breakout. After wicking down the bulls have pushed price back up where the candle is holding support above the white dotted trendline.
Technically this current 4H candle would be considered a bearish candle, but due to the circumstances it could easily be negated.
If price does fall in the next 4H period and we do not see another close above the white dotted line, then this would be considered a fakeout and we would most likely see much lower prices. However, what we want to see is price push above this current candles 4H high which would negate the bearish candle and most likely start the rally towards our yellow line target.

Trading plan for BitcoinLast week, Bitcoin established a new ATH at $123k before entering a corrective phase. The price action has since developed into a clear consolidation pattern and currently trades below the weekly pivot point.
Key Observations:
Proximity to last week's low increases probability of a full ABC correction targeting $113k
Break above noted resistance could invalidate bearish scenario and suggest ATH retest
Critical Levels:
Resistance: $119,500
Support: $113,000 (ABC target)
Trade the range until the market declares its next direction.

BTC - Sideways forever?!Compressing really hard here on BTC, look at:
- volume range becoming very concentrated, clean pingpong between VAL and VAH
- H4 trend compressing to almost a single point
- you can see from the purple lines that only internal liquidity is being taken on both sides
imo this sets us up for a potential fake out setup. There is so much liquidity on both sides in this small range, that on a very clean sfp of one side, the other side would have to rush out which pushes price quickly to the other side. We saw a little bit of that already with the sweep during the asia session today.
Of course the sfp needs to be valid, wait for a reclaim setup, there is always the chance the breakout/breakdown is valid, you don't want to be on the wrong side of that either.
BTC/USDT Analysis: Rotation Continues
Hello everyone! This is a daily analysis from a trader-analyst at CryptoRobotics.
Yesterday, Bitcoin continued to rotate within a narrow sideways range, and so far, there has been no breakout. We retested the lower boundary of the range and once again saw absorption of market selling at that level.
At the moment, the scenario remains valid — we expect a breakout to the upside. Several factors support this outlook: strong defense at the lows, delta absorption across the entire range, and buyer control on the most recent local upward wave.
A less likely scenario is a dip into the lower buy zone, a liquidity grab, and another attempt to move higher.
Buy Zones:
~$115,000 (zone of initiating/pushing volumes)
$110,000–$107,000 (accumulated volumes)
This publication is not financial advice.

BTC / USDT near to breakout from trendline resistanceBTC is testing its trendline resistance after a steady buildup. A successful breakout could trigger a strong move toward the $122,000–$125,000 range. Worth watching closely in the coming sessions.
Game Over. Bear market incomingYou can hate all you want. Historically I'm right. Bull run ends in July.
Save this and come back to it.
btcIn h1 time frame the price is indecision phase which makes traders more careful to take position in market. Support area is obvious.
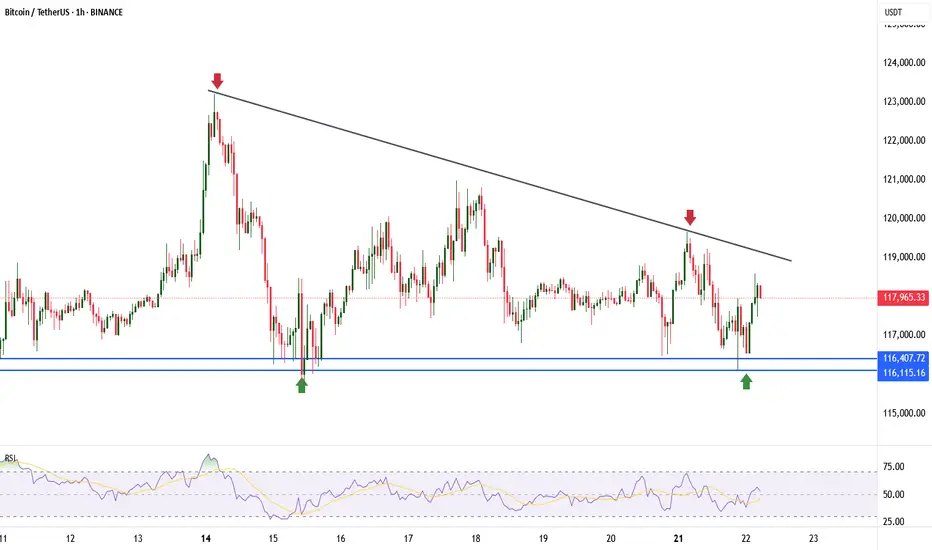
Bitcoin support and resistance areas to observeI've identified some very clear support and resistance areas that could provide some gains on the daily chart.
If it breaks the upward resistance line then the next stop could be all time high resistance.
If it breaks the downward support line then the next stop could be $111,600 area.
One to watch over the next few days to see if it respects those lines.

Crypto Market: What You MUST Know Today!⚠️ Crypto Market: What You MUST Know Today!
📌 Risk Management is 🔑
As we said yesterday, in a market like this, risk management, break-even planning, and timely profit-taking are essential. Every position should come with a clear and structured plan.
📰 Major Fundamental Updates
🔻 Bitcoin has dropped below $117,000 today.
👉 Main reason: Profit-taking after recent gains.
💸 Over $131 million has been withdrawn from Bitcoin ETFs in recent days, adding selling pressure to the market.
🎤 Jerome Powell is scheduled to speak today. The market is nervous he might hint that interest rates will stay high. Investors are on hold.
⚖️ Key crypto regulation bills in the US are facing setbacks. Legal uncertainty is keeping investors cautious.
💰 Capital is rotating from BTC into altcoins. Solana is up 🚀, while Ethereum and Ripple are slightly down.
📉 Technical indicators like RSI and MACD show overbought conditions. The market is correcting now, and the uptrend is weakening.
🏛️ A crypto policy report from the White House is expected today. Many are waiting for clarity before taking big steps.
📊 US inflation remains high → The Fed is unlikely to cut rates soon. Crypto markets need looser monetary policy to thrive.
💥 A large number of leveraged long positions are concentrated around $115,000. If BTC falls further, liquidations may cause additional selling pressure.
♦️ BTC Technical View
The weekly chart shows both buying and selling pressure.
Strong buy wicks indicate active buyers around the $114K–$116K zone.
If price breaks below this level sharply, expect a deeper drop.
If the price approaches this zone slowly, buyers (both takers and makers) may step in to defend it — potentially triggering the next leg up.
⚠️ Important Note
❌ No short positions in our strategy.
Even if price drops, our plan is: “No problem, we missed it 😄”
Our approach = No shorting at these levels. Stay disciplined. 💪
♦️ BTC Dominance (BTC.D)
📉 After a sharp drop, a bounce to 62.15–63.63 is possible.
Once this correction completes, we’ll watch for altcoins that are still ranging and getting ready to break out.
📈 If BTC starts printing green candles with rising volume:
➡️ Focus on altcoins in your watchlist near breakout levels.
📌 Two Main Scenarios:
• ✅ BTC breaks $120K and dominance drops → Early signs of altseason
• ❌ BTC drops and dominance rises → Altcoins likely to drop further
♦️ USDT Dominance (USDT.D)
🔁 Yesterday’s session didn’t break above 4.14 → No bullish confirmation for BTC or alts yet.
📈 If 4.26 breaks upward → Expect more correction across the market.
📉 If 4.14 breaks downward → We may stay in our positions with more confidence.
✅ What to Watch For Today
📊 Jerome Powell’s speech
📰 White House crypto policy report
📉 USDT.D movement at 4.14 / 4.26
🔍 BTC price action near the $114K–$116K zone
🚀 Altcoins approaching breakout levels
🚀 If you found this helpful:
👉 Tap the rocket to support
🔔 Follow for clear, no-hype market updates
💬 Drop your thoughts in the comments!

BTC Weekly Recap & Outlook 20/07/2025📈 BTC Weekly Recap & Outlook
Market Context:
Price continued its bullish momentum, fueled by institutional demand and supportive U.S. policy outlook.
We captured solid profits by following the game plan I shared earlier (see linked chart below).
🔍 Technical Analysis
✅ BTC made a strong bullish move, breaking into new all-time highs.
📊 The daily RSI entered overbought territory, which signaled the potential for a short-term retracement or consolidation.
Currently, price is ranging, and RSI is cooling off. That tells me the market is likely building energy for the next leg up — but not before a significant liquidity run.
🎯 Game Plan
I'm watching for one of two potential setups:
1️⃣ Liquidity Sweep to the Downside
- A run of the daily swing low
- Into the most discounted range (0.75 Fib zone)
OR
2️⃣ Tap into the Weekly FVG Zone (marked with the purple line)
Either move would create the liquidity and energy needed to fuel a breakout above the equal highs (EQHs) marked by the black line.
🚀 Target
First Target: EQHs (Black Line)
Second Target: Price Discovery (new ATHs)
💬 Let me know your thoughts or drop your own chart ideas below!
📌 Follow for Weekly Recaps & Game Plans
If you found this useful, make sure to follow for weekly BTC updates, market outlooks, and detailed trade plans based on structure and liquidity.

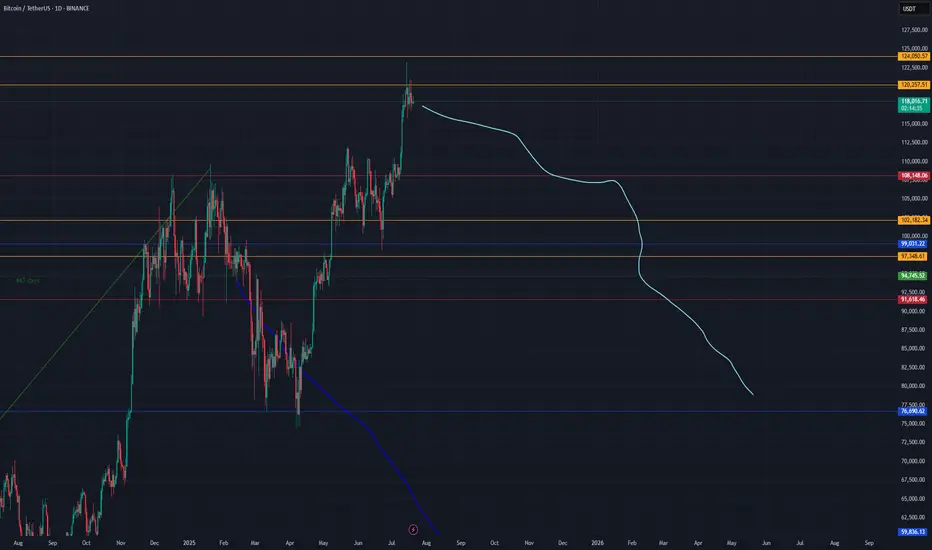
Bitcoin (BTC) Analysis – July 21, 2025We’ve previously discussed the significance of the $110,000 level — a zone where long-term holders typically take partial profits.
After multiple pullbacks from that region, a new wave of short-term investors stepped in around $97,000, managing to push the price as high as $123,000.
⚠️ I know many traders are tracking Bitcoin dominance and expecting a correction from this zone — and I partly agree.
However, issuing a sell signal here feels premature and potentially risky.
✅ Instead, I’d suggest looking for a re-entry opportunity around $95,000, where market structure and buyer activity may offer a much better risk-reward ratio.

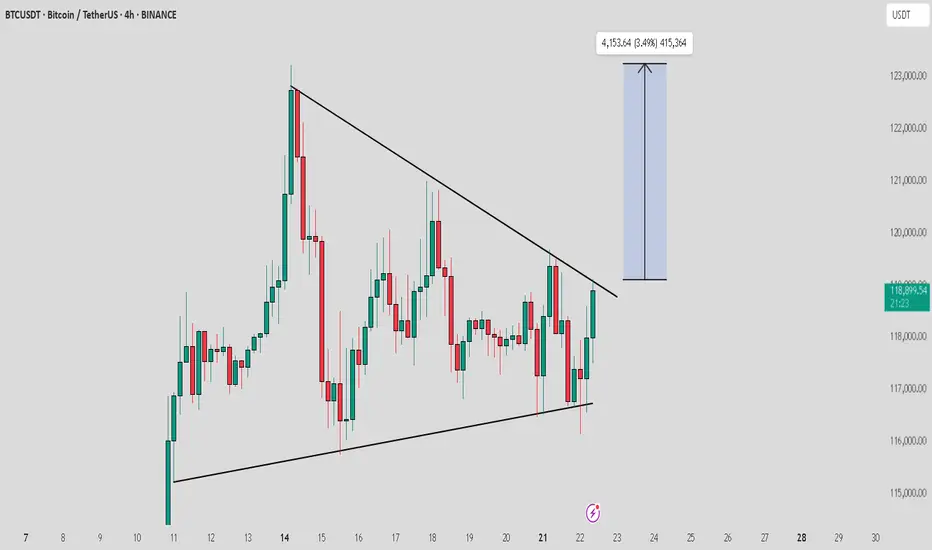
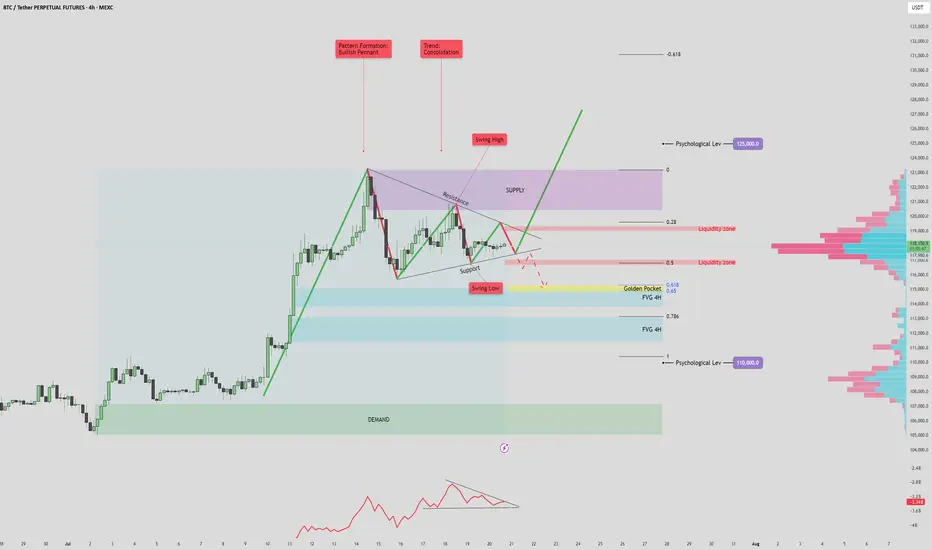
BTC/USDT 125k? or 110k fall again?BTC/USDT 4H Analysis – July 20, 2025
The current market structure shows a bullish pennant forming after a strong impulsive move upward, with price consolidating between key support and resistance levels. This pattern, combined with volume signals and key price zones, suggests a potential for a high-volatility breakout.
🔷 Volume Profile & OBV Insights
The On-Balance Volume (OBV) indicator is forming a symmetrical triangle, indicating a volume squeeze. This suggests a potential sudden spike in volume that could confirm the next major move.
Anchored Volume Profile (VPVR) on the right shows a notable low-volume area between 112K–115K. If price breaks below this zone, it could lead to a rapid selloff toward deeper fair value areas due to reduced liquidity support.
📈 Bullish Scenario
If price breaks above the pennant resistance and 119.5K liquidity zone, it may signal bullish continuation.
A successful retest of the breakout level as support would confirm strength, opening the door to:
Short-term target: 123K (supply zone and previous swing high)
Mid-term target: 125K (key psychological level and potential ATH)
Watch for confirmation via OBV breakout and strong bullish volume. Failure to sustain above the 118K–119K area could signal a bull trap.
📉 Bearish Scenario
A breakdown below pennant support and the 115K level would likely trigger a move into the low-volume range.
First key downside target: 114.7K–115.7K, which aligns with the Golden Pocket (Fib 0.618 zone) and a 4H Fair Value Gap (FVG).
This zone may act as a support or a liquidity grab reversal area.
If this zone fails to hold, deeper downside targets become likely:
FVG 2 (~112K)
Psychological support at 110K, which aligns with strong historical demand and a major VPVR node.
This bearish move may either confirm further downside momentum or present a fakeout opportunity if price sharply reverses from one of these deeper levels.
✅ Summary
BTC is coiled within a bullish pennant, with both bullish continuation and bearish breakdown scenarios in play. Volume confirmation and breakout direction will be key. Traders should monitor how price reacts around the 115K–118K zone for directional clarity. A move beyond this range, especially with volume support, will likely define the next trend leg.
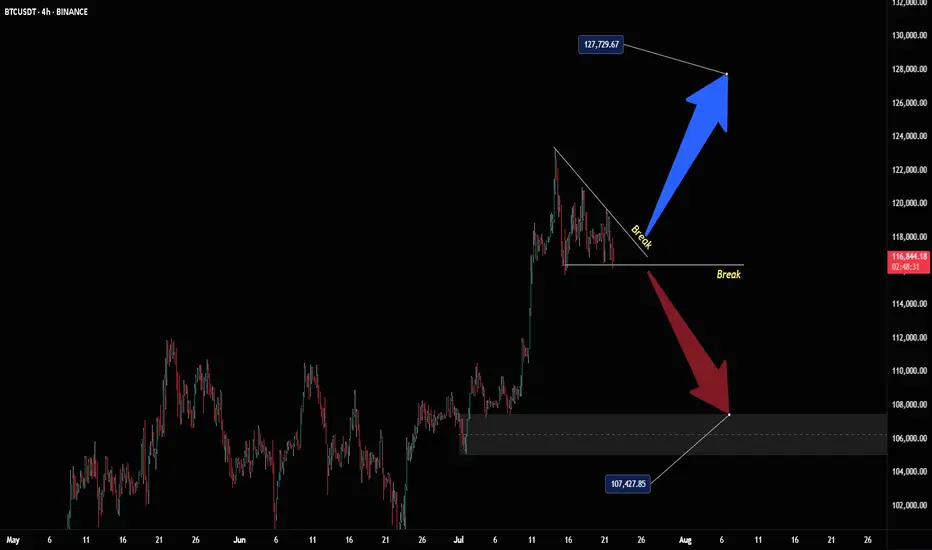
Bitcoin Breakout Bonanza - Ride the Wave, BroYo, check this Bitcoin chart, fam! We’re sittin’ at 107,725, and it’s lookin’ like a wild ride. That break above 127,725 is screamin’ bullish—time to ride the blue arrow up! But watch out, a drop below could send us crashin’ to 107,475 with that red arrow vibe. Stay sharp, dude!
The 3-Step Rocket Booster Strategy Bitcoin Edition🚀 3 Key Features of Bitcoin
Decentralized Network – No central authority like a bank or government controls Bitcoin.
Limited Supply – Only 21 million bitcoins will ever exist, making it scarce and valuable.
Borderless Transactions – Send or receive money globally without needing permission or intermediaries.
✅ 3 Benefits of Using Bitcoin
Freedom from Inflation – Bitcoin resists inflation because of its fixed supply.
Fast & Low-Cost Transfers – Especially useful for international payments.
Financial Inclusion – You don’t need a bank to own or use Bitcoin—just a smartphone and internet.
⚠️ 3 Problems with Bitcoin
Price Volatility – The price can change rapidly in short timeframes.
Scams & Fraud – Many fake crypto projects use Bitcoin’s name to deceive people.
Technical Learning Curve – Beginners may find it hard to understand wallets, keys, and security.
🤔 3 Common Objections
“Bitcoin is too volatile—I might lose money!”
“It’s too complicated for me to use.”
“Governments will ban it eventually.”
💡 3 Ways to Overcome Objections
Use only what you can afford to lose. Start small and grow with knowledge and confidence.
Use beginner-friendly apps like Binance, Trust Wallet, or Paxful. These platforms make Bitcoin easier than ever.
Bitcoin is legal in most countries, and major companies are adopting it—its use is expanding, not shrinking.
🛒 Take Action Now!
Don’t wait for the price to explode again. Learn, test with small amounts, and start your Bitcoin journey today.
👉 Buy Bitcoin now and take control of your financial future!
🚀 The 3-Step Rocket Booster Strategy
🔍 Step 1: Price Above the 50 EMA
What it means: The price is trending upward in the short-to-medium term.
Why it matters: This shows strength and upward momentum—price is above its recent average.
🔍 Step 2: Price Above the 200 EMA
What it means: The long-term trend is also bullish.
Why it matters: This confirms that the overall market direction is up, reducing the risk of fakeouts.
🔍 Step 3: Volume Oscillator Surge (Volume "Booster")
What it means: There is a spike in volume (measured using a volume oscillator).
Why it matters: Volume confirms that big players are involved. Price moves backed by high volume are more reliable and likely to continue.
✅ Optional Extra Filter: Check if the price has gapped up or if there's a bullish candlestick pattern (e.g. Marubozu, Engulfing, Morning Star) to increase confidence.
Rocket boost this content to learn more.
Disclaimer:Trading is risky please use a simulation trading account before you trade with real money.Also learn risk management and profit taking strategies.

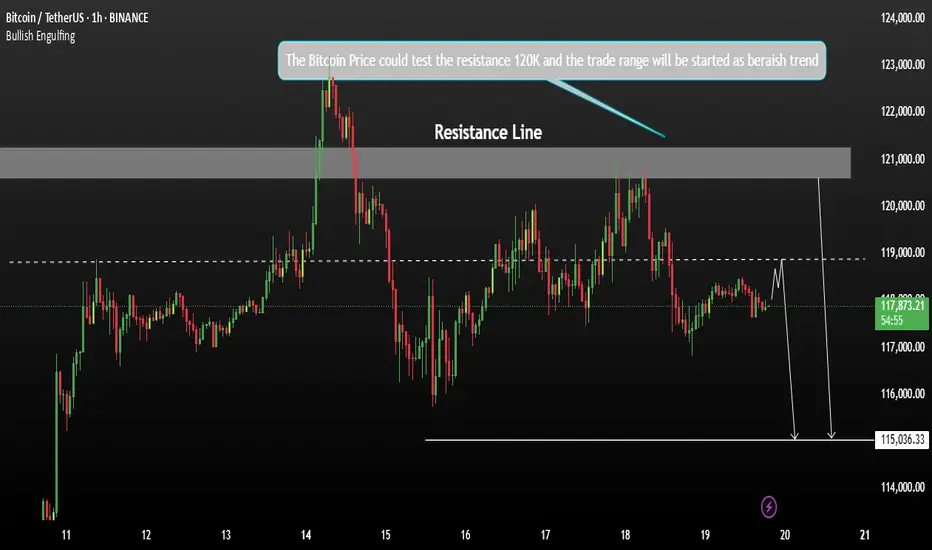
Bitcoin Price Could test resistance 120K After DeclineBitcoin is consolidating within a range — not showing strong directional momentum yet — and is testing the resistance zone between 120K and 121K.
This is a critical supply zone, where buyers were previously liquidated. It’s a psychological level and might trigger profit-taking or heavy resistance from sellers. If BTC fails to break and hold above the 121K zone, there’s a high probability of a pullback toward the 116.2K–117K area to grab liquidity before a new move.
Former President Donald Trump signing new crypto laws could introduce market-moving fundamentals. However, the impact on price will depend on the content of those regulations:
You may find more details in the chart Ps Support with like and comments for better work.
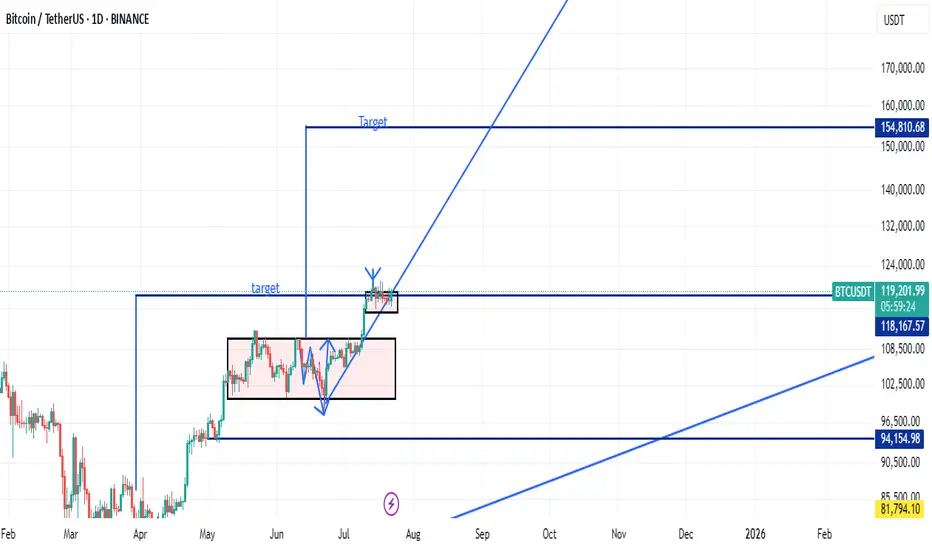
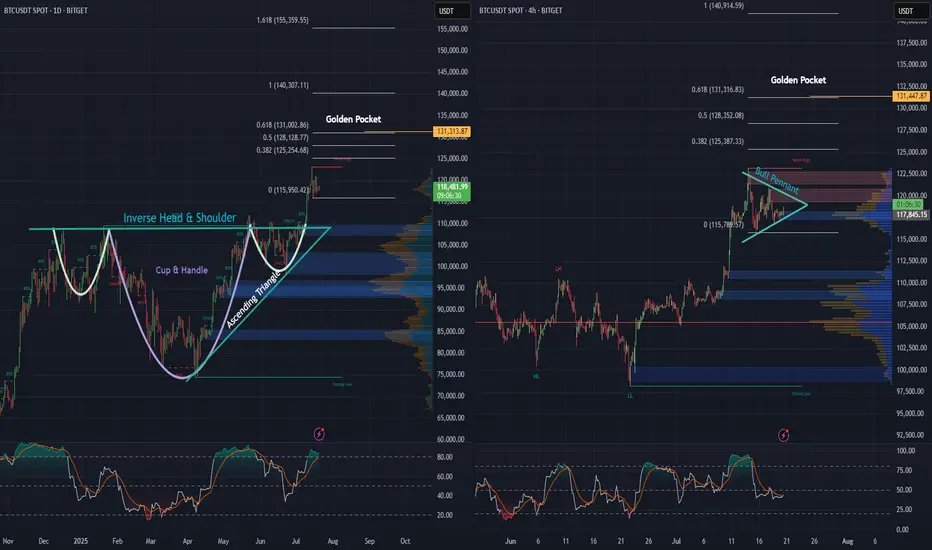
BTC daily, and 4 hr. Bullish Patterns Stack Up!Looking at the Daily and 4-hour charts for BTC, we can see multiple bullish formations unfolding.
An inverse head and shoulders - daily
A cup and handle - daily
An ascending triangle - daily
Price action looks strong, as we’ve begun the breakout from the neckline on the inverse H&S, as well as the cup and handle and ascending triangle simultaneously, and momentum is building fast.
Also, on the 4-hour chart, there’s a pretty substantial bull pennant taking shape. A breakout here could be the next leg up, and the push needed to keep momentum alive.
Zooming out, when we apply the trend-based Fibonacci extension, it reveals a $131,000 golden pocket, on both the the daily as well as the 4 hr. And that could be a major upside target if these bullish structures hold.
Stay tuned to see if BTC continues its move and sets a new all-time high.
BITCOIN FINAL WARNING BEFORE HUGE MOVE!!! (urgent) Yello Paradisers! I am Sharing with you my idea about #Bitcoin of what's going on with Bitcoin right now: be very careful because the Fear and Greed Index, a special one, is at "Greed". We are seeing funding rates, the accumulated funding rates, as extremely positive. We are seeing bearish patterns forming.
In this video, I'm describing the confirmations we are waiting for that will confirm that Bitcoin is about to make a huge movement. Make sure that you are trading with professional trading strategies and that you are waiting for confirmations before any trade execution. Also, make sure that you have tight risk management because only the best, most professional traders will win long-term in this game.
Don't be a gambler. Don't try to get rich quick. Make sure that your trading is professionally based on proper strategies and trade tactics.

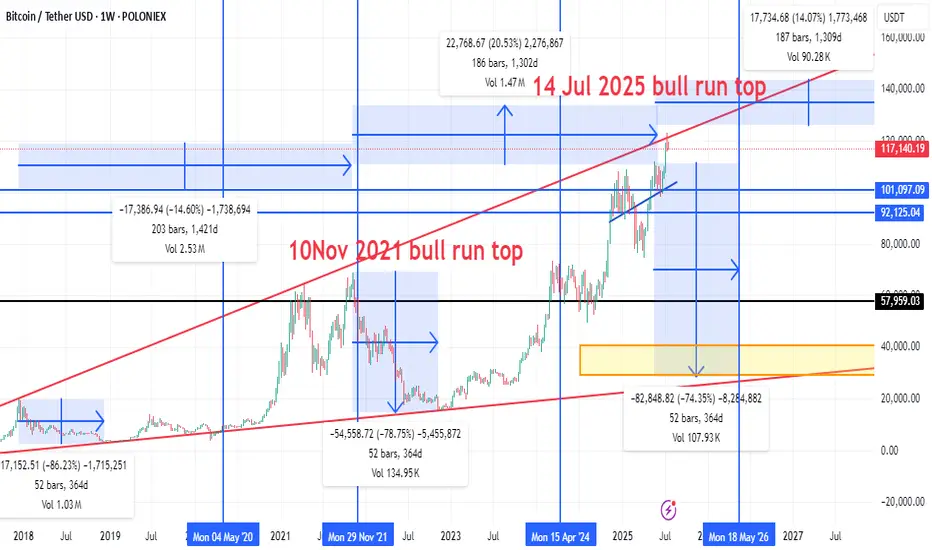
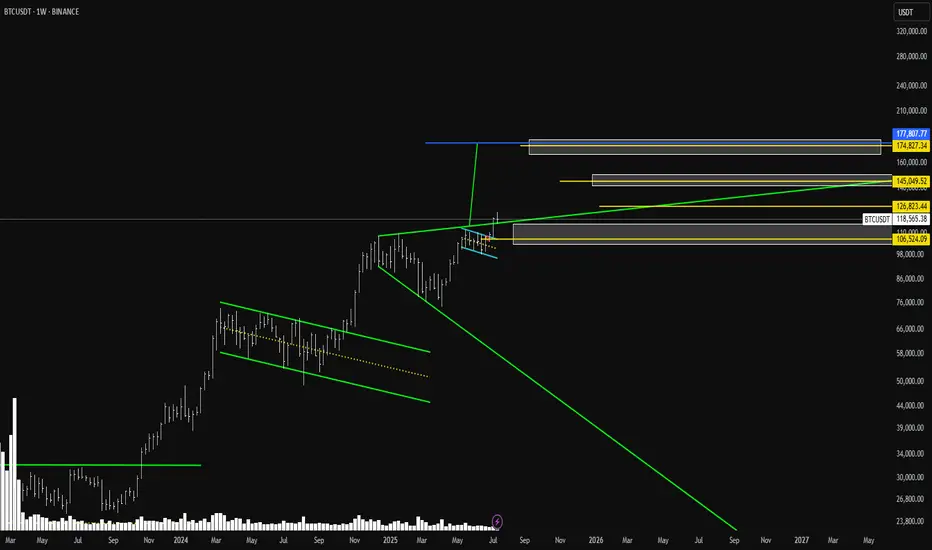
Bitcoin’s “four‑year” halving‑cycle rhythm by overlaying three c🔍 Key Highlights from the Chart
🟢 Bull Market Peaks
10 Nov 2021: Previous cycle top around ~$69,000.
14 Jul 2025 (Projected): Potential new bull market top (approx. $120K–$125K zone based on red trend line projection).
🔴 Bear Market Drops
2021–2022 Crash:
Drop of -78.75% from the 2021 top.
Lasted 52 bars (364 days).
Next Projected Bear Market:
Projected from July 2025 to May 2026.
Expected drawdown: -74.35%, possibly taking BTC down to the $30K–$40K range (orange box support zone).
📉 Correction Zones
Mid-cycle corrections like the one from Apr 2024, showing smaller drops (~20%).
📈 Trend Channel
Red diagonal lines form an ascending channel for bull market tops.
Current price (~$117,872) is nearing upper resistance of this long-term trend channel.
📊 Support/Resistance Levels
$120K & $125K: Horizontal resistance zones.
$57,959: Major historical support (former resistance).
$30K–$40K: Bear market bottom zone based on history and trendline confluence.
⏳ Cycle Timing
Historical cycles span about 4 years:
Peak → bottom → new peak = ~1,300–1,400 days.
This cycle’s timing aligns almost perfectly:
Nov 2021 → Jul 2025 = 1,300+ days (same as past cycles).
Suggests potential top is in or near.
📌 Summary & Outlook
Phase Estimate
Current Price ~$117,872
Projected Top ~$120K–$125K (likely topped 14 Jul 2025)
Next Major Drop -70% to -75% (target: $30K–$40K)
Next Cycle Low Mid 2026 (May–July 2026)
Strong Support Zone $30K–$40K (orange box)
🧭 Strategic Notes
If this chart pattern holds, major profit-taking should already be done or initiated.
Watch for weekly close rejections at trend channel top for confirmation of top formation.
Reentry in mid-2026 would historically offer a high reward/risk zone.