BTC - LTF Pattern IdentifiedIn our previous posts we were outlining the levels for a potential BTC pullback, but after some price development in this region it may be signaling a different story.
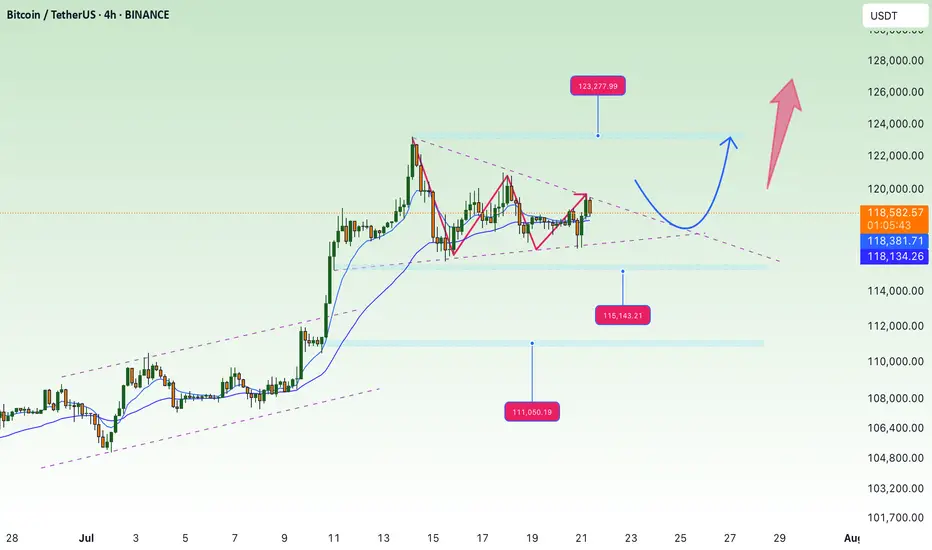
Since our high of $123k we have been forming a downwards sloping trendline of sell pressure (dotted white line). At the same time we have seen bulls continue to buy up the dips in our green box.
This has put price in some sort of symmetrical triangle that is currently testing the upper resistance level for a breakout.
If this breakout is successful then the first target would be $122.8k followed by a potential extended move up to around $130k.
If price fails to breakout and we drop below the LTF accumulation zone then the lower levels outline in the previous posts are still valid. For now monitor for a breakout to the upside.
BTCUSDT trade ideas

Urgent Bitcoin Prediction: Longs Beware!!! Bitcoin longs should be careful, as we are below an important resistance and the market looks bearish. Wait for the confirmations I’ve shown in the video before making any moves! Trade professionally with a proper strategy and well-defined entry tactics!

accumulate, continue to aim for new ATH💎 Update Plan BTC (July 21)
Notable news about BTC
CEO of Charles Schwab, Rick Wurster, said the company plans to deploy Bitcoin and Ethereum transactions for customers.
This company aims to compete with Coinbase, where customers buy BTC.
This development takes place after the progress of cryptocurrencies when President Donald Trump signs the Genius bill into law.
In an interview on Friday, the CEO of Charles Schwab, Rick Wurster, said the company plans to launch Bitcoin (BTC) and Ethereum (ETH) to compete with Coinbase cryptocurrencies. The move took place after President Donald Trump signed the Genius bill, officially confirming the first cryptocurrency law in the United States.
Technical analysis angle
🟠 Main trend:
BTC is sideway accumulated in the amplitude of 117,000 - 122,000 after a sharp increase.
The chart shows the descending triangular model - a potential sign for Breakout.
🔍 important areas:
Resist:
122,000 - 122,700: Strong resistance area, fibonacci mold 1.0.
130,600 - 131,100: The expected area if Breakout is successful (Fibonacci extension 1.618).
Support:
116,000: Support close, coincide with EMA 200.
111,100: The support area is stronger if the current support breaks.
✅ Scenario 1 - Rise:
If the price turns from supporting 116k → Test the resistance area of 122k.
If the 122K break is definitive, the next goal is 130k - 131k.
❌ Scenario 2 - Discount:
If the 116k area is lost, the possibility of falling will fall more deeply at 111k.
This is also the strong EMA area Fibo 0.382 of the previous wave.
Please follow the channel to receive the latest and continuous updates on XauUSD, currency and BTC
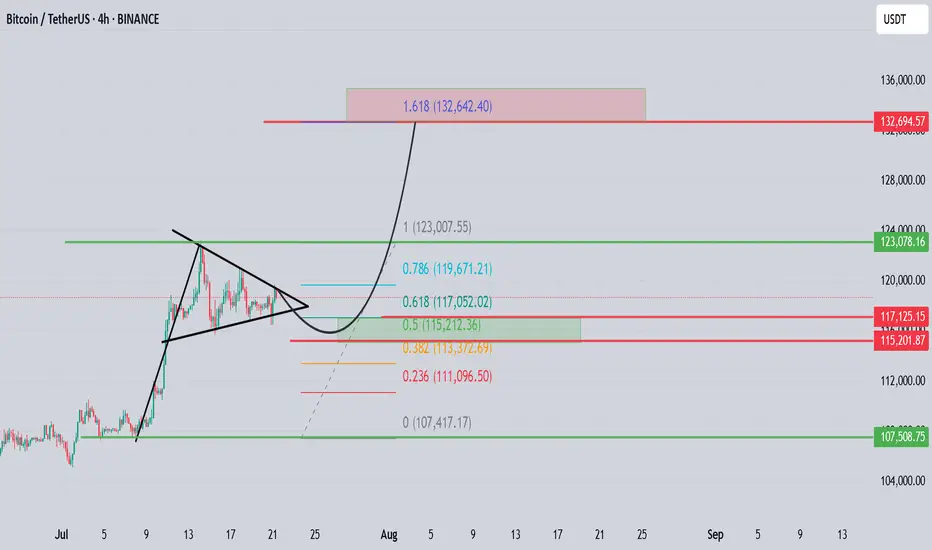
BTCUSDTBitcoin, in case of protection of the long zone, will go to the final breakout to this peak. My vision of the situation and possible risks of short positions from the current ones. The scenario changes when the 0.5 zone is broken
21/07/25 Weekly OutlookLast weeks high: $123,220.24
Last weeks low: $115,718.15
Midpoint: $119,469.19
New BTC ($123,220) & SPX ($6,315) ATH last week! We're really seeing progress being made on all fronts now, bitcoin saw its sixth week of net inflows into BTC ETFs ($2.39B).
The week began strong hitting the new ATH very early and then settled into a tight range to cool off. Altcoins however surged in relation to BTC to break out of HTF downtrends and begin to make up lost ground. One of the beneficiary's of this price movement has been ETH, breaking out from a multi year downtrend against BTC and hitting $3,800 in its USD pair.
For this week I do expect much of the same for BTC as momentum is with altcoins for now. However, as those altcoins reach HTF resistance levels it becomes very important for Bitcoins chop to be accumulation for the next leg up and not distribution for the way down. With so few pullbacks the threat of a sudden correction is present but the probability drops should BTC look to press higher with strong demand.
The ECB Interest rate decision takes place on Thursday but no changes to the 2.15% rate is forecast. In terms of news there are no planned upsets that I can see.
Good luck this week everybody!

Bitcoin Trading Update: Consolidation, Patterns, and What's NextHey Fellow Traders! 👋
Bitcoin (BTC) has been on a wild ride after hitting its all-time high (ATH)! 📈 Since then, it’s been consolidating, generating liquidity, and setting the stage for the next big move. Meanwhile, altcoins are absolutely booming, stealing the spotlight! 💥 As we kick off the week, let’s dive into what’s happening with BTC and what to watch for.
📊 Technical Analysis Breakdown
Here’s what I’m seeing on the charts:
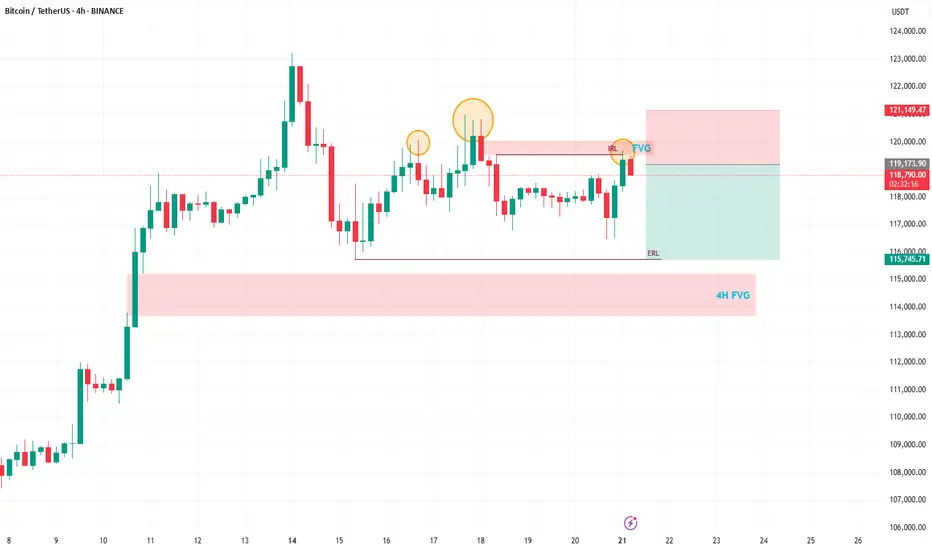
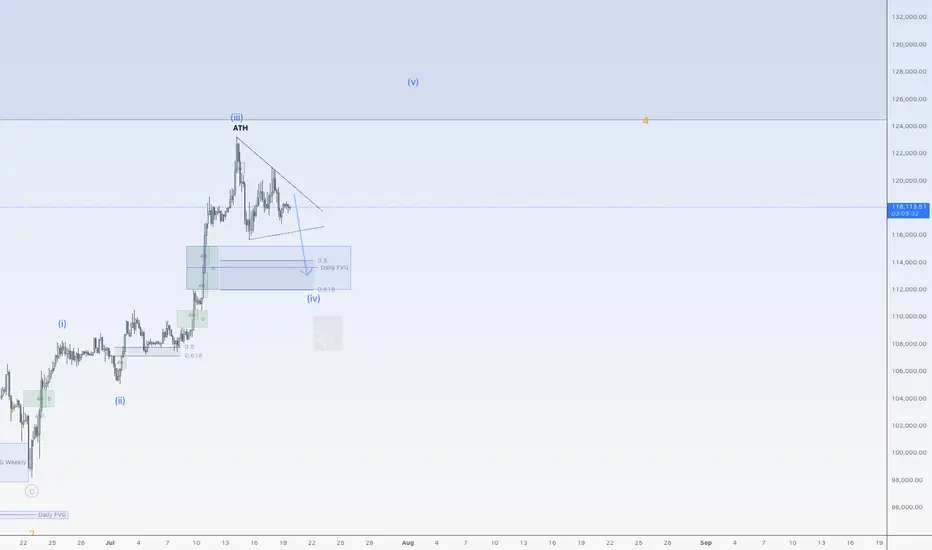
Head and Shoulders Pattern: A clear head and shoulders has formed on BTC, signaling a potential bearish move. 🐻
Daily Timeframe Order Blocks: These are in play, showing key levels of support and resistance.
Filled Fair Value Gap (FVG): A recent FVG on the daily chart has been filled, but there’s still a beautiful 4H FVG waiting to be tested below.
Liquidity Sweep: After the ATH, BTC needs to clear the liquidity from the past few days before it can push for new highs.
🔍 What’s Next for BTC?
I’m expecting a bearish reaction in the near term, with BTC targeting the sell-side liquidity around $115,800. This move should also fill the 4H FVG, setting the stage for a potential bounce and another shot at the ATH. 🚪 Keep an eye on these levels, as they’ll be critical for the next big move!
🔔 Stay in the Loop!
Let’s keep the conversation going! 💬 Follow for more updates, like if you found this helpful, and drop a comment with your thoughts or what you’re seeing in the markets. Are you trading BTC or riding the altcoin wave? Let’s hear it! 👇
Happy trading, and let’s make this week count! 💪
#Crypto #Bitcoin #Trading #TechnicalAnalysis
BTC #Bitcoin (BTC/USDT) 30-minute chartThis Bitcoin (BTC/USDT) 30-minute chart shows price action within a descending parallel channel. Recently, the price broke out above the channel's upper boundary, suggesting a potential bullish breakout. However, the price has slightly pulled back, now retesting the breakout zone near $119,000. Holding above this level may confirm the breakout and lead to further upside, while failure to hold could signal a false breakout and potential return into the channel. Key support and resistance levels are marked around $116,000 and $121,000 respectively.
thanking you

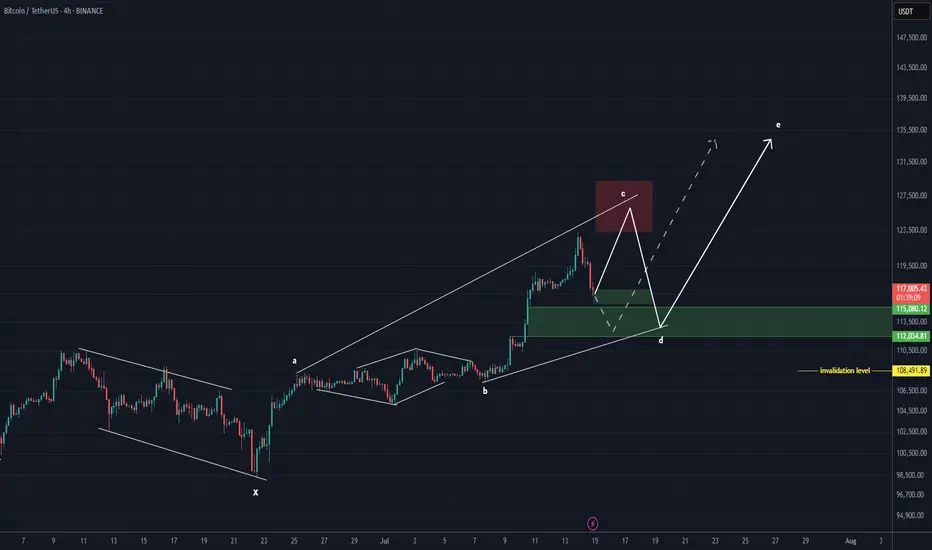
Bitcoin is still bullish (4H)Bitcoin appears to be in a dual bullish structure, currently in the second bullish phase following wave X.
Considering the expansive nature of the correction in the second pattern, it seems we are within an expanding triangle or a diametric structure.
Based on the duration of wave C, it appears that the bullish wave of the second structure is not yet complete.
We expect such fluctuations for Bitcoin in the coming period.
A daily candle close below the invalidation level would invalidate this outlook.
For risk management, please don't forget stop loss and capital management
Comment if you have any questions
Thank You
Local Top Confirmed, Short-Term Bearish Pressure BuildingBTC/USDT 1H – Local Top Confirmed, Short-Term Bearish Pressure Building
📍 Timeframe: 1 Hour
📍 Exchange: MEXC
📍 Pair: BTC/USDT
📍 Bias: Short-term bearish, watching for support re-test near 116k
Market Context:
BTC broke out aggressively earlier in the week, pushing above the 120k psychological level before forming a local top near 122k. Since then, we’ve seen:
A strong rejection wick at the top
Lower highs forming
A bearish engulfing candle marking the shift in momentum
Technical Observations:
Bearish Signs:
MACD histogram rolling over, showing fading bullish momentum
QQE MOD flipping red, indicating a shift toward bearish control
RSI crossing below 50 and trending downward — loss of bullish strength
A clean rejection off recent highs, creating a double top feel
Volume on the recent sell candle is higher than average, suggesting strength in the move down
Support Zones to Watch:
116.5k: Prior breakout zone and most recent demand zone
114.8k – 115.2k: Volume consolidation area; if broken, may invite sharper downside
112k: Key structure zone from previous sideways range
Potential Scenarios:
Bearish Continuation (more likely short term):
Break below 116.5k could lead to fast drop to 114.8k support
RSI and MACD momentum align with this move
Look for breakdown confirmation with volume spike + close under structure
Bullish Reversal (less likely unless invalidation):
Hold above 116.5k + reclaim of 118.2k with strength
RSI must turn up above 50 and MACD histogram flip blue
Could target re-test of 120k–121k if bullish momentum returns
Trading Approach:
Short-term traders may look for pullbacks to short under 118k with 116.5k as the first target
Swing traders should be cautious and wait for confirmation at 116k–115k zone before considering long re-entries
Avoid chasing breakouts — let the market confirm direction first
Conclusion:
BTC on the 1H chart shows signs of exhaustion after a strong run. The market is leaning toward a correction phase. Watch the key support levels — they will dictate whether this is a short-term dip or the start of a deeper move.

**BTC/USDT Monthly Analysis: Navigating Key Resistance****Overview:**
On the monthly timeframe, Bitcoin (BTC) is exhibiting significant strength as it approaches a pivotal historical resistance zone. This multi-year resistance, ranging approximately from **$115,000 to $120,000**, represents a critical inflection point for the asset.
**Key Observations:**
1. **Historical Resistance Test:** The current price action sees BTC challenging a formidable resistance level that has previously acted as a major ceiling. A decisive breakout above this zone, supported by strong volume, would signal a continuation of the bullish trend towards new all-time highs.
2. **RSI Bearish Divergence:** A notable observation on the Monthly Relative Strength Index (RSI) is the presence of **bearish divergence**. While price has made higher highs, the RSI has printed lower highs, indicating a potential weakening in bullish momentum. This divergence suggests that the current upward move might be losing steam and could precede a healthy price correction or consolidation phase. This is a crucial cautionary signal for long-term holders and potential new entrants.
**Outlook:**
The bullish macro trend for Bitcoin remains intact, yet the confluence of strong historical resistance and a developing bearish divergence on the monthly RSI warrants caution. Traders should closely monitor for a clear break and sustained close above the $120,000 level to confirm further upside. Conversely, a rejection from this resistance zone could lead to a significant retracement to key support levels.
**Disclaimer:** This analysis is for informational purposes only and does not constitute financial advice. Always conduct your own research and manage your risk appropriately.
**M. Kiani**
```ش

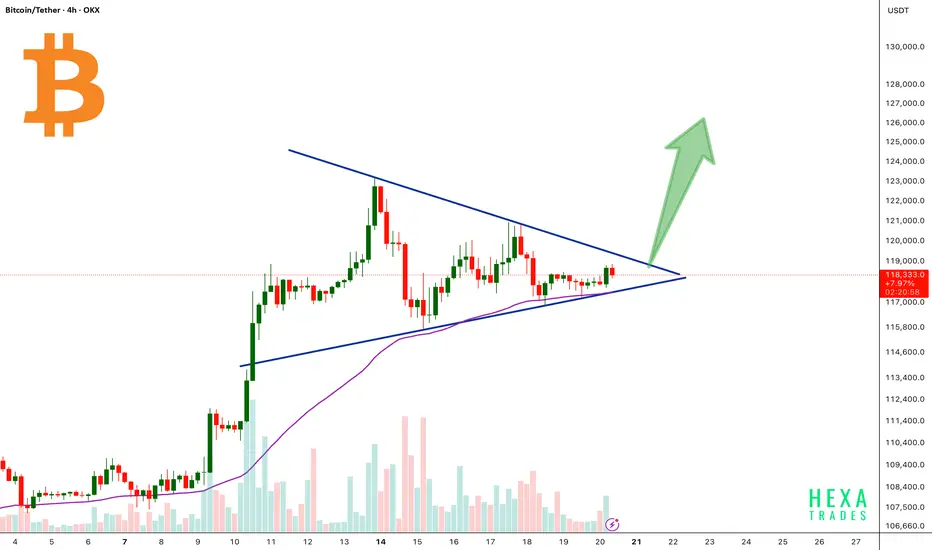
BTC Forming Bullish Triangle!Bitcoin is currently consolidating inside a symmetrical triangle pattern after a strong bullish rally. The price is approaching the apex of the triangle, signaling a potential breakout soon.
The 50 EMA is acting as dynamic support, perfectly aligned with the triangle’s lower trendline, reinforcing the bullish structure.
A confirmed breakout above the triangle resistance could trigger a strong upward move, with a potential target near the $125,000–$130,000 zone.
Cheers
Hexa
BINANCE:BTCUSDT CRYPTOCAP:BTC
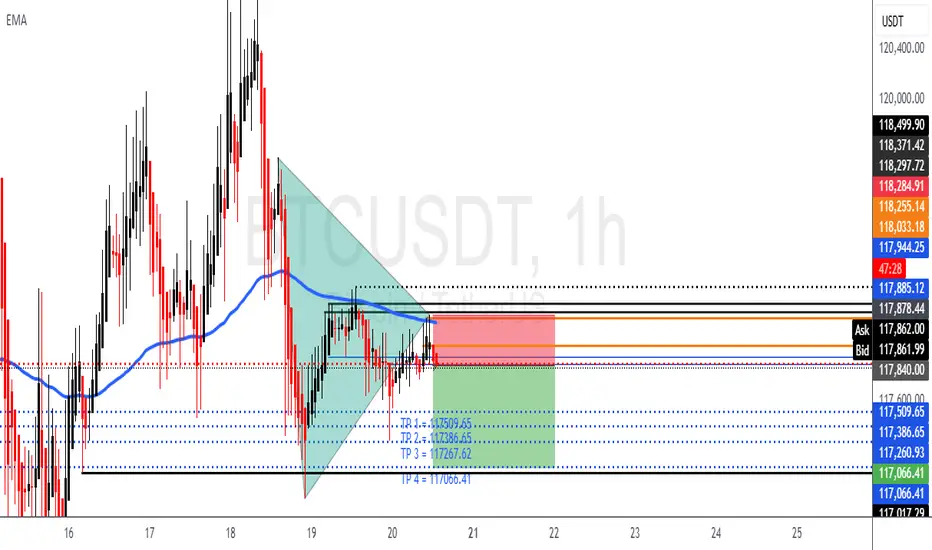
BTCUSD SHORT POSITION = SELLWe can see that BTCUSD consolidated a and ended up given us a possible sell.
To my point of view, we can take a sell position at an Entry = 117878.44 with a proper calculated risk of a SL = 118285.00.
With this short position we can expect to take our profits at the following zones:
TP1: 117509.65
TP2: 117386.65
TP3: 117267.62
TP4: 117066.41
The takes profits are a calculated Risk Reward Ratio of 1.00 to 2.00
It is advisable to use a small lot size or according to your account
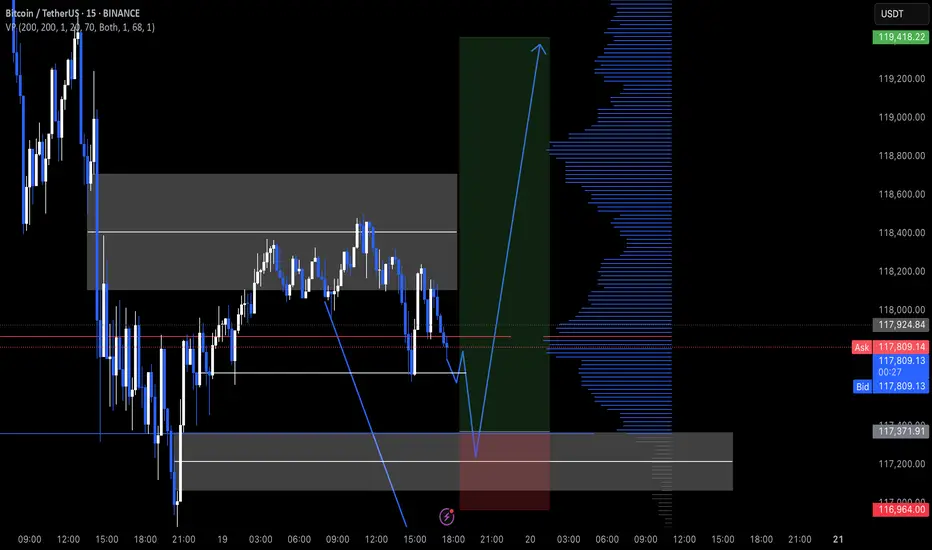
Bitcoin's Critical Zone: Breakout or Breakdown?
✨ Stay ahead of the market — follow for daily crypto insights & smart analysis.
🧠 Think smart. Trade smart.
🚀 Tap the rocket if you're ready for liftoff!
🔍 Bitcoin Analysis (BTC)
📌 Scenario 1:
For BTC to break above 122 this time, it’ll need a real whale push. There are still many micro sellers at that level, and a slow, gradual move like yesterday likely won’t work.
Since buyers already spent their dry powder, they might not have enough left to defend 110 if price gets rejected again.
📌 Scenario 2:
But if price doesn’t attempt 122 again from here, we probably won’t see the 110 bottom either — simply because buyers haven’t deployed capital yet and may be waiting for entries around 115. That forms a potential range between 115 and 122.
🕰️ Daily timeframe:
Market is resting for now.
🎯 Entry trigger: 120.35
If price struggles at this level and BTC dominance isn't strong, we’ll likely shift attention to altcoins.
If BTC gets rejected at 122 and dominance turns red, again — alts may outperform.
💡 Current BTC & ETH positions remain open. No interest in shorts.
As long as we stay above 115, the focus remains on alt/BTC pairs during dips.
📊 TOTAL Market Cap:
🟡 Although we moved above 3.78 yesterday, we don’t call that a breakout — unless price moves away from the level significantly. Right now, it’s still struggling near resistance.
Next key level to watch for a true breakout: 3.91
This is the same region BTC needs a whale to push through.
📈 TOTAL2 – Entry Trigger: 1.05
If any altcoin shows strong momentum and volume before this level breaks (⚠️ low weekend volume is expected), we can consider that a signal.
On Saturdays, volume confirmation is tricky, so we may take small breakout trades using only 0.25% of capital, with fewer positions.
💠 OTHERS.D:
If BTC dominance drops, BTC ranges, and OTHERS.D rises ⬆️
➡️ It suggests that non-top-10 coins are starting to move.
That’s when we should analyze dominance of each top 10 coin individually.
🎯 Entry trigger: 7.80
💵 USDT.D:
No clean level for now, but keep an eye on 3.80 going forward.
🌐 ETH/BTC:
Still bullish, showing no signs of pullback. Price continues to push up.
✨ Stay ahead of the market — follow for daily crypto insights & smart analysis.
🧠 Think smart. Trade smart.
🚀 Tap the rocket if you're ready for liftoff!
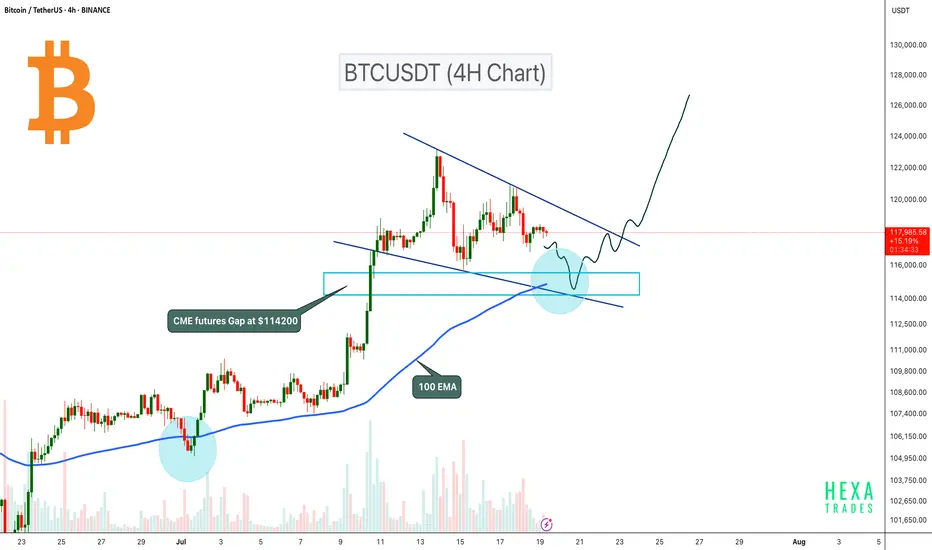
BTC Pullback Expected to $114K Before Next Leg Up!Bitcoin is currently consolidating inside a bullish flag pattern on the 4H timeframe. The price could retest the flag support, where the 100 EMA will act as dynamic support. Additionally, there is a CME futures gap at the $114,200 level, which also aligns with the 0.5 Fibonacci retracement level. Therefore, a retest to the $114,200 zone is likely before the next potential upward move.
A potential bullish reversal could occur if BTC retests this zone and confirms a bounce. A breakout from the bullish flag pattern could signal the next leg up.
Cheers
Hexa🧘♀️
BITSTAMP:BTCUSD CRYPTOCAP:BTC
BTC/USDT 5H – Demand Zone Bounce Targeting $123KBTC/USDT 5H Analysis:
Price is consolidating above a demand zone ($121,031), with a final target around $123,280.

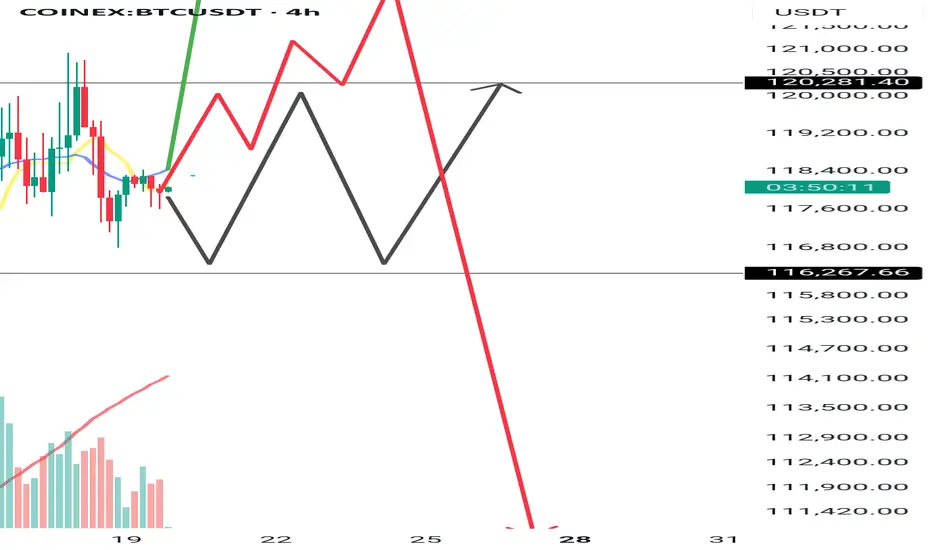
Correction down for BitcoinHi traders,
Last week Bitcoin made a small correction down and up again to finish wave 3 (blue).
After that it started a bigger correction down for wave 4 (blue). This could be a Triangle (no break of previous low) or Zigzag (break of previous low into the bullish Daily FVG).
After the finish of the correction down we could see more upside again.
Let's see what the market does and react.
Trade idea: Wait for the correction down to finish.
Then after an impulse wave up, a small correction down on a lower timeframe and a change in orderflow to bullish you could trade longs.
If you want to learn more about trading FVG's with wave analysis, please make sure to follow me.
This shared post is only my point of view on what could be the next move in this pair based on my analysis.
Don't be emotional, just trade your plan!
Eduwave
BTC/USD Fake out before Pump | Bullish Flag formationBTC/USDT (1D) Market Outlook – July 1, 2025
Introduction
BTC is currently consolidating within a bullish flag pattern after printing a swing high at 108.9K and a recent swing low at 98K. The price sits just below a major supply zone.
Context 1: Key Zones
Supply: 104.6K – 112.1K
Demand: 74.4K – 82.5K
Fair Value Gaps (FVG): 3 zones below price, with one near 88–90K
Context 2: Technical Confluence
Liquidation Zone: 106.2K
Golden Pocket (Fib 0.618): 102.1K
Psychological Levels: 105K and 110K
Context 3: Market Structure
Pattern: Bullish flag
Trend (LTF): Sideways/consolidation
Volume Profile: Heavy activity near 105K–110K
Bullish Scenario
Breaks above 106.2K (liq zone)
Pulls back to 102.1K (golden pocket), forms higher low
Retests resistance for continuation
Alt scenario: clean breakout above resistance → ATH retest
Bearish Scenario
Breaks below 106.2K and flag support
Fills FVG, breaks prior low at 98K
Triggers macro downtrend toward 88–90K zone
Summary
BTC is at a decision point inside a bullish flag, facing supply. A break above 106.2K favors upside continuation, while rejection and a lower low could trigger a deeper retracement. Watch key levels closely.

Bitcoin's Critical Zone: Breakout or Breakdown?
✨ Stay ahead of the market — follow for daily crypto insights & smart analysis.
🧠 Think smart. Trade smart.
🚀 Tap the rocket if you're ready for liftoff!
🔍 Bitcoin Analysis (BTC)
📌 Scenario 1:
For BTC to break above 122 this time, it’ll need a real whale push. There are still many micro sellers at that level, and a slow, gradual move like yesterday likely won’t work.
Since buyers already spent their dry powder, they might not have enough left to defend 110 if price gets rejected again.
📌 Scenario 2:
But if price doesn’t attempt 122 again from here, we probably won’t see the 110 bottom either — simply because buyers haven’t deployed capital yet and may be waiting for entries around 115. That forms a potential range between 115 and 122.
🕰️ Daily timeframe:
Market is resting for now.
🎯 Entry trigger: 120.35
If price struggles at this level and BTC dominance isn't strong, we’ll likely shift attention to altcoins.
If BTC gets rejected at 122 and dominance turns red, again — alts may outperform.
💡 Current BTC & ETH positions remain open. No interest in shorts.
As long as we stay above 115, the focus remains on alt/BTC pairs during dips.
📊 TOTAL Market Cap:
🟡 Although we moved above 3.78 yesterday, we don’t call that a breakout — unless price moves away from the level significantly. Right now, it’s still struggling near resistance.
Next key level to watch for a true breakout: 3.91
This is the same region BTC needs a whale to push through.
📈 TOTAL2 – Entry Trigger: 1.05
If any altcoin shows strong momentum and volume before this level breaks (⚠️ low weekend volume is expected), we can consider that a signal.
On Saturdays, volume confirmation is tricky, so we may take small breakout trades using only 0.25% of capital, with fewer positions.
💠 OTHERS.D:
If BTC dominance drops, BTC ranges, and OTHERS.D rises ⬆️
➡️ It suggests that non-top-10 coins are starting to move.
That’s when we should analyze dominance of each top 10 coin individually.
🎯 Entry trigger: 7.80
💵 USDT.D:
No clean level for now, but keep an eye on 3.80 going forward.
🌐 ETH/BTC:
Still bullish, showing no signs of pullback. Price continues to push up.
✨ Stay ahead of the market — follow for daily crypto insights & smart analysis.
🧠 Think smart. Trade smart.
🚀 Tap the rocket if you're ready for liftoff!

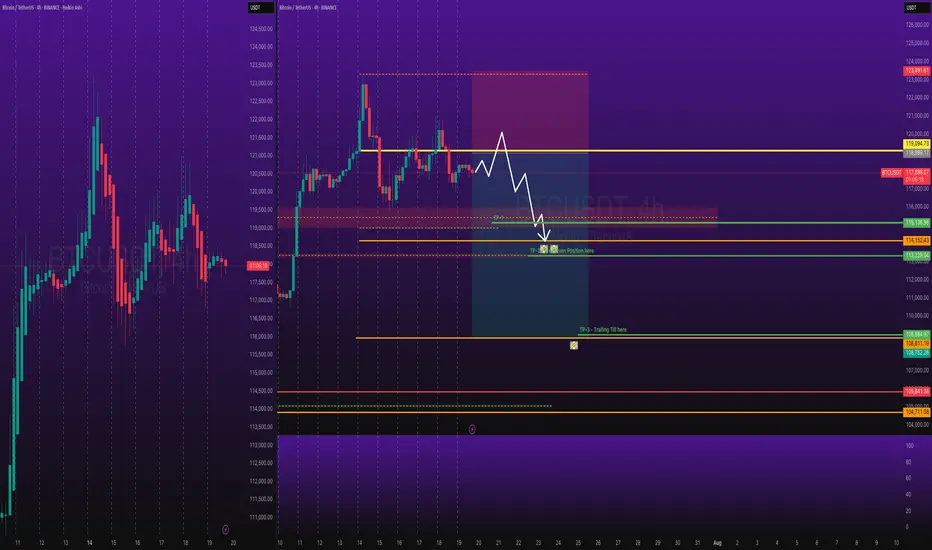
BTCUSDT Short Swing TradeBINANCE:BTCUSDT Short Swing Trade, with my back testing of this strategy, it hits multiple possible take profits, manage your position accordingly.
This is good trade, don't overload your risk like greedy, be disciplined trader.
I manage trade on daily basis.
Use proper risk management
Looks like good trade.
Lets monitor.
Use proper risk management.
Disclaimer: only idea, not advice
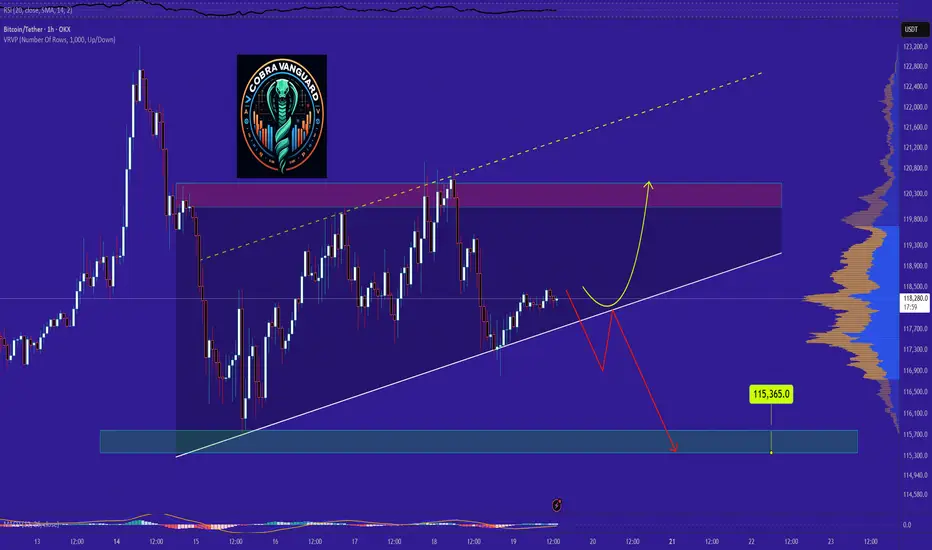
BITCOIN's Situation (1h) !!!The price is within an ascending triangle, which could be encouraging. However, since crypto doesn't always follow patterns, it might break down from below and correct to around $115K!
Best regards CobraVanguard.💚
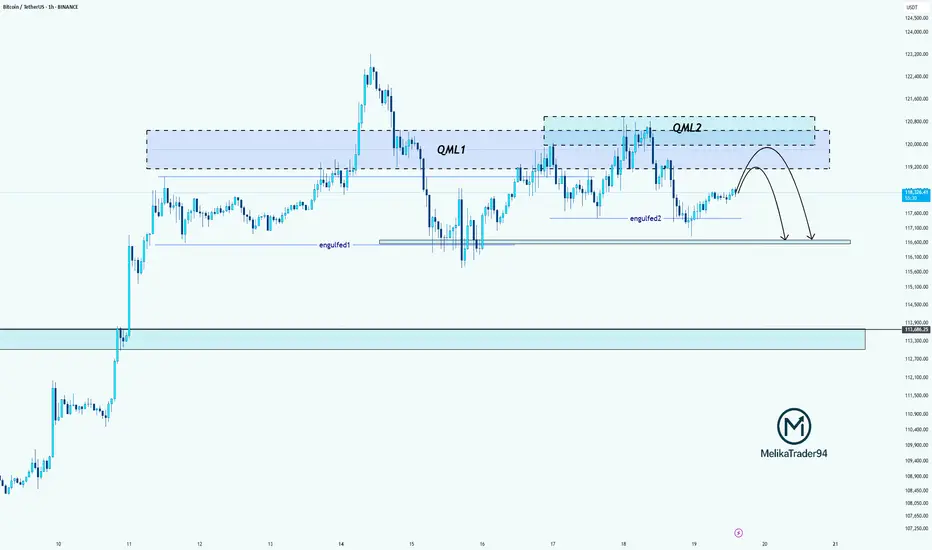
BTC Double QML Setup: Is Another Drop Loading?Hello guys!
Do you remember the last analysis?
Now this BTC chart shows a textbook example of two consecutive QML (Quasimodo Level) patterns forming (QML1 and QML2), each confirmed by clean engulfed lows.
QML1 caused a strong drop after the high was broken and a new low formed.
Price retraced and created QML2, again with a confirmed engulfed low (engulfed2).
We're now likely to see a reaction at the QML2 supply zone.
If price respects this second QML zone, we could see another bearish move toward the 116k zone, possibly lower.
BTC/USDT: Define Your Next Winning MoveHere's the reality: While others panic and second-guess, successful traders recognize the blueprint when they see it.
The Setup That Separates Winners From Losers
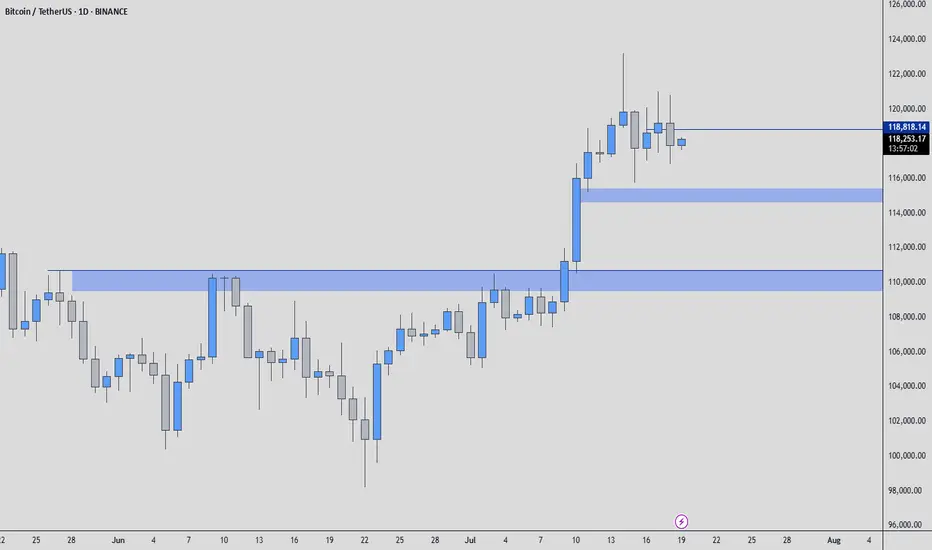
Two major support zones (marked in blue) tell the complete story. My footprint CDV analysis confirms what institutional money already knows - these levels aren't suggestions, they're battle lines.
Your Proven Path Forward
Zone 1: Primary accumulation target - where smart money loads up
Zone 2: Final defense line - where rebounds launch
The Choice Is Simple
Execute at these levels with precision, or watch from the sidelines as others capitalize. My track record speaks for itself - these aren't hope-based predictions, they're data-driven opportunities.
What Happens Next
Follow this blueprint: You position at support, manage risk precisely, and capture the inevitable bounce that follows institutional accumulation.
Ignore it: Watch others profit while you chase price higher later.
Bottom Line
The market has drawn the map. The footprint data confirms the plan. Your success depends on one thing: execution when opportunity knocks.
The zones are marked. The analysis is complete. The choice is yours.