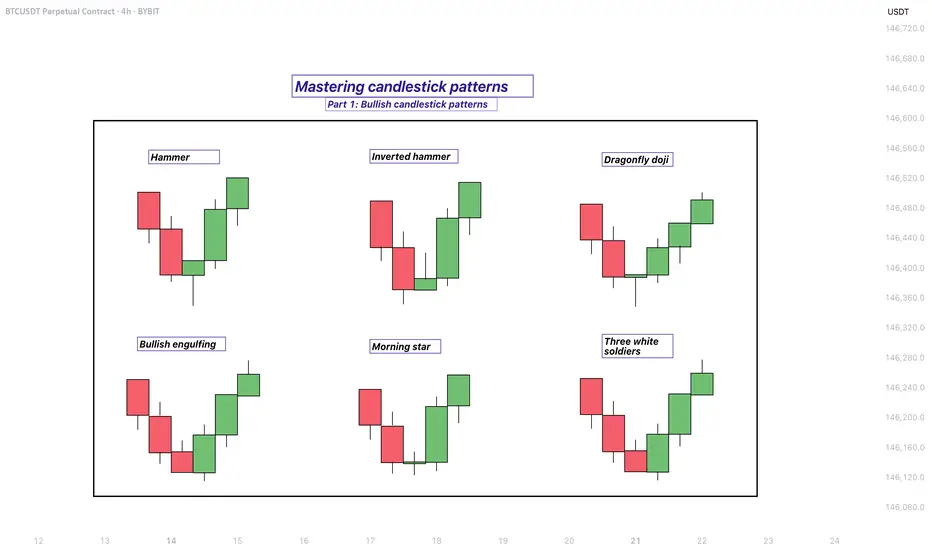
Mastering bullish candlestick patterns - How to use it!In this guide, we will explore some of the most important bullish candlestick patterns used in technical analysis. These patterns are essential tools for traders and investors who want to better understand market sentiment and identify potential reversal points where prices may start moving upward.
What will be explained:
- What are bullish candlestick patterns?
- What is the hammer?
- What is the inverted hammer?
- What is the dragonfly doji?
- What is the bullish engulfing?
- What is the morning star?
- What is the three white soldiers?
- How to use bullish candlestick patterns in trading?
What are bullish candlestick patterns?
Bullish candlestick patterns are specific formations on a candlestick chart that signal a potential reversal from a downtrend to an uptrend. These patterns are used by traders and investors to identify moments when the market sentiment may be shifting from bearish to bullish. Recognizing these patterns can help traders time their entries and make more informed decisions based on price action and market psychology. While no single pattern guarantees success, they can provide valuable clues when combined with other forms of analysis such as support and resistance, trendlines, and volume.
What is the Hammer?
The Hammer is a single-candle bullish reversal pattern that typically appears at the bottom of a downtrend. It has a small real body located at the upper end of the trading range, with a long lower shadow and little to no upper shadow. The long lower wick indicates that sellers drove the price lower during the session, but buyers stepped in strongly and pushed the price back up near the opening level by the close. This shift in momentum suggests that the downtrend could be coming to an end, and a bullish move might follow.
What is the Inverted Hammer?
The Inverted Hammer is another single-candle bullish pattern that also appears after a downtrend. It has a small body near the lower end of the candle, a long upper shadow, and little to no lower shadow. This pattern shows that buyers attempted to push the price higher, but sellers managed to bring it back down before the close. Despite the failure to hold higher levels, the buying pressure indicates a possible reversal in momentum. Traders usually look for confirmation in the next candle, such as a strong bullish candle, before acting on the signal.
What is the Dragonfly Doji?
The Dragonfly Doji is a special type of candlestick that often indicates a potential bullish reversal when it appears at the bottom of a downtrend. It forms when the open, high, and close prices are all roughly the same, and there is a long lower shadow. This pattern shows that sellers dominated early in the session, pushing prices significantly lower, but buyers regained control and drove the price back up by the end of the session. The strong recovery within a single period suggests that the selling pressure may be exhausted and a bullish reversal could be imminent.
What is the Bullish Engulfing?
The Bullish Engulfing pattern consists of two candles and is a strong indication of a reversal. The first candle is bearish, and the second is a larger bullish candle that completely engulfs the body of the first one. This pattern appears after a downtrend and reflects a shift in control from sellers to buyers. The bullish candle’s large body shows strong buying interest that overpowers the previous session’s selling. A Bullish Engulfing pattern is even more significant if it occurs near a key support level, and it often signals the beginning of a potential upward move.
What is the Morning Star?
The Morning Star is a three-candle bullish reversal pattern that occurs after a downtrend. The first candle is a long bearish one, followed by a small-bodied candle (which can be bullish, bearish, or a doji), indicating indecision in the market. The third candle is a strong bullish candle that closes well into the body of the first candle. This formation shows a transition from selling pressure to buying interest. The Morning Star is a reliable signal of a shift in momentum, especially when confirmed by high volume or a breakout from a resistance level.
What is the Three White Soldiers?
The Three White Soldiers pattern is a powerful bullish reversal signal made up of three consecutive long-bodied bullish candles. Each candle opens within the previous candle’s real body and closes near or at its high, showing consistent buying pressure. This pattern often appears after a prolonged downtrend or a period of consolidation and reflects strong and sustained buying interest. The Three White Soldiers suggest that buyers are firmly in control, and the market may continue moving upward in the near term.
How to use bullish candlestick patterns in trading?
To effectively use bullish candlestick patterns in trading, it’s important not to rely on them in isolation. While these patterns can signal potential reversals, they work best when combined with other technical tools such as support and resistance levels, moving averages, trendlines, and volume analysis. Traders should also wait for confirmation after the pattern forms, such as a strong follow-through candle or a break above a resistance level, before entering a trade. Risk management is crucial—always use stop-loss orders to protect against false signals, and consider the broader market trend to increase the probability of success. By integrating candlestick analysis into a comprehensive trading strategy, traders can improve their timing and increase their chances of making profitable decisions.
Thanks for your support. If you enjoyed this analysis, make sure to follow me so you don't miss the next one. And if you found it helpful, feel free to drop a like 👍 and leave a comment 💬, I’d love to hear your thoughts!
BTCUSDT trade ideas
Bitcoin Support: Midline Channel Support at 114kBitcoin
1D
Bitcoin Support: Midline Channel Support at 114k and then Blue Line 110k
With these supports holding in the long term, progress is still possible
BITCOIN - Price can turn around and start to move upHi guys, this is my overview for BTCUSD, feel free to check it and write your feedback in comments👊
The price reversed its prior downtrend with a decisive breakout from a falling channel.
This breakout triggered a strong upward impulse, which then began to consolidate into a large symmetrical pennant.
However, the price recently failed to hold the lower support trendline of this pennant and broke to the downside.
The asset is currently trading just below this broken trendline, in what appears to be a liquidity grab.
To continue upwards, buyers must now overcome the immediate resistance located at the $116300 level.
I expect that this breakdown was a fakeout, and the price will soon reverse, break through the $116300 resistance, and continue its rally toward the $121000 target.

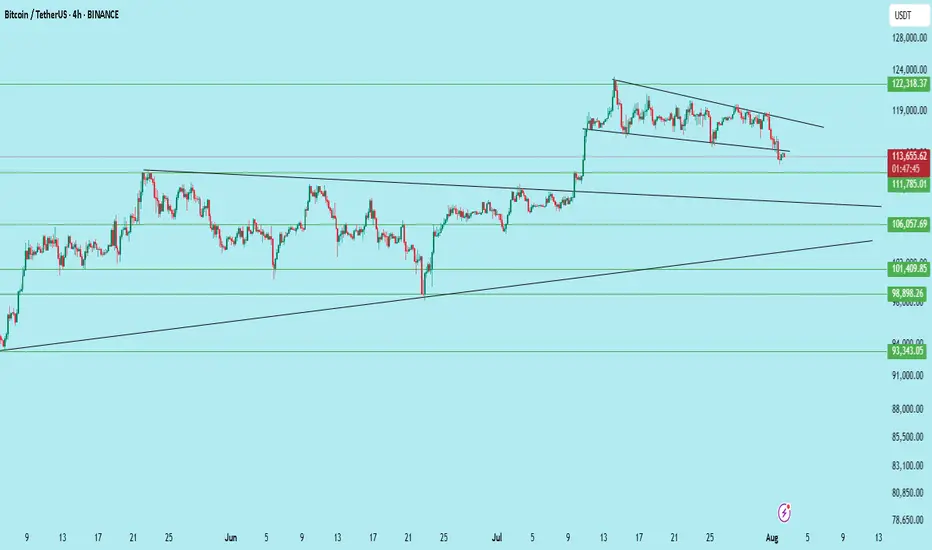
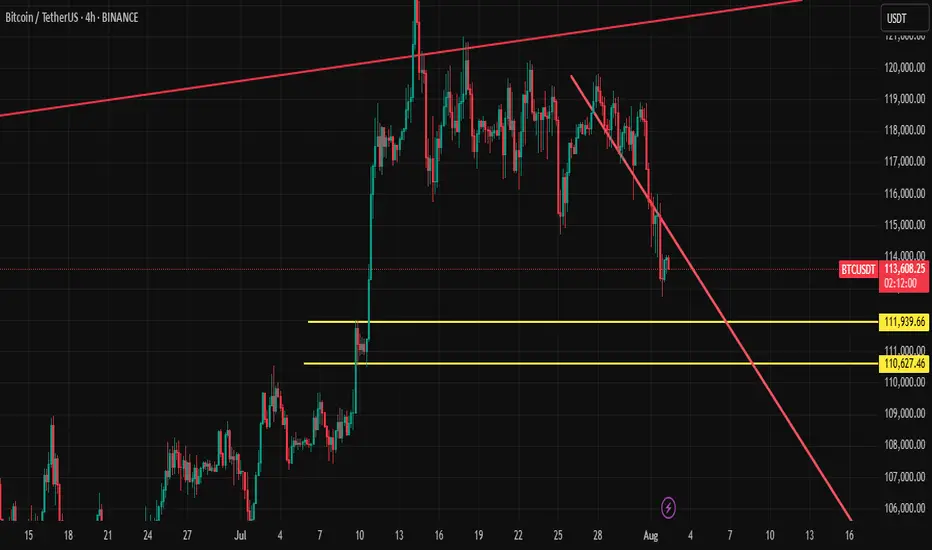
$BTC /USDT – Breakdown from Channel, Bears Gaining ControlBitcoin has broken down from its descending channel on the 4H chart after repeated rejection from the upper trendline. Price is now hovering near key support at $111,785.
Key Technicals:
Rejection from the descending trendline resistance
Breakdown of the mini-channel structure
Current price: $113,637
Support levels:
$111,785 (Immediate)
$106,057
$101,409
$98,398
Bearish continuation is likely if $111,785 breaks with volume
If the $111.7k zone fails to hold, BTC could see further downside toward $106k and even $98k in the coming sessions.
Invalidation: Bullish only on reclaim of $117K+ with strength.
DYOR | Not Financial Advice
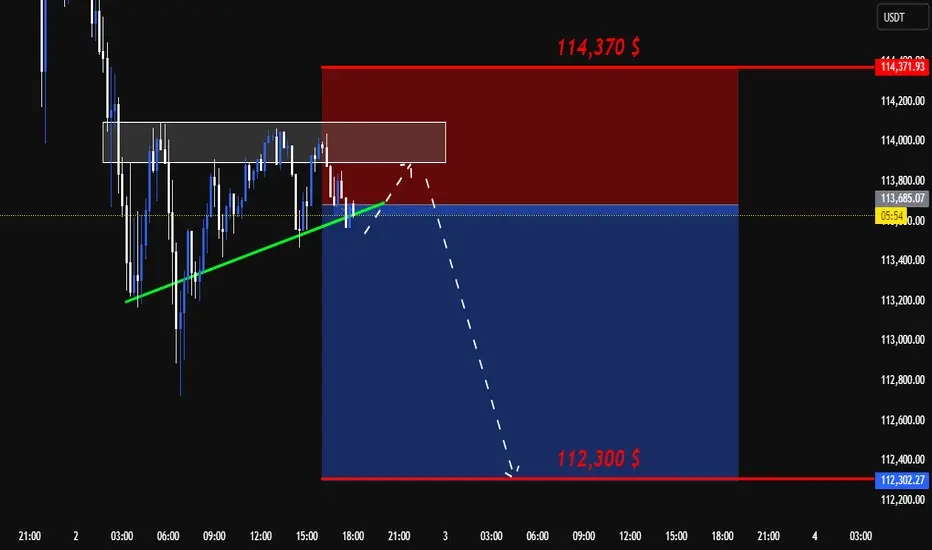
BTC SHORT SETUP INTRADAY ( 02 AUG 2025 )If you have doubt on our trades you can test in demo.
Details:
Entry: 113,680 $ - 113,450 $
Target Price: 112,300 $
Stop loss: 114,370 $
Trade Ideas:
Idea is clearly shown on chart + we have some secret psychologies and tools behind this.
What is required to Join VIP?
- Nothing just you have to share 10% of your profit with us at the end of the month which you earned from our signals. Yeah this is just the requirement, trade where ever you like your favorite broker or else you don't need to pay fees first or create account thru our link.
Trade Signal:
I provide trade signals here so follow my account and you can check my previous analysis regarding BITCOIN. So don't miss trade opportunity so follow must.
BINANCE:BTCUSDT BINANCE:BTCUSDT.P BINANCE:BTCUSD
Bitcoin is Coming to it's Support #BitcoinHello Trader's
Here's some info about selling pattern formed in Bitcoin
Check out this level..
How many off you traded this selling

Deep Dive Into Bollinger Bands 🗓This article explores the Bollinger Bands indicator—a powerful volatility tool used by traders worldwide. You'll learn how it works, how to calculate it, and how to use it to detect potential breakouts, trend reversals, and overbought or oversold conditions in the market.
📚 Introduction to Bollinger Bands
In the fast-paced world of trading, understanding market volatility is key to making informed decisions. Bollinger Bands, developed by John Bollinger in the 1980s, offer a visual and statistical method to measure this volatility. Unlike simple moving averages, which only tell you the trend, Bollinger Bands expand and contract based on recent price action, helping traders spot overbought, oversold, or consolidation phases.
These bands dynamically adjust to market conditions, making them one of the most popular indicators for trend-following, mean-reversion, and breakout strategies. Whether you’re trading crypto, stocks, or forex, Bollinger Bands can help you identify high-probability setups by combining trend direction with volatility.
📚 How Bollinger Bands Are Calculated
Bollinger Bands consist of three lines:
Middle Band – This is a simple moving average (SMA) of the price, typically over 20 periods.
Upper Band – The middle band plus two standard deviations.
Lower Band – The middle band minus two standard deviations.
Middle Band = SMA(n)
Upper Band = SMA(n) + (k × σₙ)
Lower Band = SMA(n) - (k × σₙ)
Where σₙ is the standard deviation of the price for n periods and k is the multiplier, typically set to 2, which captures ~95% of price action under normal distribution. The middle band shows the average price over the last 20 candles. The upper and lower bands adjust based on how volatile the price has been — expanding in high volatility and contracting in low volatility.
🤖 For those traders who want to implement Bollinger Bands into algorithmic strategy we provide formula it's calculation in Pine Script:
basis = ta.sma(src, length) // Middle Band (SMA)
dev = mult * ta.stdev(src, length) // Standard Deviation × Multiplier
upper = basis + dev // Upper Band
lower = basis - dev // Lower Band
📚 How to Use MACD in Trading Strategies
⚡️Bollinger Band Squeeze (Volatility Contraction and Expansion)
The idea is pretty simple, а squeeze indicates low volatility and often precedes a breakout. The squeeze is the situation when the Upper Band and Lower Band contract, and BB width is at a local minimum. In this case you shall be prepared for the high volatility after the period of low volatility. This strategy doesn’t predict direction — it prepares you for volatility.
Long setup:
Price is in long-term uptrend, you can use 200 EMA as a major trend approximation - price shall be above it.
Bollinger Bands is narrow in comparison to the previous period. Price usually is in sideways.
Open long trade when candle shows a breakout and closes above the Upper Band.
Set a trailing stop-loss at the Middle Band.
Short setup:
Price is in long-term downtrend, you can use 200 EMA as a major trend approximation - price shall be below it.
Bollinger Bands is narrow in comparison to the previous period. Price usually is in sideways.
Open short trade when candle shows a breakdown and closes below the Lower Band.
Set a trailing stop-loss at the Middle Band
📈Long Trading Strategy Example
1. Price candle shall be closed above 200-period EMA. In our example we have BITMART:BTCUSDT.P 4h time frame.
2. Bollinger Bands shall be narrow in comparison with the previous periods.
3. Open long trade when candle closes above the Upper Band.
4. Close trade when price touched the Middle Band.
📉Short trading strategy example
1. Price candle shall be closed below 200-period EMA. In our example we have BITMART:BTCUSDT.P 4h time frame.
2. Bollinger Bands shall be narrow in comparison with the previous periods.
3. Open short trade when candle closes below the Lower Band.
4. Close trade when price touched the Middle Band.
⚡️Mean Reversion (Rebound from the Bands)
This is the most common approach to use Bollinger Bands. The idea is also very simple, we just want to open long if price touches Lower Band and short if price reaches Upper Band. Price tends to revert to the mean (Middle Band), especially in range-bound markets. It's very important to trade in the direction of the major trend to reduce the probability of the large move against you.
Long setup:
Price is in long-term uptrend, you can use 200 EMA as a major trend approximation - price shall be above it.
Open long trade when price touches the Lower Band.
Set the initial stop-loss at the fixed percentage below entry price. Choose this percentage number with your personal risk/money management, you shall be comfortable to lose this amount of money in case of stop-loss hit.
If price reached Middle Band set stop-loss at breakeven.
Close trade when price reached the Upper Band.
Short setup:
Price is in long-term downtrend, you can use 200 EMA as a major trend approximation - price shall be below it.
Open short trade when price touches the Upper Band.
Set the initial stop-loss at the fixed percentage above entry price. Choose this percentage number with your personal risk/money management, you shall be comfortable to lose this amount of money in case of stop-loss hit.
If price reached Middle Band set stop-loss at breakeven.
Close trade when price reached the Lower Band.
🧪 Important: the most common approach to close trades is the Middle Band touch, this is classic mean reversion. We experimented multiple times with different approached and revealed that usually it's better to take profit at the Upper/Lower band for long/short trades and use Middle Band only for setting stop-loss at breakeven. This approach provides better risk to reward ratio.
📈Long Trading Strategy Example
1. Price candle shall be closed above 200-period EMA. In our example we have BITMART:BTCUSDT.P 4h time frame.
2. Open long trade the Lower Band.
3. Put Initial stop-loss 2% below the entry price.
4. When price reached Middle band place stop-loss at the breakeven.
5. Close long trade at the Upper Band.
📉Short trading strategy example
1. Price candle shall be closed below 200-period EMA. In our example we have BITMART:BTCUSDT.P 4h time frame.
2. Open short trade the Upper Band.
3. Put Initial stop-loss 2% above the entry price.
4. When price reached Middle band place stop-loss at the breakeven.
5. Close short trade at the Lower Band.
🧪 Important tip: notice that initial stop-loss is needed only to avoid disaster in case of price moves strongly against you. This percentage shall give enough space to avoid its reaching too often. Mean reversion strategy provides fast trades with the small average gain, so you shall maintain the high win rate (perfectly above 70%). You have to choose stop-loss based on particular asset volatility.
⚡️Combined Approach: Mean Reversion + Trend Following
Skyrexio made multiple researches about Bollinger Bands strategies and we found that we can receive better gains in combination of different approaches. Mean reversion gives you great entry with discount but you don't need to exit that early. Use the trading stop and allow to gain profit while market is moving in your direction.
This approach you can find in our advanced strategy Bollinger Bands Enhanced Strategy which we shared in 2024. Click on the link to read about it and understand how you can combine best features of this popular indicator.
📚 Conclusion
Bollinger Bands are more than just a volatility indicator — they provide a flexible framework for understanding price dynamics and market conditions. By visualizing the relationship between price and standard deviation around a moving average, traders can gain valuable insights into whether an asset is consolidating, trending, or preparing for a breakout.
The real strength of Bollinger Bands lies in their versatility. They can adapt to different trading styles — whether you’re a short-term scalper, a swing trader, or a long-term position holder. From identifying squeeze setups to riding strong trends or capturing mean reversion moves, BBs offer a strategic edge when used correctly.
However, Bollinger Bands should never be used in isolation. Like any technical tool, they work best when combined with momentum indicators like RSI or MACD, volume analysis, and price action signals. Context is key: a signal that works well in a ranging market may fail during high momentum trends.
Ultimately, Bollinger Bands help traders make more informed, disciplined decisions by clarifying where price stands relative to recent history. When paired with sound risk management and broader market awareness, they become a powerful ally in navigating market uncertainty.

BTCUSDT: Elliot Wave AnalysisAs you can see in the chart, the fourth wave has ended and there is a possibility of an increase in the next stage to the level between 128,000 and 131,000, followed by a correction for a larger fourth wave and finally the last leg of the increase to the fifth wave, which has the possibility of reaching 139,000 to 140,000.

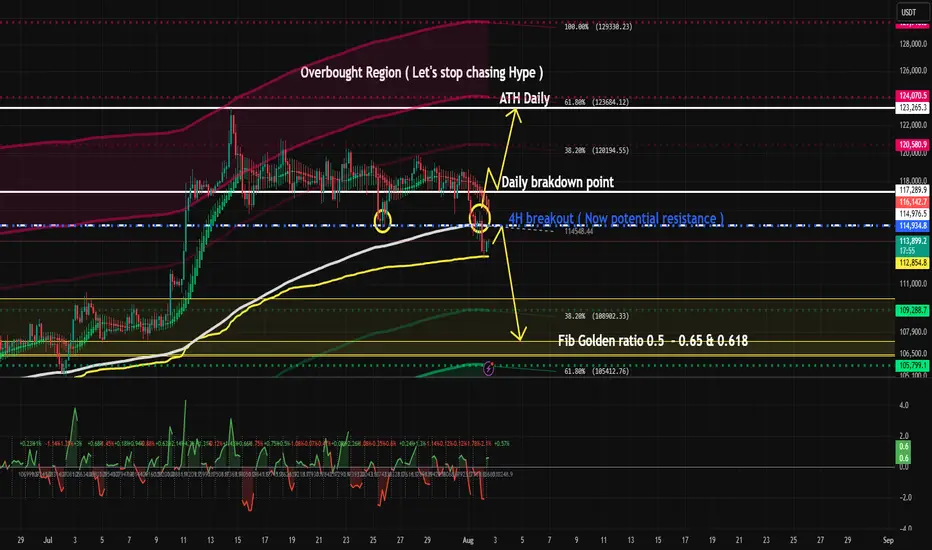
Overhyed Punishment This is what happens when everyone starts to fomo.
Lucky things, I sold some of my Altcoin with profit when BTC went into overbought band as in my chat.
BTC is bearish as long as below 117.6 to 118k :) . Good luck
BTC 108K - 112K ZONE Why 108k to 112k zone is important?
Bitcoin recently made a new all-time high and is now undergoing a healthy correction — nothing to worry about.
The $108,000 to $112,000 zone is a key support area due to three major factors:
1. Strong previous support level
2. A daily trendline aligning with this zone
3. 50% Fibonacci retracement of the recent impulse move
If this support holds, there's a strong possibility Bitcoin will form a new ATH around $130,000 to $140,000.
DON'T PANIC wait for confirmation and see the magic 🚀 🚀

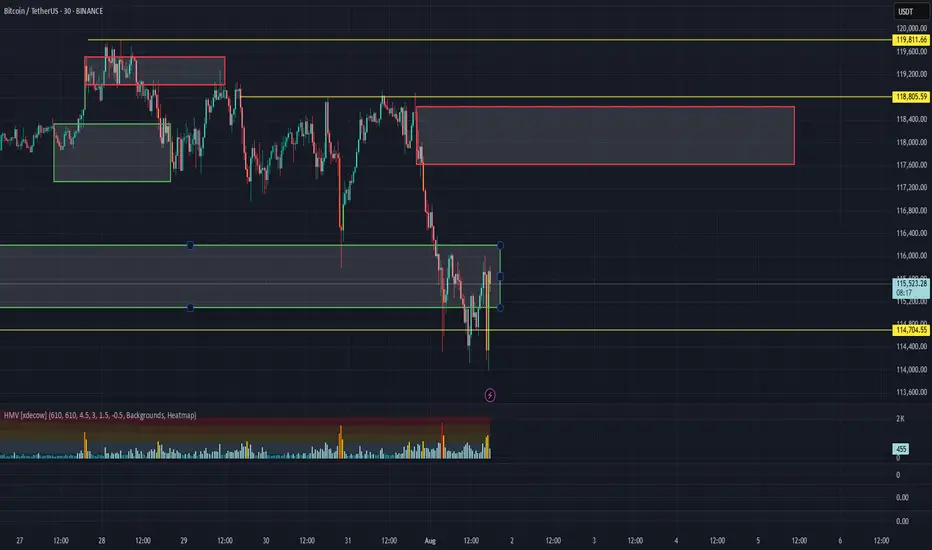
_Bitcoin Update
Bitcoin broke below on our local PBr2 support at 115.7k range keylevel panda fam this is a sign of first mini bearish breakout, But bitcoin price is now sitting at H4 PBr1 support keylevel 113.4k range.
Two case scenario possible for bitcoin:
1.) White broken lines — a bounce back with new swing high confirmation for reclaim back on structure for possible next major trend resistance breakout | BULLISH BIAS 🐂
2. ) Red broken lines — retest at PBr2 as local resistance and possible drop until white box support at 111.2k range area | BEARISH 🐻
In this case while bitcoin is ondecision panda fam we need to consider both case scenario with a short term possibilities but the best thing here is we already know where are the importance keylevel S / R to observe not just a random keylevel. 💯
ℹ️ : @pandanambawan

Reversal from Channel Bottom or a Real Breakdown? Identifying th
🎯 BTCUSDT - Analysis
🔹 Analysis Date: 1 August 2025
📉BTCUSDT:
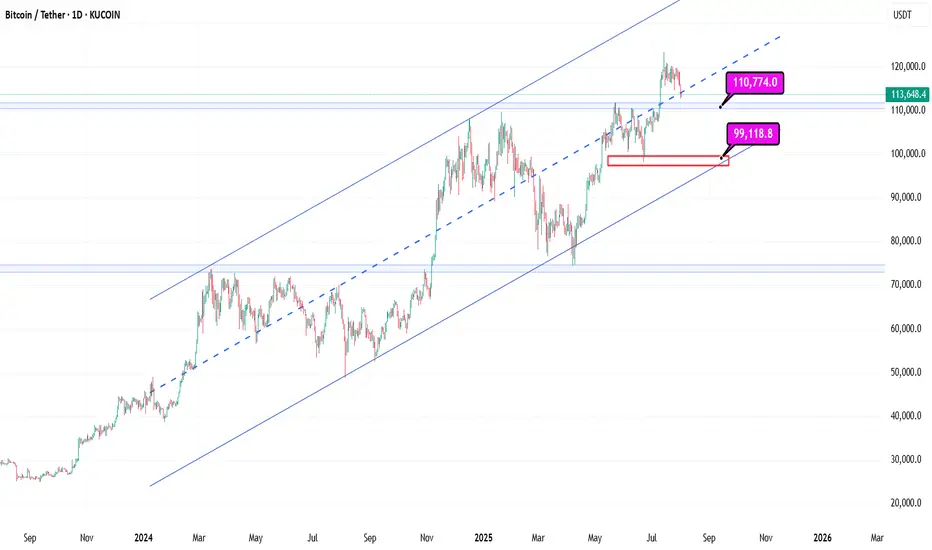
Price is currently moving inside an ascending channel and has touched the bottom of the channel again, offering a potential buy opportunity.
However, for those seeking a low-risk entry, the zone around 118,000 could be ideal—if price returns to the channel and confirms support.
Although it seems the channel’s lower boundary might break, this could be a fake break to mislead traders before a rebound.
The support at 110,000 is a crucial short-term level; if it fails, a deeper correction toward 98,090 or even 94,000 is likely.
Our targets remain at the upper boundary of the channel.
⚠️ Risk Management Tip: Wait for confirmation near 118,000 if unsure, and always size positions based on overall volatility.

BTC ReaccumulationI'm watching here either for a local model 1 which forms a MTF accumulation model 2 or a model 1 which deviates the range one more time. There is a nice build up of liquidity to the upside but sadly no clear model 2 POI. The technical target if the model gets confirmed will be the range high but i would expect to see a new ATH. Let's see.

BTC CLS RANGEWaiting for the daily candle to close inside of the range as seen on the graph with the horizontal line.
Then I will be immediatly looking for an entry, either a FVG or a OB or an IFVG. (I will update the entry points asap)
Then I will target 50% of the range as seen on the graph market 0 .5 on the fibonacci retracement where I will take 75% of the position.
Then I will set my SL at my entry price and target the opposing range or LQ which is at 119500-120000K

$BTC needs a massive diaper change....BTC is crossing key technical points, pointing clearly in an bearish trend. The trend will likely accelerate and potentially aggressively. I have been through several turns, not financial advise and always do your due diligence, but for those who are up: sell and and don't get emotional about BTC, unless there is a clean / clear support levels. Crypto bros will be eating rice and beans very soon and still be trying to FOMO crypto. This could be way worse than FTX!
Stay safe and for signal support levels use UltraAlgo to avoid wasting time trying to find support / resistance levels.....best of luck!

BTC/USDT Analysis – Negative Sentiment Returns
Hello everyone! This is the daily analysis from the trader-analyst at CryptoRobotics.
Yesterday, Trump officially imposed tariffs on 68 countries, which are set to take effect on August 7. The legality of these tariffs is already being challenged in court. The market reacted extremely negatively to this development — despite the overall positive technical setup and volume distribution, Bitcoin dropped to $114,000, deeply testing the volume zone and local lows.
Despite all of this, the bullish scenario should not be ruled out. The price action during the decline has been weak: while selling pressure is high, it has not led to a full breakdown of the lows. At this stage, it’s better to avoid opening new positions. Consider long setups only after a test of the $117,600–$118,600 supply zone, and watch for a buyer’s reaction on the retest.
If negative momentum continues, the price could drop further to the next support zone.
Buy zones:
• $110,000–$107,000 (accumulated volumes)
Sell zones:
• $117,600–$118,600 (accumulated volumes)
This publication is not financial advice.
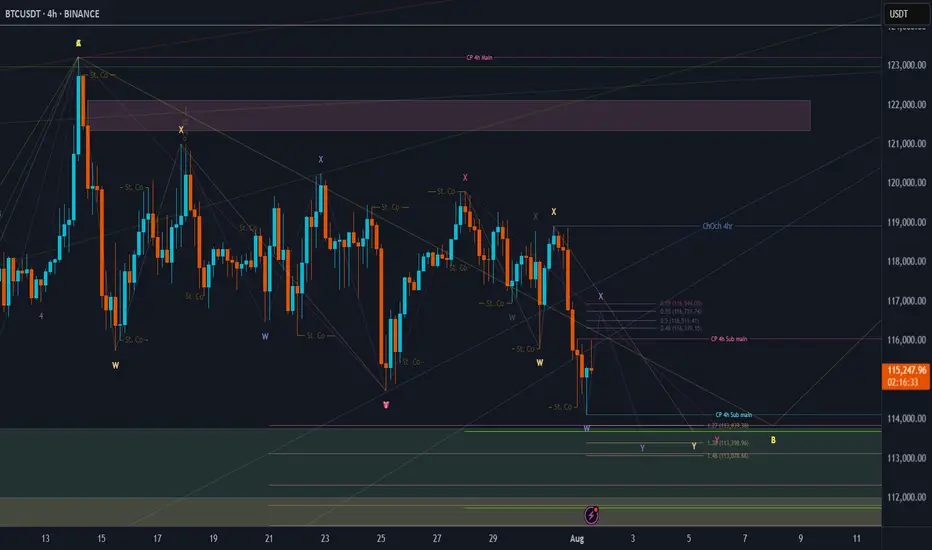
BTC Price Prediction and Elliott Wave AnalysisHello friends,
>> Thank you for joining me in my analysis. We have finished the pink X wave directly, then we have gone to the final pink Y wave, which consists of wxy in orange counting. Now we are moving into the final Orange Y wave.
>> our confirmations:
* 4Hr TF: Breaking 118990 for the next hours, we will end the whole Yellow B "correction" wave successfully. .
Keep liking and supporting me to continue. See you soon!
Thanks, Bros
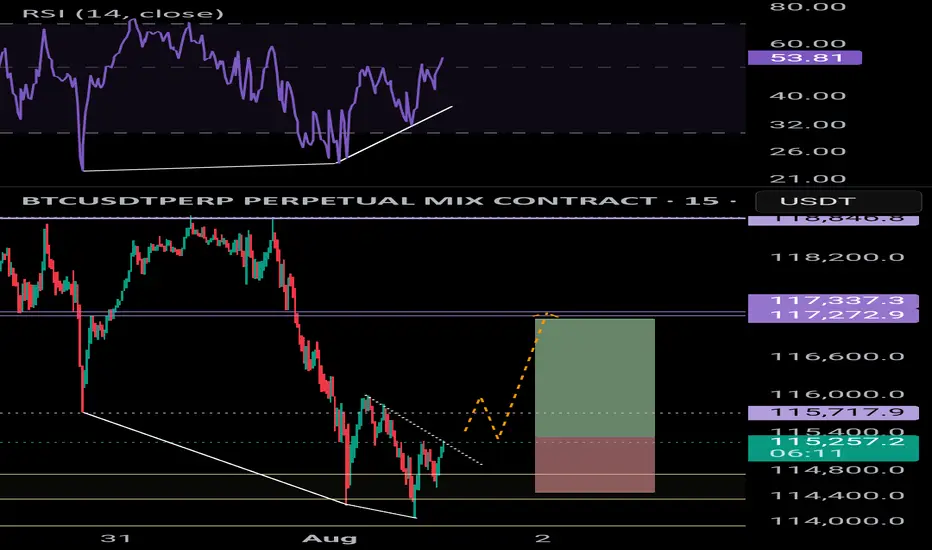
BTC bullish div.Bullish divergence on the 15m and 1H chart 📈
Liquidity grabbed 📈
Expecting a small move up = 1.6%
Long scalp trade if youre interested
BTCUSDT – Key Support Holding! Next Targets if 115,827 BreaksBitcoin is currently holding above a crucial support zone around 115,220. After a recent drop to the 114,979 area, buyers stepped in strongly, preventing further downside.
📊 If price stabilizes above 115,220 and successfully breaks through the resistance at 115,827, I expect bullish continuation towards the following targets:
🎯 Target 1: 117,900
🎯 Target 2: 119,076
These zones acted as strong resistances previously, and breaking through them could open the path to further upside.
⚠️ However, if BTC closes below 114,500, we may see a bearish breakdown with potential downside towards 108,000 – 106,000 range.
📌 Personally, I hope Bitcoin holds this support as it’s a key level to maintain bullish momentum.
Let’s see how the market reacts in the next few candles! BINANCE:BTCUSDT

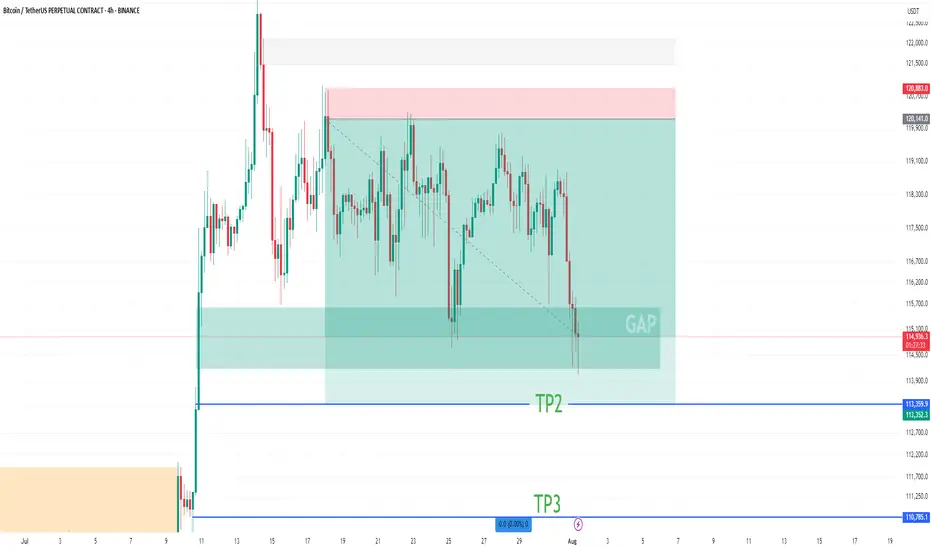
BTC Short Update Hello ❤️
Bitcoin
Let's have an update on Bitcoin analysis
💁♂️ First Target 🔥
Near Second Target
According to the analysis I posted on the page, Bitcoin touched the first target and is now near the second target
It is a good place to save profits. The price gap is filled
Please don't forget to like, share, and boost so that I can analyze it for you with more enthusiasm. Thank you. 💖😍
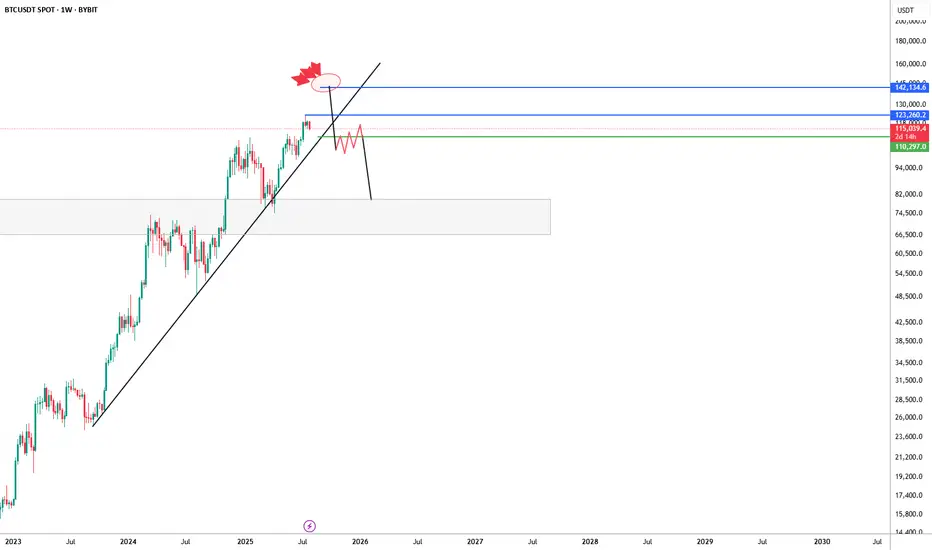
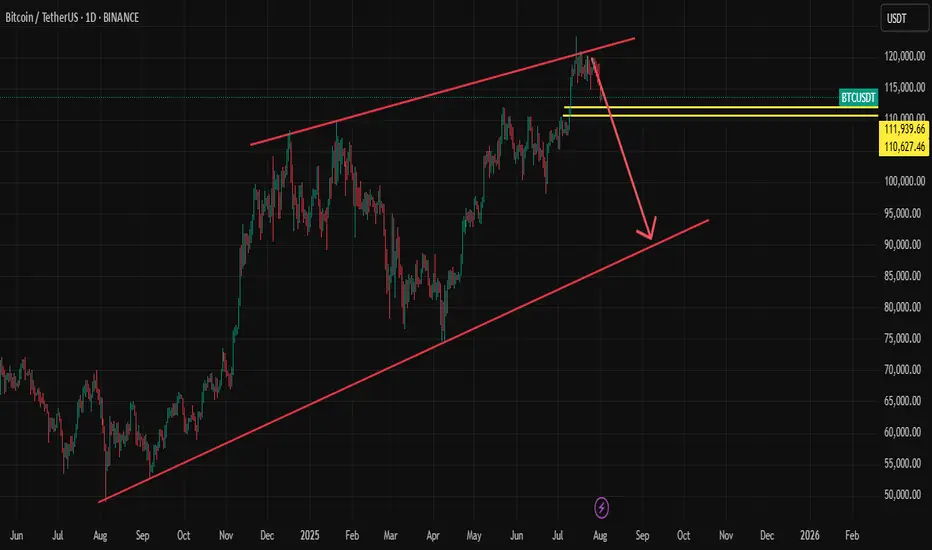
BTC/USDT Weekly – Bearish Rejection Brewing?Bitcoin has been riding a strong uptrend supported by a long-term ascending trendline, but recent price action is showing signs of exhaustion near the $123K–$142K supply zone.
The chart suggests a potential deviation above resistance, marked by a fakeout wick and aggressive rejection (highlighted with red blast icon). If price fails to reclaim and hold above $123K, the structure risks breaking down below trendline support — opening the door to a larger correction.
🔹 Key Resistance Zone: $123,260–$142,134
🔹 Critical Trendline Support: Recently broken — watch for retest/failure
🔹 Bearish Confirmation: Clean break & lower high formation under $109K
🔹 Next Major Demand Zone: $75K–$85K region
This setup leans bearish unless bulls can reclaim the upper blue range and re-establish control. If not, we could be looking at a significant macro retest of previous breakout levels.
#Bitcoin #BTC #BTCUSDT #CryptoChart #TrendReversal #BearishScenario