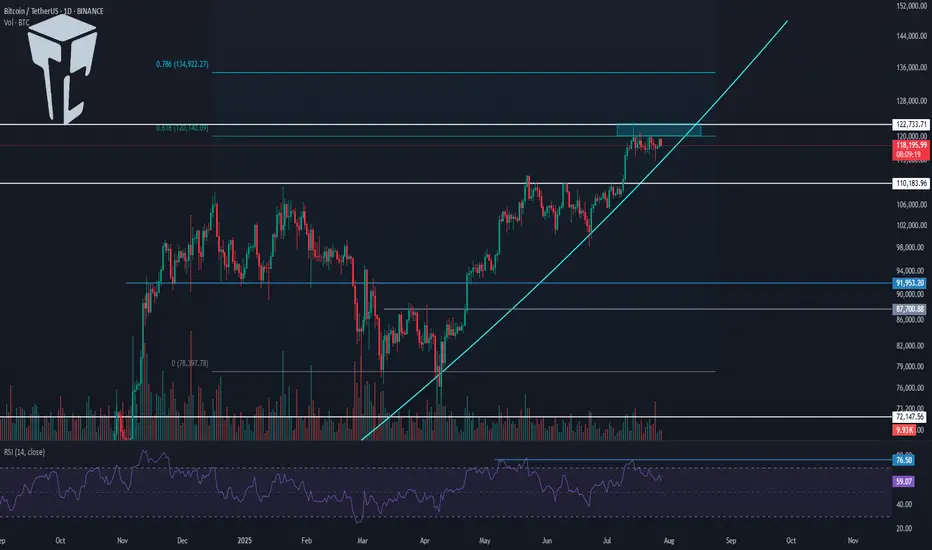
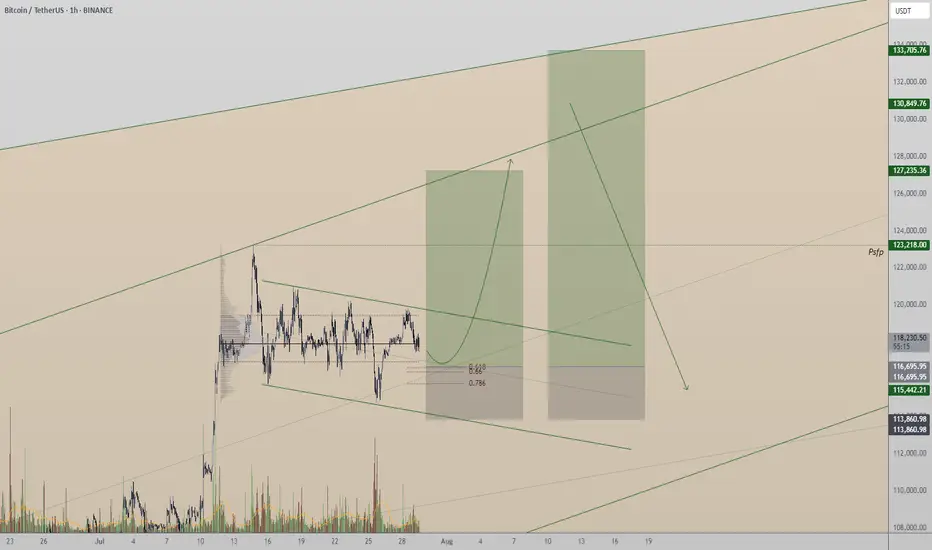
BTC | ALT Season, then BEARISH CYCLE BeginsBitcoin is likely moving in to the beginning of a bearish cycle.
I'm not saying this is immediate, we first need to see altseason - however, if BTC increases it may not go any higher than the last high of $123k. We could easily see the price hover around this zone with a few small increases and decreases for the next few weeks as alts make their respective moves.
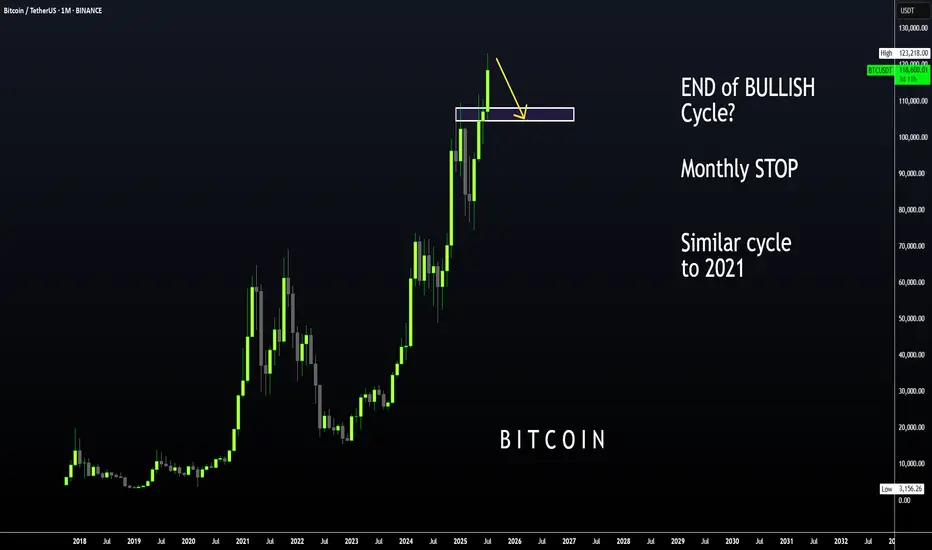
I have been talking about the 2021 fractal for a couple of months, where BTC took its time to correct and then made another ATH which was only slightly higher.
We already see a similar pattern playing out in the monthly timeframe if we overlay bars pattern from 2021:
Although Bonce zone 3 may only be in several months, these are the major support zones where BTC could bounce from. Ideal for a swing:
____________________
BINANCE:BTCUSDT
BTCUSDT trade ideas
BTC - Last Push: Consolidation, Manipulation & DistributionMarket Context
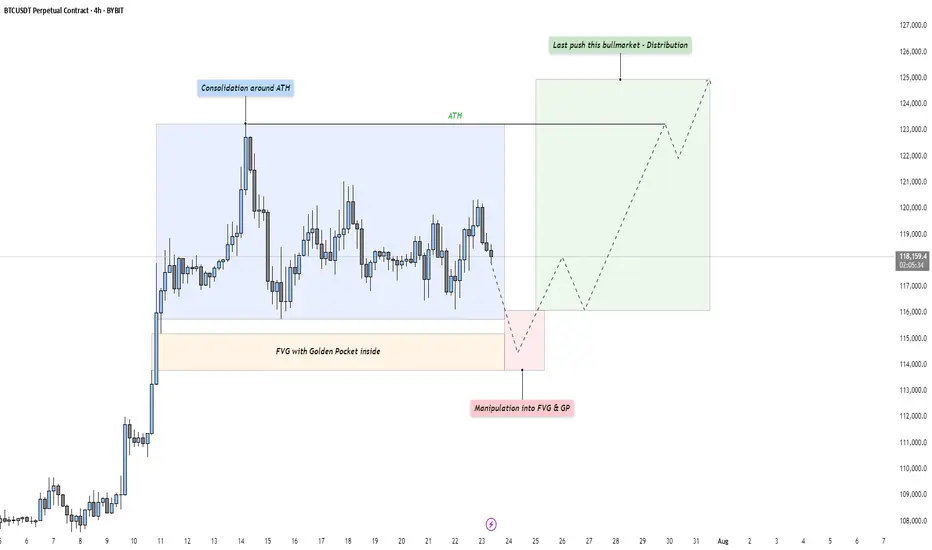
After a strong upward impulse, Bitcoin has entered a mid-term consolidation phase just below its all-time high. This kind of price action is typical as the market digests recent gains and larger participants prepare for the next move. These pauses in momentum often precede either trend continuation or a reversal — and the structure here suggests we might be witnessing the former, but not without a final shakeout.
Phase 1: Consolidation Around the All-Time High
The first phase is defined by a tight range just beneath the all-time high, where price moves sideways in a balanced struggle between buyers and sellers. This is often where retail participants become overly bullish, anticipating a breakout. However, the lack of a sustained move higher indicates that smart money may be waiting for better entries — or preparing to engineer liquidity to fuel the next move.
Phase 2: Manipulation Into the Fair Value Gap and Golden Pocket
Directly below the range lies a clean Fair Value Gap, with a Golden Pocket retracement nestled inside it. This zone represents a strong area of interest. A sharp move into this area would likely sweep late long positions and trigger stop-losses from range traders — a classic manipulation pattern. This phase serves two purposes: collect liquidity and offer favorable pricing for larger players looking to position themselves before expansion. Watch for signs of absorption or reversal as price enters this zone.
Phase 3: Expansion – The Last Push of the Bull Market?
Following the liquidity sweep and reaction from the Fair Value Gap and Golden Pocket zone, we could see a renewed expansion toward higher highs. This is the phase where volume returns, sentiment shifts, and price accelerates. If this plays out, it could mark the final leg of this bull cycle — potentially driving Bitcoin to new all-time highs with strength.
Execution Thoughts
If you're looking to participate, it's wise to wait for a confirmation signal on a lower timeframe — like the 5-minute or 15-minute chart — once price enters the Fair Value Gap and Golden Pocket zone. Watch for a strong bullish reaction, break of structure, or shift in order flow to signal that buyers are stepping back in.
Final Thoughts
Let the market come to your level and don’t chase moves without context. These three phases — consolidation, manipulation, and expansion — are timeless patterns seen across all markets. Stay patient, stay objective, and react with clarity.
If this breakdown helped you see the setup more clearly, a like would mean a lot — and I’d love to hear your thoughts in the comments! Are you watching the same zone, or do you see something different?
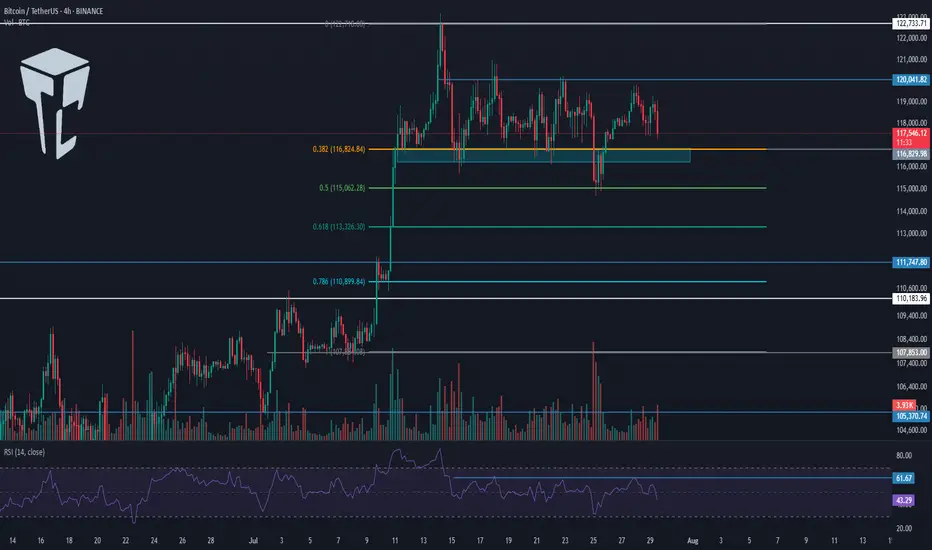
BTCUSDT analysis – 1H & 4H OB setups✅ The overall market trend is still bullish on the 1H and 4H timeframes. However, we’re watching the red 4H supply zone (around 122,000) closely for a possible short-term sell setup.
🟥 If price reaches this red OB, we’ll look for a light short position only with confirmation on the 5M or 3M timeframe.
🟩 On the downside, we are mainly interested in buy setups from the following key green OB zones:
🔹 OB 1H around 115,000
🔹 OB 4H around 111,000
🔹 OB 4H around 108,000
📌 Possible scenarios:
1️⃣ Price reaches the red OB → short with confirmation
2️⃣ Price pulls back to lower green OB zones → long with confirmation
3️⃣ Market bias remains bullish unless proven otherwise.
❌ No entry without confirmation.

BTC HUGE DROP TO 113,400$ - BIG CRASH !*Sorry for posting to late as I am between a trip in Malaysia.*
Details:
Entry: Now - 117,000 $
Target Price: 113,410 $
Stop loss: 119,460 $
Trade Ideas:
Market creating a flag pattern here. Though its not only the logic we have some secret logics here and indicators which I shared in the VIP.
What is required to Join VIP?
- Nothing just you have to share 10% of your profit with us at the end of the month which you earned from our signals. Yeah this is just the requirement, trade where ever you like your favorite broker or else you don't need to pay fees first or create account thru our link.
Trade Signal:
I provide trade signals here so follow my account and you can check my previous analysis regarding BITCOIN. So don't miss trade opportunity so follow must.
BINANCE:BTCUSDT BINANCE:BTCUSDT.P BINANCE:BTCUSD

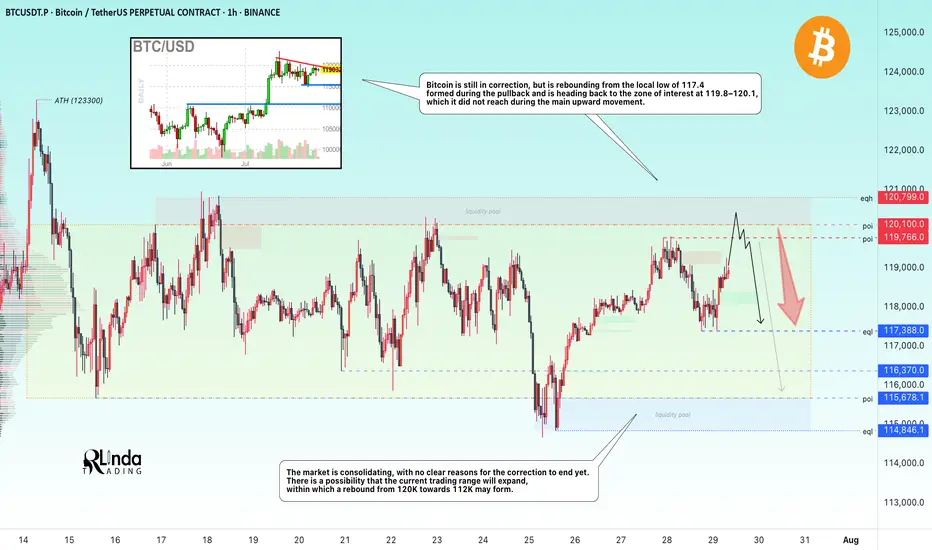
BITCOIN → Hunting for liquidity. Retest resistance before a fallBINANCE:BTCUSDT.P continues to consolidate after a strong rally. There is no strong driver yet, and Bitcoin is reacting weakly to economic data. There is a possibility of a continued correction...
Bitcoin is still in correction, but is rebounding from the local low of 117.4, formed during the pullback, and is heading back up towards the zone of interest at 119.8-120.1, which it did not reach during the main upward movement. I see no fundamental or technical reasons for the correction to end and for growth beyond 121K. I expect a rebound from the resistance zone towards 115-114K. However, in the medium term, I expect the market to attempt to close half or all of the gap between 112K and 114.8K, thereby expanding the key trading range.
Resistance levels: 119.77, 120.1K, 120.8K
Support levels: 117.4, 116.37, 115.68
Technically, a false breakout (liquidity capture) of key resistance and price consolidation in the selling zone could trigger bearish pressure on the market, which in turn would lead to a correction.
Best regards, R. Linda!
BTC/USD) bullish trend analysis Read The captionSMC Trading point update
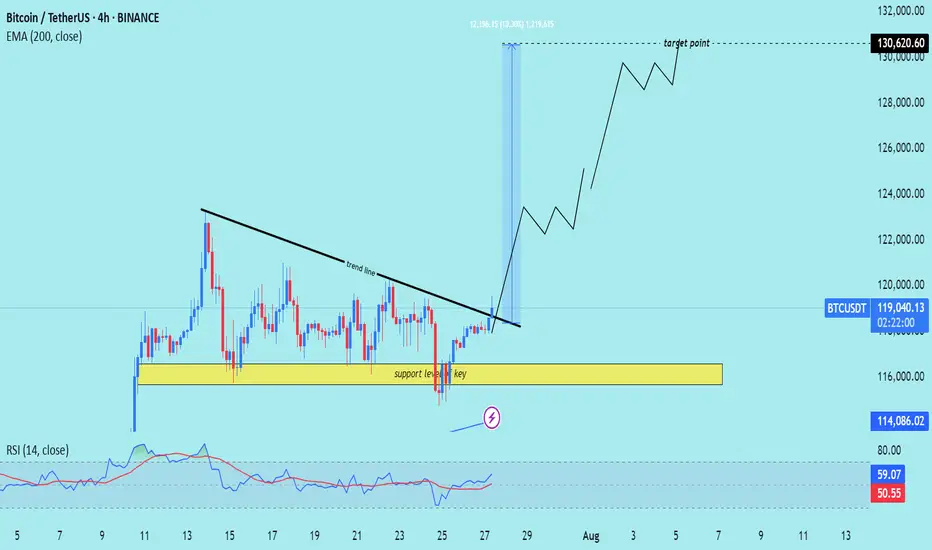
Technical analysis of Bitcoin (BTC/USDT) on the 4-hour timeframe, indicating a potential rally toward the $130,620.60 target zone. Here's the detailed breakdown:
---
Technical Analysis – BTC/USDT (4H)
1. Key Support Level Holding
The yellow zone highlights a strong support zone around $116,000, which has been tested multiple times without breaking.
Marked as “key support level,” it has acted as the foundation for a bullish reversal.
2. Trendline Breakout
A descending trendline was broken decisively with strong bullish candles, signaling a trend reversal.
The breakout was followed by increased momentum and volume, supporting the move higher.
3. Target Projection
The chart shows a projected move up to $130,620.60, labeled as the target point.
This target aligns with a measured move or prior resistance, suggesting a potential swing high objective.
4. 200 EMA Support
Price is well above the 200 EMA (at $114,088.52), confirming the uptrend and acting as dynamic support.
5. RSI Confirmation
RSI is at 60.62, reflecting bullish strength with more room before reaching overbought levels.
Momentum supports the continuation of the uptrend.
Mr SMC Trading point
---
Summary
Bias: Strong Bullish
Current Price: $119,291.13
Support Zone: $116,000 (key area)
Trendline: Broken with bullish confirmation
EMA 200: Acting as solid dynamic support ($114,088.52)
Target Zone: $130,620.60
RSI: 60.62 – bullish with upside potential
---
Please support boost 🚀 this analysis)
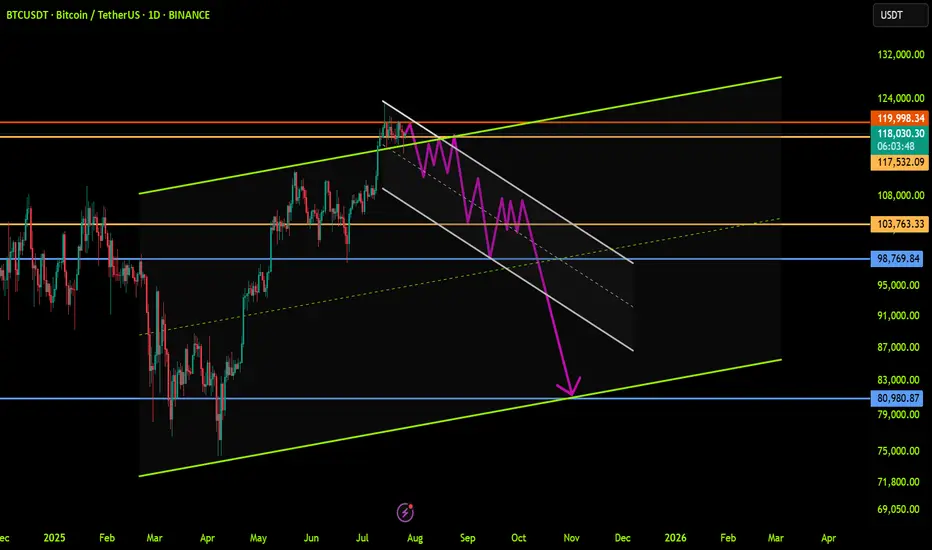
BTCUSDT: Trend in daily time frameThe color levels are very accurate levels of support and resistance in different time frames.
A strong move requires a correction to major support and we have to wait for their reaction in these areas.
So, Please pay special attention to the very accurate trend, colored levels, and you must know that SETUP is very sensitive.
BEST,
MT
BTC WILL FALL IS VERY HIGHThe area im looking to sell BTCUSDT.P from is a very strong resistance that would be very difficult for mr BITCOIN to pass through, so therefore, im expecting BTC to reject from there and fall to the down side. Sell BTC

BTC AI Prediction Dashboard - 6h Price Path (30.07.25)
Prediction made using Crypticorn AI Prediction Dashboard
Link in bio
BTCUSDT Forecast:
Crypticorn AI Prediction Dashboard Projects 6h Price Path (Forward-Only)
Forecast timestamp: ~10:45 UTC
Timeframe: 15m
Prediction horizon: 6 hours
Model output:
Central estimate (blue line): -118,306
Represents the AI’s best estimate of BTC’s near-term price direction.
80% confidence band (light blue): 118,086 – 118,670
The light blue zone marks the 80% confidence range — the most likely area for price to close
40% confidence band (dark blue): 117,520 – 119,603
The dark blue zone shows the narrower 40% confidence range, where price is expected to stay with higher concentration
Volume on signal bar: 80.50
This chart shows a short-term Bitcoin price forecast using AI-generated confidence zones.
Candlesticks reflect actual BTC/USDT price action in 15-minute intervals.
This helps visualize expected volatility and potential price zones in the short term.

Bitcoin - Bullish Reversal PotentialBitcoin is currently consolidating within a well-defined range, with repeated rejections from the upper resistance zone and strong reactions from the support below. Price continues to respect both ends of the structure, suggesting that liquidity is being built up on both sides. Until a clear breakout occurs, we should expect more range-bound movement with sharp rejections near the boundaries.
Support Zone and Liquidity Engineering
The support zone beneath current price action has already held several times, showing clear buying interest. However, the lows around this area remain relatively clean. A sweep of those lows would not only engineer sell-side liquidity but also set the stage for a reversal if buyers step back in. This would align well with typical accumulation behavior seen during consolidation phases.
Rejections from Resistance and FVG Influence
Price has shown multiple rejections from the resistance zone, particularly inside the fair value gap that sits just above it. This confirms that the area is actively defended and will likely be the next upside target if price manages to bounce from support. The FVG itself acts as a magnet once price begins to trend again, especially if a strong displacement follows a sweep.
Expected Flow and Trade Opportunity
The anticipated scenario involves price dipping back into support, possibly sweeping the lows for inducement, and then bouncing with a shift in short-term structure. If that happens, we can expect a move back toward resistance, completing another rotation within the range. The sweep would offer an added layer of confirmation, giving a stronger reason to look for long setups.
Invalidation and Risk Perspective
If support fails to hold and price breaks beneath the range without immediate recovery, that would invalidate the bullish view and point to a potential shift in directional bias. As long as price stays inside the current consolidation, however, this remains a waiting game for either a clean reaction from support or a sweep followed by structure shift.
Conclusion
Bitcoin remains locked in a clear range, and until the breakout happens, the edges of that range offer the best trading opportunities. A sweep of the lows would act as a high-probability signal for a reversal back to the highs. Patience is key, wait for the sweep and confirmation before committing to the upside.
___________________________________
Thanks for your support!
If you found this idea helpful or learned something new, drop a like 👍 and leave a comment, I’d love to hear your thoughts! 🚀

TradeCityPro | Bitcoin Daily Analysis #139Welcome to TradeCity Pro!
Let's go over Bitcoin's analysis. Today, Bitcoin is showing some signs regarding its next move, and today could be a critical day — especially considering that U.S. interest rate data is set to be released tomorrow.
4-Hour Timeframe
Today, there’s no need to switch to other timeframes — this 4-hour chart tells us everything.
Yesterday, the price was moving toward the 120041 area, which we intended to use as a long trigger, but that didn’t happen. The price failed to stabilize above this level, and RSI was rejected from the 61.67 zone.
Currently, the price has formed a lower high compared to 120041 and is now moving toward the support area around 116000.
Selling volume has significantly increased, which is not good for the bullish trend. If this support level breaks, deeper corrections to the 0.618 or even 0.786 Fibonacci levels could occur.
I’ll take profit on my long position that I opened from below 110000 if the price stabilizes below this zone, but I absolutely won’t open any short positions for now.
In my opinion, as long as the price is above 110000, any drop or correction is simply a better entry point for a long position. However, we shouldn’t buy during a falling market — we must wait for our triggers to activate.
Why Everyone’s Stop Loss Gets Liquidated?!!...Why does your stop loss always get hit first?
Is it possible that everyone else placed theirs exactly where you did?
Maybe it's time to face an uncomfortable truth about the market and crowd psychology.
Hello✌️
Spend 3 minutes ⏰ reading this educational material.
🎯 Analytical Insight on Bitcoin:
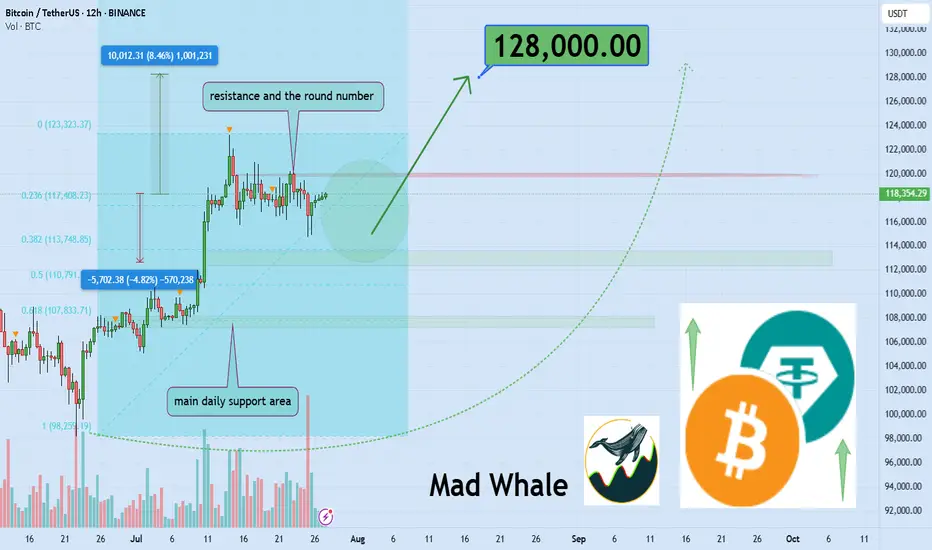
BINANCE:BTCUSDT has established a well-defined range in this zone, triggering multiple stop hunts and now approaching a fresh daily resistance. A confirmed breakout above this level could open the door for an 8% upside move toward the 128,000 area. 📈🧠
Now , let's dive into the educational section,
🎯 Crowd Psychology: The Fixed Target of the Market
In crypto markets, when everyone thinks the same, they tend to lose the same way. One of the clearest signs of this is where stop losses are placed. When a level becomes too obvious to too many traders, it becomes a magnet for liquidity hunters.
Public stop losses are usually placed right below obvious lows or above clear highs. These are areas that everyone has mentally marked as strong support or resistance. Ironically, that’s exactly where a sudden wick appears, takes out stops, and then the market goes right back in the original direction.
🧠 Your Brain Wants Safety, The Market Wants Liquidity
New traders search for “safe” places to hide their stops. That very logic makes those places unsafe. The market needs liquidity to move, and the most liquidity sits right where people feel safe placing their stops.
Remember: stop losses are actual market orders, buy or sell triggers. When yours gets hit, someone else enters a position. Your loss is their entry. This is a zero-sum game.
🐋 Whale Activity Before the Trap
Ever noticed how, just before your stop gets hit, there’s a small move in the opposite direction? That’s bait. Right after, a strong wick sweeps through, takes out public stops, then reverses. It’s not an accident. It’s planned.
If you observe these small shifts with suspicion rather than trust, you’ll often catch the trap before it happens.
💡 Your Trigger Shouldn't Be Where Everyone Else Sets It
There’s a smarter way to manage your stops, ways that avoid the obvious traps:
Use ATR to dynamically calculate distance
Place stops based on candle structure, not just price levels
Wait for confirmed reversal patterns before setting stops
Consider mental stops based on invalidation logic, not fixed price points
⛔️ Blind Trust in Repeated Zones
When a support or resistance level holds multiple times, people begin to trust it blindly. That collective trust becomes a weakness. The market doesn’t respect obvious levels, it exploits them.
If you see it, everyone else sees it. And so does the market. But the market plays a different game. You seek safety, it seeks liquidity.
🎲 Is It Really Your Fault?
Many traders blame themselves when their stop gets hit. The truth? You’re not the problem, your thinking pattern is. Most traders make the same decisions because they learned the same textbook strategies. That’s what makes their stops predictable.
It’s not always about poor analysis. Sometimes, it’s just about being part of the herd.
📉 Practical TradingView Tools to Track Public Stop Zones
Here are a few powerful TradingView tools and indicators you can use to figure out where stop loss clusters are likely hiding. Use them together for better accuracy:
Session Volume (Fixed Range)
Apply this tool to recent ranges or high-volatility zones. Peaks in volume often reveal where most traders are entering or exiting, which means stops are likely nearby.
Liquidity Pools Finder
This indicator estimates areas with potential liquidity pools. These are often the next targets for large moves.
Horizontal Ray or Box Tool
Use these to mark the areas just above highs and below lows. These zones are where most public stops typically sit.
Fair Value Gap (FVG)
Gaps in price action can act as magnets. It's no coincidence that public stops often get hit in these areas during fakeouts or trap moves.
📌 Final Thoughts
When everyone looks at the same level, the market attacks it. Public stop losses are a primary fuel source for liquidity-based moves. Use TradingView tools, train your eye, and place your stops where no one else dares. That’s how you stay out of the trap.
✅ Wrap-Up
If your stop always gets hit right before the big move, it’s not a coincidence, it’s a mindset issue. Stop thinking like the crowd, and the market will stop treating you like one.
✨ Need a little love!
We pour love into every post your support keeps us inspired! 💛 Don’t be shy, we’d love to hear from you on comments. Big thanks , Mad Whale 🐋
📜Please make sure to do your own research before investing, and review the disclaimer provided at the end of each post.
BTC - Trap, Tap, and Blast Off!BTC has been overall bullish, trading within the rising blue channel (1). After reaching a local high, it entered a short-term correction, forming a falling red channel (2).
👀All eyes are now on the key demand zone (3), which aligns with the lower bound of both the red channel and the rising blue structure.
🔎As long as this confluence holds, we anticipate a potential bullish impulse in August.
A retest of the $111,500–$112,000 zone could serve as the trigger for the next leg toward $128,000. Let’s see if BTC is gearing up for another breakout or if a deeper correction is in play.
🔔 Disclaimer: This analysis is for educational and informational purposes only. It does not constitute financial advice or a recommendation to buy or sell any asset. Always do your own research and manage your risk accordingly.
📚 Always follow your trading plan => including entry, risk management, and trade execution.
Good luck!
All strategies are good, if managed properly.
~ Richard Nasr

BTC AI Prediction Dashboard - 6h Price Path (31.07.25)
Prediction made using Crypticorn AI Prediction Dashboard
Link in bio
BTCUSDT Forecast:
Crypticorn AI Prediction Dashboard Projects 6h Price Path (Forward-Only)
Forecast timestamp: ~14:00 UTC
Timeframe: 15m
Prediction horizon: 6 hours
Model output:
Central estimate (blue line): -118,124
Represents the AI’s best estimate of BTC’s near-term price direction.
80% confidence band (light blue): 117,836 – 118,977
The light blue zone marks the 80% confidence range — the most likely area for price to close
40% confidence band (dark blue): 117,650 – 119,908
The dark blue zone shows the narrower 40% confidence range, where price is expected to stay with higher concentration
Volume on signal bar: 177.26
This chart shows a short-term Bitcoin price forecast using AI-generated confidence zones.
Candlesticks reflect actual BTC/USDT price action in 15-minute intervals.
This helps visualize expected volatility and potential price zones in the short term.

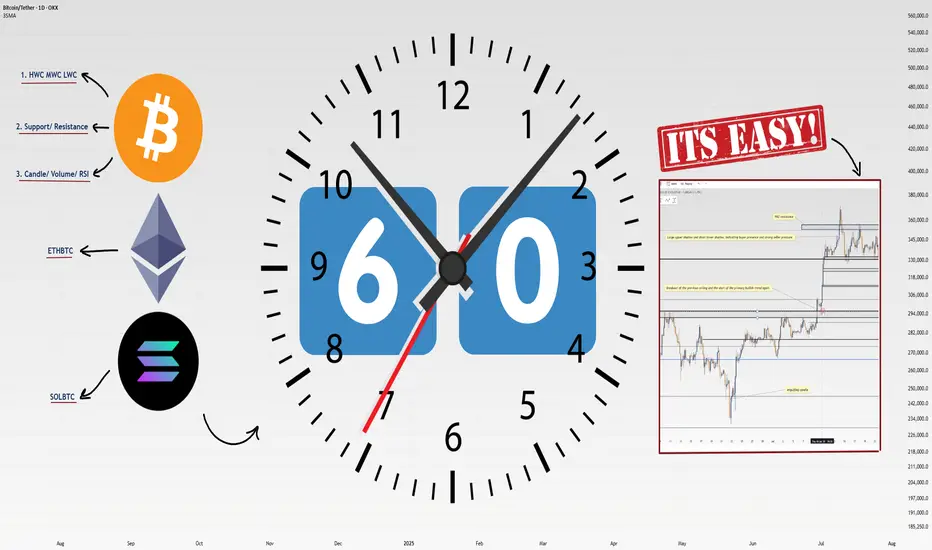
How I Analyze Any Coin in 60 Seconds: 4-Step Masterclass!Heyy traders, it’s Skeptic from Skeptic Lab! 🩵 I’m breaking down my lightning-fast method to analyze any coin in just 60 seconds . This 4-step process is how I spot long/short triggers like a pro. Buckle up, let’s dive in:
✔️ Step 1: Identify HWC/MWC/LWC (10 seconds)
Nature’s got a cool vibe—bet a lot of you hit the outdoors on weekends. When I see an apple tree from afar, it’s majestic, but up close, I spot branches and worm-eaten fruit. From a distance, I miss the details; up close, I lose the tree’s grandeur. Markets work the same. You need different timeframes to grasp the market structure. With practice in Dow Theory, trends, and tools, spotting HWC (Higher Wave Cycle), MWC (Mid Wave Cycle), and LWC (Lower Wave Cycle) becomes second nature. For me, this takes 10 seconds.
Want a full HWC/MWC/LWC guide? Check my free article I wrote a while back—it’s a hands-on tutorial ( link Cycle Mastery ).
📊 Step 2: Draw Support/Resistance Lines (20–30 seconds)
I start with higher timeframes: Monthly, then Weekly, then Daily. Once I’ve drawn lines up to Daily, I don’t always redraw for lower timeframes—often, I just adjust them.
Pro tip : Give more weight to the right side of the (recent data) since it’s fresher and more valuable. I change line colors for 4-hour lines, so I know they’re less critical than Daily. I don’t draw lines below 4-hour, but if you’re a scalper, tweak this to your strategy. This step takes me 20–30 seconds, the longest part.
📉 Step 3: Analyze Candles, Volume, Oscillators, and Indicators (10–15 seconds)
Here, I check everything I can: candles, volume, oscillators, and indicators . The goal? Stack confirmations for my triggers. Think RSI hitting overbought, volume spikes, larger candle sizes, or momentum surges—you get the vibe. This step’s length depends on your tool mastery. For me, it’s quick because I know what to look for.
🔔 Step 4: Check Coin Dominance (5–10 seconds)
This is the most critical yet simplest step. We need to track where liquidity’s flowing . For example, if SOL/BTC is bearish, I skip buying Solana—liquidity’s exiting. BTC.D (Bitcoin Dominance) is also key. The relationships dominance creates are complex and don’t fit in one analysis, but if you want a full dominance tutorial, drop it in the comments!
🔼 Key Takeaway: Using these 4 steps—HWC/MWC/LWC, support/resistance, candles/indicators, and dominance—I analyze any coin in 60 seconds. Your speed depends on experience and knowledge. If you’re new, this might take 60 minutes per coin, but don’t sweat it— practice makes you lightning-fast . Thanks for vibing with this educational idea! <3 I’ll catch you in the next one—good luck, fam!
💬 Let’s Talk!
Want a dominance tutorial or more tips? Hit the comments, and let’s crush it together! 😊 If this guide lit your fire, smash that boost—it fuels my mission! ✌️
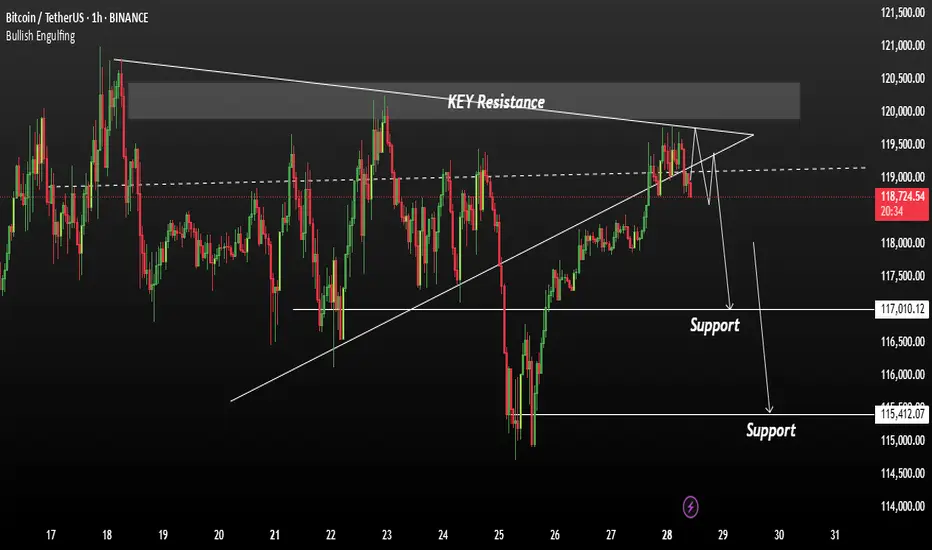
BTC/USDT Bull triangle still exists ? Hidden on fake camouflage?Bitcoin is moving sideways in a tight consolidation range between $117,000–$120,000 . Institutional players are accumulating positions here based on recent on-chain whale inflows, positive funding, and OI increase.
Key points with real chart zones:
The big drop down was likely a "fake out": Price wicked down to ~$115,000, triggering stop losses below this support, letting smart money buy cheaper.
Strong bounce back:
After the sweep, price quickly reclaimed the range, returning above ~$117,300–$118,000 , indicating strong buyer presence.
Bullish triangle is still valid:
Structure holds as long as price trades inside/bounces between $117,000 (lower zone/fake-out base) and $120,000 (upper resistance/consolidation top). Watch for volume spikes around $118,000–$120,000 as signs of institutional accumulation or breakout intent.
If price breaks above the range:
If we see a proper H1/H4 close above $120,000, expect a strong move to the next resistance: $123,000–$124,000 zone.
If price breaks down and holds below:
Sustained price action below $117,000, especially after another fake-out, could lead to a drop toward previous demand/stop zones at $115,000, and if that fails, further down to $110,000–$113,000.
Bottom line:
BTC sits in a “make-or-break” zone between $117,000–$120,000. Break out above $120k opens the path to $124k+. Loss of $117k/115k support risks further downside. Order flow and on-chain favor bulls for now, but always use stops – low volatility ranges can quickly resolve with liquidity grabs.
Tip:
Don’t chase every breakout or drop. Watch closely how price reacts near $120,000 (upside) and $117,000/$115,000 (downside). It is crucial to follow macroeconomic news, especially FED updates – trade safely and always do your own research!
This is not financial advice!

Bitcoin Could Accept bearish TrendBitcoin is currently testing a key resistance zone between 120,000 and 121,000. While price action is attempting to break higher, market conditions suggest the possibility of a false breakout rather than a sustained bullish continuation.
BTC has approached a significant resistance band, and early signs of exhaustion are visible. Unless the price decisively holds above 121,000, any breakout may lack conviction. Given the broader unresolved downtrend, a corrective move remains likely.
If the breakout fails to sustain, we anticipate a pullback toward the 117,000 to 115,000 range. This would align with a retest of previous support zones and continuation of the short-term bearish structure.
Ps: Support with like and comments for better analysis Thanks.
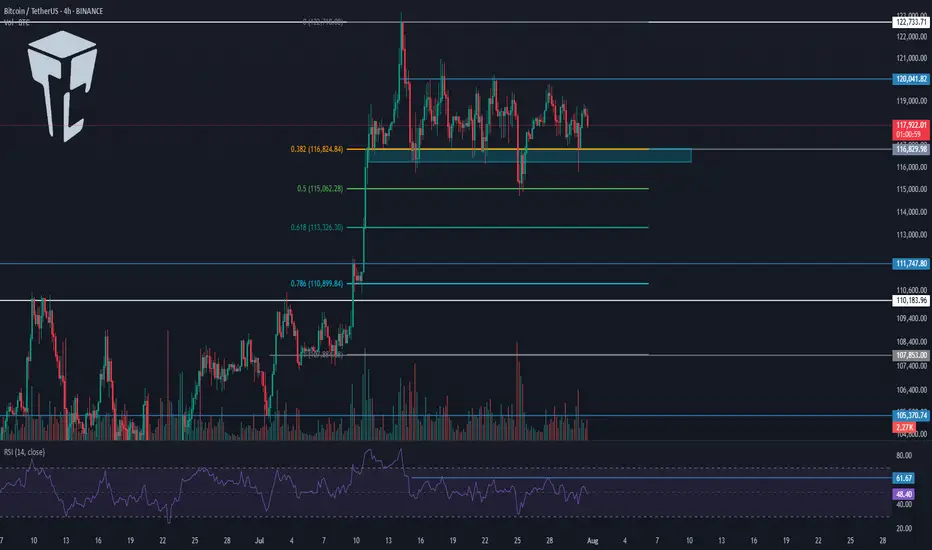
TradeCityPro | Bitcoin Daily Analysis #140👋 Welcome to TradeCity Pro!
Let’s dive into the Bitcoin analysis. Yesterday, the interest rate decision by the US Federal Reserve was announced, and once again, just like the past few months, it remained unchanged. Let’s see what impact it had on Bitcoin.
⏳ 4-Hour Timeframe
In the 4-hour timeframe, after the announcement of the unchanged interest rate and Powell’s speech, Bitcoin printed a red candle on the support zone and even wicked lower, but then recovered and the price returned back into the box.
✔️ Basically, we can say that this month’s rate decision had no real impact on the market, and Bitcoin is still moving inside its range box. The fact that the support zone wasn’t lost is a positive sign for the continuation of the trend.
⭐ But the important point is this: if the uptrend is going to continue, the price must print a higher high or at least a level equal to 120041, and in my opinion, if for any reason a lower high gets printed, the chances of breaking below 116829 significantly increase.
📊 I currently have no new position on Bitcoin, and all my entries are below 110000. But if 120041 breaks, I’ll open a long position for the next bullish wave that Bitcoin might start.
💥 A major trigger for starting a new leg is the 61.67 level on the RSI. As long as RSI remains below this level, there’s no bullish momentum in the market — and considering that the number of touches to 116829 has increased, the probability of a correction is also rising.
❌ Disclaimer ❌
Trading futures is highly risky and dangerous. If you're not an expert, these triggers may not be suitable for you. You should first learn risk and capital management. You can also use the educational content from this channel.
Finally, these triggers reflect my personal opinions on price action, and the market may move completely against this analysis. So, do your own research before opening any position.
Calling the Unthinkable: Why a Bitcoin Drop May Be ComingCOINBASE:BTCUSD BITSTAMP:BTCUSD OKX:BTCUSD BINANCE:BTCUSDT.P
Predicting a drop in Bitcoin's price during a strong uptrend is extremely difficult and calling it takes real courage. It puts my credibility at risk, but based on everything I see, I believe BTC has reached dangerously high levels.
From a psychological perspective , investor behavior is sending warning signs. There’s a rush of people buying in out of FOMO, amplified by heavy promotion on social media and mainstream claiming BTC is the safest investment out there. Many who missed earlier buying opportunities now regret betting on altcoins instead, and they see this as a last chance to profit. Even if BTC drops below their entry points, most of these “late buyers” won’t sell. They’ll convince themselves it’s just another minor correction like what happened in the previous 2 years, and that they’re in it for the long term.
From a technical analysis point, the signs are just as concerning. A “ shooting star ” candle has formed on the weekly chart. This candle is often seen at market tops. The MACD histogram on the same timeframe is showing a potential divergence, suggesting weakening momentum. The Fear and Greed Index is approaching 70, indicating strong market greed. On top of that, traders are opening high-leverage long positions in anticipation of another big bullish candle.
These technical and psychological signals combined paint a risky picture. If this kind of setup is confirmed , it will lead to sharp corrections.

BTC Unfolds in Complex Way After Hitting 123KBTC Unfolds in Complex Way After Hitting 123K
Bitcoin recently reached a historic all-time high near 123,200, marking a strong bullish run. Over the past two weeks, BTC has been consolidating, showing signs of a potential upward movement.
However, today's price action disrupted that bullish setup and introduced bearish momentum.
At this moment, two scenarios are possible:
1️⃣ Continued Bullish Momentum: The prevailing trend remains strongly bullish. Selling BTC now is risky, as there's a high chance it could resume its aggressive rise again.
False Bearish Breakout: The recent bearish signal may be misleading. BTC may be forming a broader accumulation structure, paving the way for another upward move.
2️⃣ Profit-Taking Phase: This bearish shift might be valid, suggesting that Bitcoin is entering a profit-taking cycle after an extended rally. If this scenario unfolds, a deeper correction may follow, aligning with the current technical pattern.
You may find more details in the chart!
Thank you and Good Luck!
PS: Please support with a like or comment if you find this analysis useful for your trading day

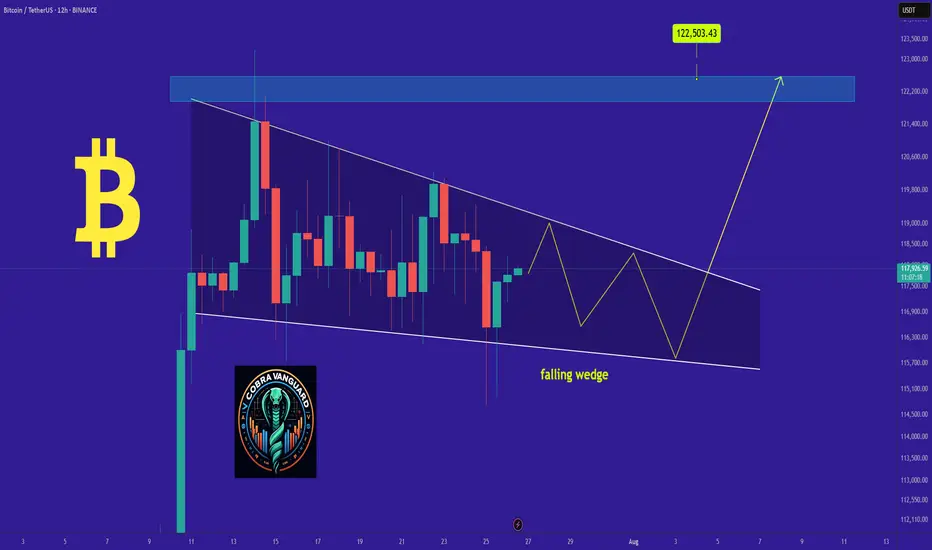
BITCOIN's Situation (12h) !!!So if you pay attention to the TON chart you can see that the price has formed a Ascending wedge which means it is expected to price move as equal as the measured price movement.( AB=CD )
NOTE: wait for break of the WEDGE .
Best regards CobraVanguard.💚
Bitcoin:Can Support at Point of Control Fuel a Move to New High?Bitcoin is currently consolidating at its local point of control, facing immediate resistance from a Fibonacci-aligned value area low. A critical reversal from here could pave the way to new all-time highs.
Bitcoin has entered a pivotal phase, trading at a key technical region that could determine its short-term direction. Over the past week, price action has hovered around the local point of control, showing signs of absorption and consolidation. With immediate resistance looming at a major confluence level, the next few daily candles may set the stage for either a breakout or a deeper retracement.
Key Technical Points:
- Local Point of Control: Bitcoin is ranging around this level, showing indecision
- Value Area Low + 0.618 Fib: Immediate resistance forms strong technical confluence
- Swing Low Critical: A break below the last swing low would invalidate bullish structure
Bitcoin’s current position around the local point of control reflects a phase of market equilibrium. This level represents the area of highest traded volume over the recent range, acting as both support and resistance at different times. The fact that price has revisited and hovered here for multiple days suggests active positioning from both bulls and bears.
Just above lies the value area low, which is in direct confluence with the 0.618 Fibonacci retracement from the recent swing high to swing low. This dual-layered resistance is significant — if Bitcoin is able to break above and reclaim this zone, it could unlock the next leg higher.
However, traders must remain cautious. The most recent swing low, formed during the last pullback, now acts as the final line of defense for bulls. A loss of this low would shift market structure to bearish and potentially initiate a correction deeper into the prior range.
So far, the lack of high-volume breakdowns suggests sellers have not yet gained control. But without a decisive bounce and follow-through above resistance, the risk of a failed reversal increases.
What to Expect in the Coming Price Action:
If Bitcoin holds above the point of control and mounts a successful challenge of the value area low, a rotation toward a new all-time high becomes increasingly likely. However, failure to defend the swing low would invalidate the setup and favor further downside. All eyes remain on the current consolidation for clues on the next major move.
TradeCityPro | Bitcoin Daily Analysis #138👋 Welcome to TradeCity Pro!
Let’s get into the Bitcoin analysis. Today is the start of the week, and it’s very important to begin our trading week with the right analysis and outlook.
📅 Daily Timeframe
On the daily timeframe, as you can see, not much has changed compared to the previous analysis, and the price is still ranging near the supply zone.
✔️ The fact that no price correction has occurred so far shows the strength of the buyers, and even if a correction does happen, as long as the price stays above 110183, the trend will still be considered bullish.
🧩 The main trigger for trend continuation is either the price reaction to the curved trendline or the break of 122733. We can find more optimal triggers in the lower timeframes.
⏳ 4-Hour Timeframe
In this 4-hour timeframe, after a fakeout below 116829, the price corrected down to the 0.5 Fibonacci level and now has returned again to the box between 116829 and 120041.
🔍 The fakeout trigger is 120041, and I’ll try to have at least two positions open in the market when this level breaks — whether on Bitcoin or altcoins.
📈 The main trigger for the next bullish leg is 122733.
If RSI also breaks the 61.67 resistance alongside 120041, the likelihood of the move continuing will increase.
❌ Disclaimer ❌
Trading futures is highly risky and dangerous. If you're not an expert, these triggers may not be suitable for you. You should first learn risk and capital management. You can also use the educational content from this channel.
Finally, these triggers reflect my personal opinions on price action, and the market may move completely against this analysis. So, do your own research before opening any position.