BTC/USDT Analysis – Negative Sentiment Returns
Hello everyone! This is the daily analysis from the trader-analyst at CryptoRobotics.
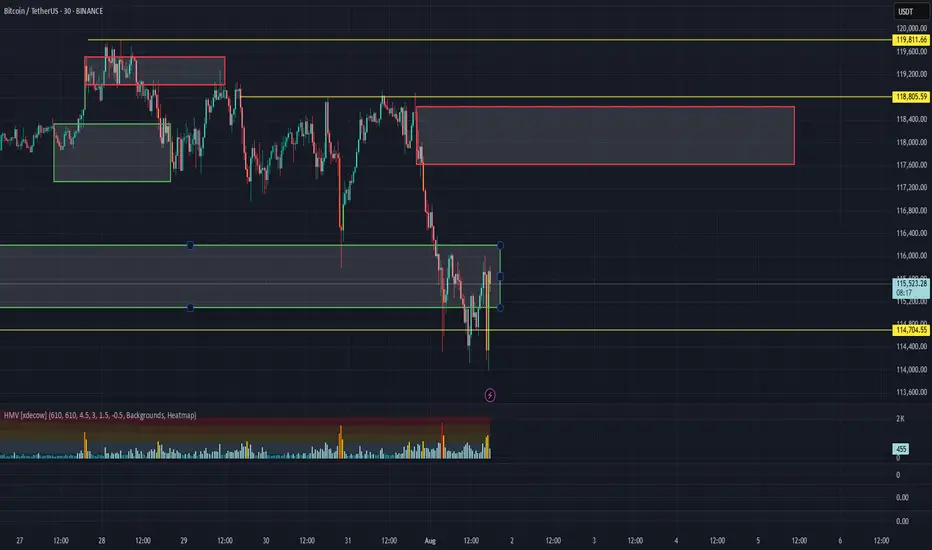
Yesterday, Trump officially imposed tariffs on 68 countries, which are set to take effect on August 7. The legality of these tariffs is already being challenged in court. The market reacted extremely negatively to this development — despite the overall positive technical setup and volume distribution, Bitcoin dropped to $114,000, deeply testing the volume zone and local lows.
Despite all of this, the bullish scenario should not be ruled out. The price action during the decline has been weak: while selling pressure is high, it has not led to a full breakdown of the lows. At this stage, it’s better to avoid opening new positions. Consider long setups only after a test of the $117,600–$118,600 supply zone, and watch for a buyer’s reaction on the retest.
If negative momentum continues, the price could drop further to the next support zone.
Buy zones:
• $110,000–$107,000 (accumulated volumes)
Sell zones:
• $117,600–$118,600 (accumulated volumes)
This publication is not financial advice.
BTCUSDT trade ideas
BTC Price Prediction and Elliott Wave AnalysisHello friends,
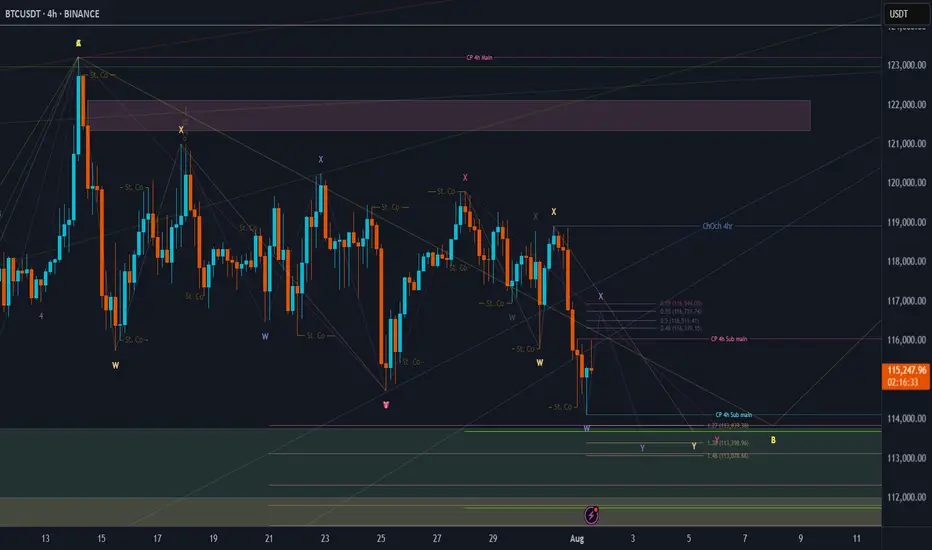
>> Thank you for joining me in my analysis. We have finished the pink X wave directly, then we have gone to the final pink Y wave, which consists of wxy in orange counting. Now we are moving into the final Orange Y wave.
>> our confirmations:
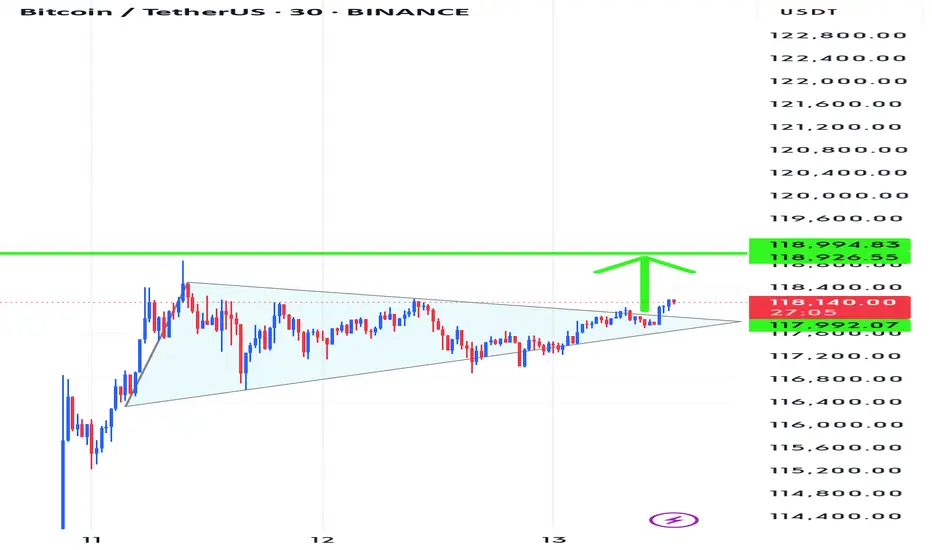
* 4Hr TF: Breaking 118990 for the next hours, we will end the whole Yellow B "correction" wave successfully. .
Keep liking and supporting me to continue. See you soon!
Thanks, Bros
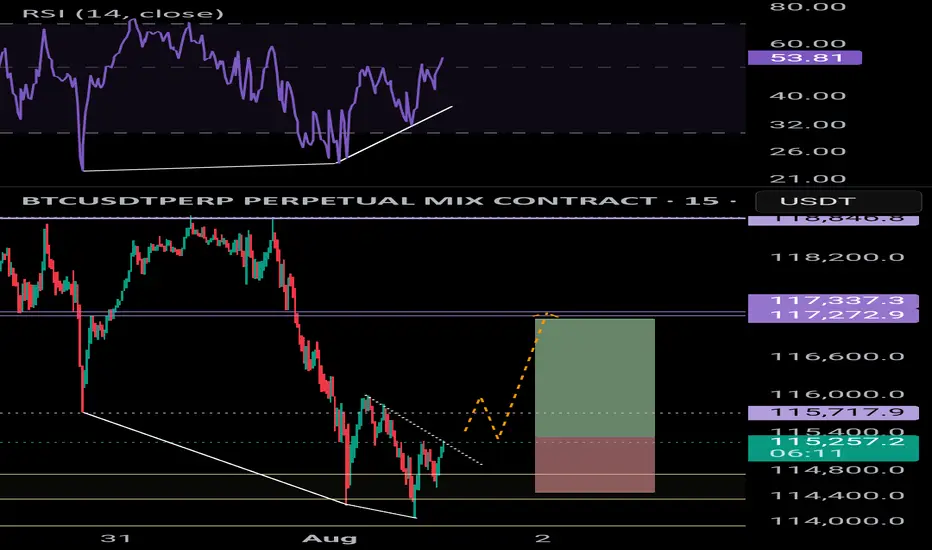
BTC bullish div.Bullish divergence on the 15m and 1H chart 📈
Liquidity grabbed 📈
Expecting a small move up = 1.6%
Long scalp trade if youre interested
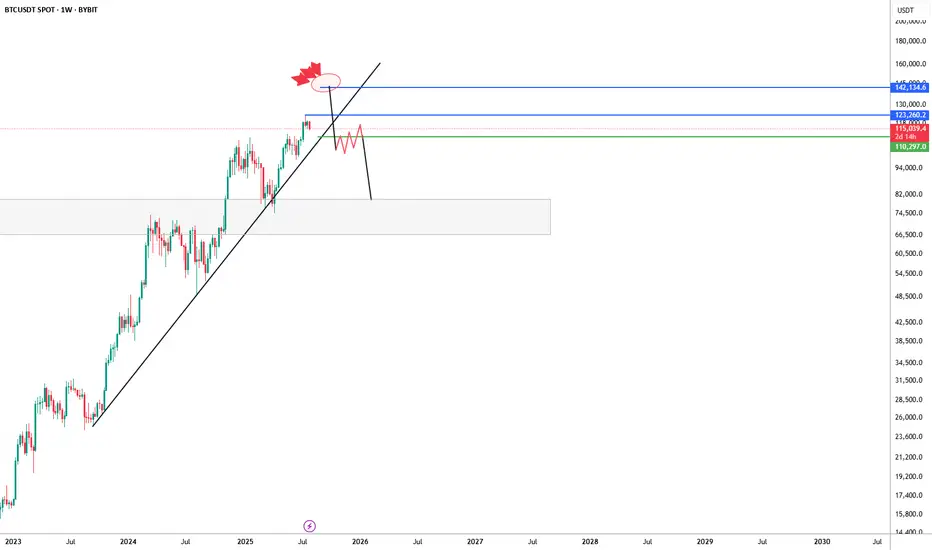
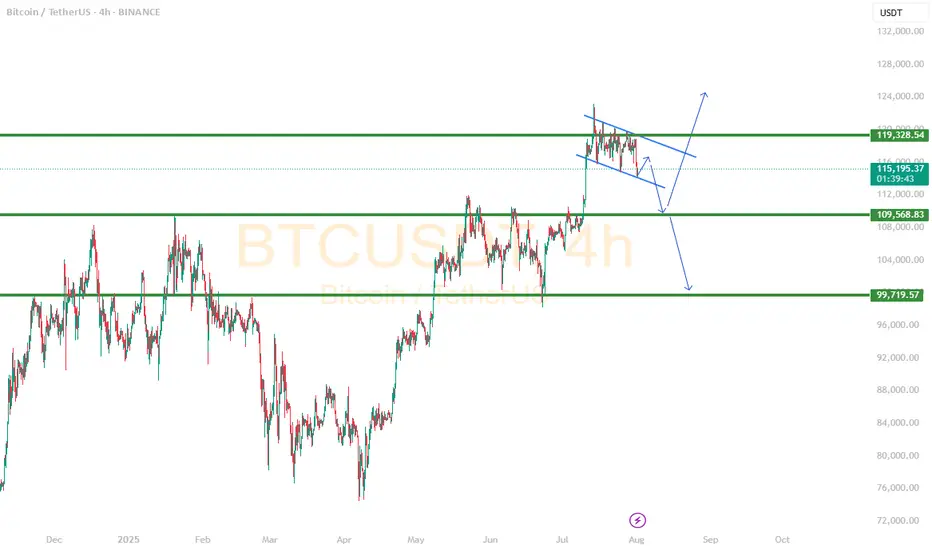
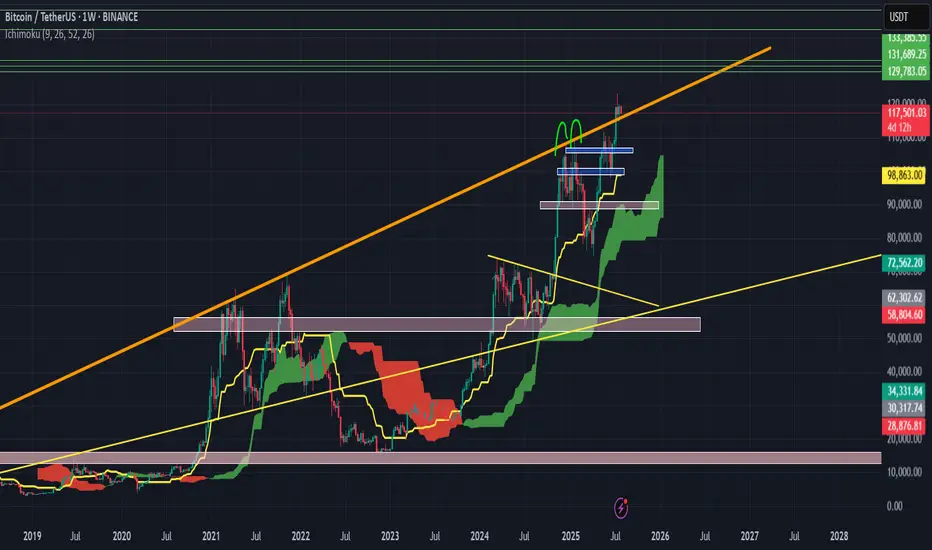
BTC/USDT Weekly – Bearish Rejection Brewing?Bitcoin has been riding a strong uptrend supported by a long-term ascending trendline, but recent price action is showing signs of exhaustion near the $123K–$142K supply zone.
The chart suggests a potential deviation above resistance, marked by a fakeout wick and aggressive rejection (highlighted with red blast icon). If price fails to reclaim and hold above $123K, the structure risks breaking down below trendline support — opening the door to a larger correction.
🔹 Key Resistance Zone: $123,260–$142,134
🔹 Critical Trendline Support: Recently broken — watch for retest/failure
🔹 Bearish Confirmation: Clean break & lower high formation under $109K
🔹 Next Major Demand Zone: $75K–$85K region
This setup leans bearish unless bulls can reclaim the upper blue range and re-establish control. If not, we could be looking at a significant macro retest of previous breakout levels.
#Bitcoin #BTC #BTCUSDT #CryptoChart #TrendReversal #BearishScenario
Two simple scenarios could playing out The buying pressure has been slightly less over the last week, I see a small improvement today but later this weekend, it is still likely to head downward towards the 110k area.
$BTCtime to run it back from here little more to go for H4 reclaim then looking for the thick white line to be reclaimed
stop below range low

Big Decision Point for BTCThis is a big decision point. If BTC can hold at or above yesterday's low at 115700, then its to the MOON from here. Otherwise... its not gonna be pretty for any and all altcoin hodlers.
HOLD THE LINE BULLS!!

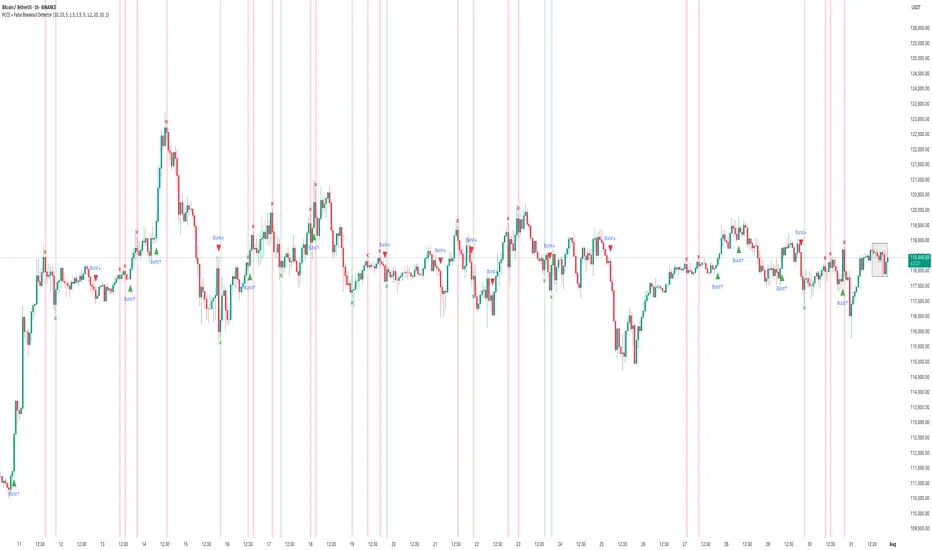
How to Use the PCCE + False Breakout DetectorHow to Use the PCCE + False Breakout Detector to Catch Trap Zones in BTC
Chart: BTC/USDT (1H)
Tool Used: PCCE + False Breakout Detector
Type: Educational – How to identify false breakouts and anticipate trend shifts.
⸻
🧠 What the Indicator Does:
The PCCE + False Breakout Detector is designed to identify breakouts from coiling ranges and filter out trap moves that often fool traders.
🔹 Burst↑ / Burst↓: Valid breakout from a price coil with volume and trend alignment
🔻 Red X: Marks a bull trap — breakout failed and price reversed lower
🟢 Green X: Marks a bear trap — breakdown failed and price reversed higher
By flagging where breakout structure fails, the indicator helps traders avoid false entries and position early for reversals.
⸻
✅ Recent Performance Highlights (BTCUSDT 1H):
📈 From July 13–31:
• Burst↑ on July 13 led to a clean uptrend (+$1,500 gain)
• Red X on July 16 called a failed breakout — price dropped hard
• Green X on July 16 caught the bear trap — price reversed immediately
• Burst↓ on July 21 triggered a sharp decline, validating breakdown
• Red X on July 30 spotted the bull trap just before price reversed down
📉 Even in sideways ranges, Red/Green Xs signaled when the move lacked conviction, allowing traders to wait instead of chasing noise.
⸻
🔍 Current Interpretation:
• BTC is trading inside a choppy structure after a recent Burst↑ and Red X combo.
• The X mark zone (gray box) warns of instability — bulls attempted a breakout but failed.
• If price continues to stay below the Red X high → likely retracement ahead.
• If we see a Green X + rally soon → potential reversal setup in progress.
⸻
📚 How-To Use the Indicator:
1. Burst Signals (Breakouts)
🔸 Use these to enter when coil compression breaks with volume
🔸 Works best when aligned with EMA trend and breakout body
2. Red / Green X (False Breakout Detector)
❌ Red X: Price spiked above resistance but lacked follow-through → trap
✅ Green X: Price dipped below support but got bought → trap
3. Confirm with Price Context
🔄 Look for reaction candles after X marks
📏 Set tighter stops — traps often reverse fast
🔔 Combine with your S/R zones or order block theory
⸻
🧠 Final Thoughts:
The PCCE + False Breakout Detector isn’t just about spotting momentum — it’s about reading intent vs. failure in price action.
BTC’s current structure shows signs of indecision. Trust the Xs to tell you whether the move has legs — or is just another trap.
🎯 Learn to trade the trap, not fall into it.
BTC not looking pretty....even with lipstickBTC just crossed every meaningful SMA technical indicators and has been lingering at the top of the house like an unwanted guest. Awaiting an UltraBear signal, but watch out on this as massive dips repeat themselves and we are in an overheated market. Also, IMHO don't short as it could back-fire. It will naturally go back to it's support levels....fun times!

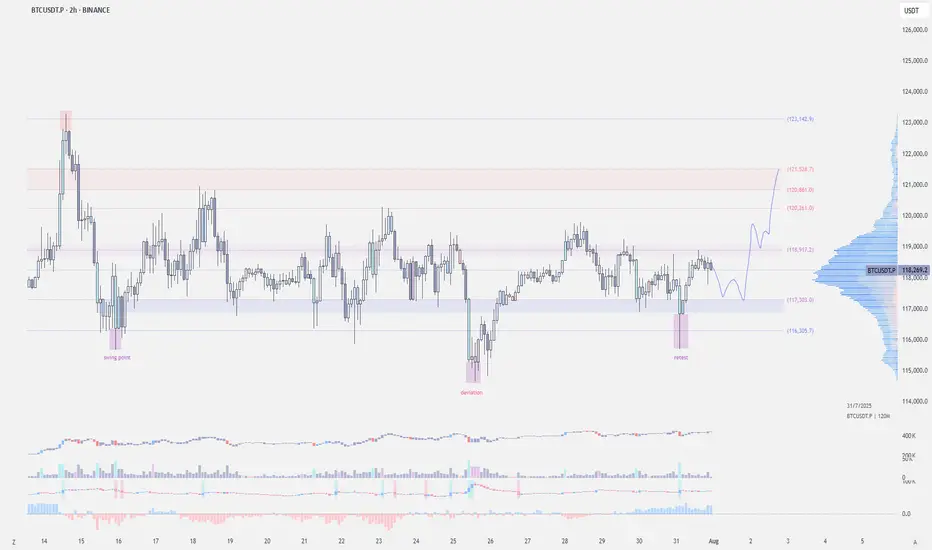
$BTC - Swing Point RetestCRYPTOCAP:BTC | 2h
We've got a swing point retest at 115.7k after the deviation at 114.6k
For bullish continuation, holding above 117.3k-116.8k is key — any break below invalidates the setup.
A clean break above the 120k resistance, I'm expecting we could finally tag 121k–122k (untested supply zone).

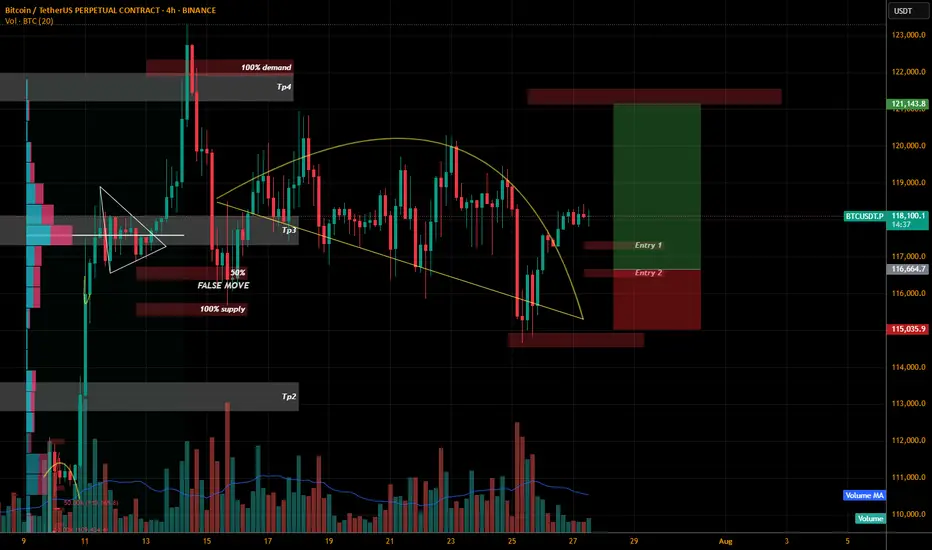
BTCUSDT.P LONGThe price is squeezed and its Sunday we might get a big move Positive Lets hope for the best and plan our trading.
I have marked 2 entries I think the more we wait the more we get.
So entry 2 in my opinion will be more beneficial to trail this trade. Anyhow if we see any bullish momentum on these level we are IN guys.
WHY? why i planned this trade as we can see the we are on sunday and price squeezed and we are already in bull run and we can see the price break the curve resistance so i hope the price will retest the level and if we see bullish candle patterns than only we will execute it.
If you like my previous ideas and analysis please don't forget to follow me. We all need encouragement. The more followers the more encouragement.
BTC Testing Resistance Within Lower Timeframe Channel
⚠️ CRYPTOCAP:BTC is setting up a key short-term play, with structure tightening on the intraday charts.
📉 4H: Trading inside a clean descending channel, with sellers still capping moves
⏱️ 1H: Price is nudging against trendline resistance — an active breakout attempt is underway
If this breakout confirms, we could see short-term bullish momentum take over 🔼
But a rejection here may push BTC back toward the channel’s lower boundary 🔽
👀 This setup is packed with potential — quick reactions are likely either way.
Are you expecting a breakout or another fade from resistance?
Not financial advice.

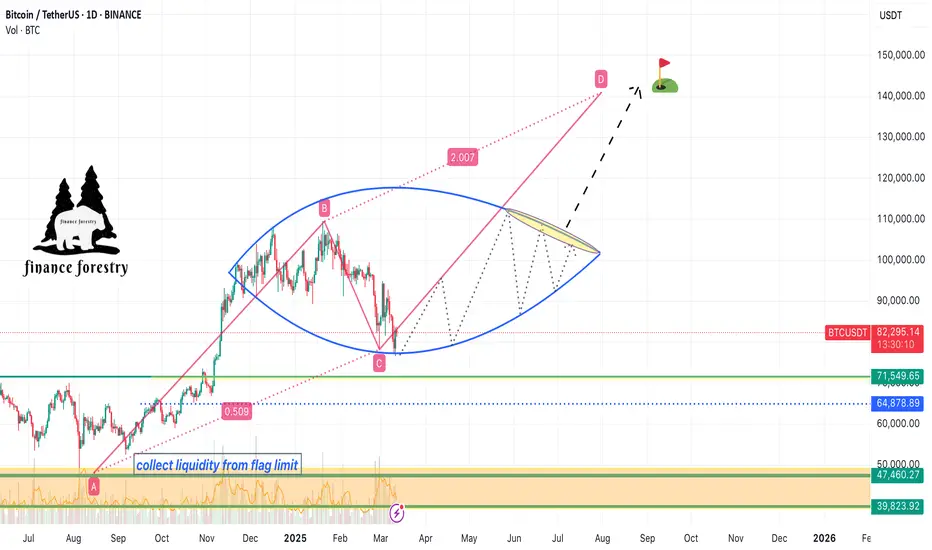
Bitcoin's Natural Correction and the $141K Target Based on Fibonhello dear trader and investors
The cryptocurrency market is always accompanied by strong fluctuations and natural corrections. Bitcoin, as the market leader, requires corrections and liquidity accumulation after each significant rally to pave the way for higher price targets. In this article, we analyze Fibonacci structures and harmonic patterns to demonstrate that Bitcoin's next target could be $141K.
1. Bitcoin Corrections: A Natural Part of an Uptrend
Price corrections in bullish trends are a normal phenomenon that helps shake out weak hands and allows major players to accumulate liquidity. Historically, Bitcoin has experienced 20-30% corrections before resuming its upward trajectory. The current correction is no different and may serve as a base for the next strong move toward higher targets.
2. The $141K Target Based on Fibonacci
Fibonacci levels are among the most reliable tools for predicting price targets. Assuming Bitcoin's recent high was around FWB:73K and the ongoing pullback is a healthy retracement, we can use harmonic AB=CD pattern to project potential upside targets. Based on these levels, Bitcoin could reach $141K in the next bullish phase.
Confirmation Through Harmonic Patterns
Harmonic patterns like Butterfly and Gartley suggest that the current correction is forming a potential reversal structure. If this correction completes within the PRZ (Potential Reversal Zone), Bitcoin could see a strong continuation of its uptrend. The Fibonacci ratios in these harmonic structures indicate that the final price target for this bullish wave could be around $141K.
Volume and Liquidity: Key Drivers for the Rally
Bitcoin needs increased volume and liquidity inflows to reach higher levels. On-chain data shows that trading volumes are rising and large investors (whales) are accumulating rather than selling. This behavior typically precedes a strong bullish move.
Bitcoin's current correction is entirely natural, and technical structures suggest that it could be laying the foundation for a new bullish wave. Based on Fibonacci and harmonic pattern analysis, Bitcoin's next major target is around $141K. Traders and investors should consider these levels in their analysis and avoid emotional decisions during market corrections
good luck
mehdi
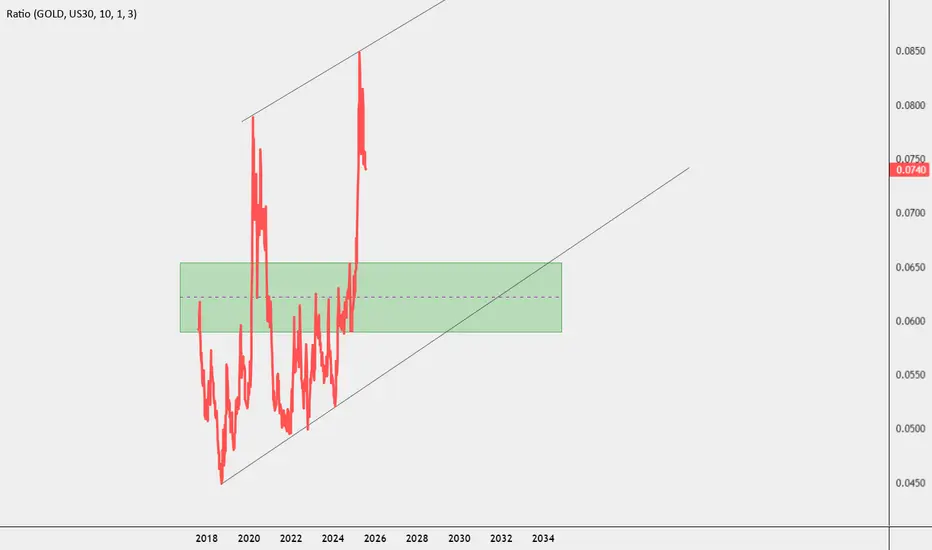
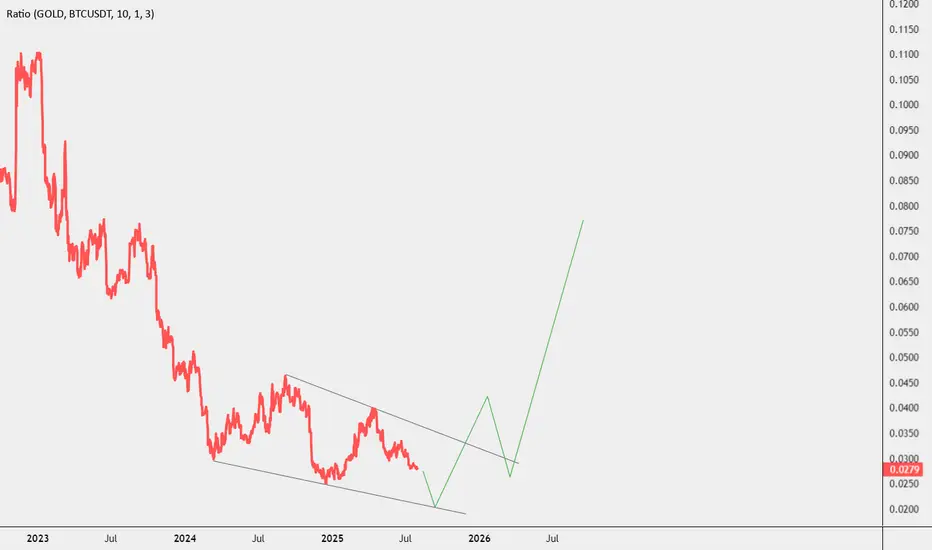
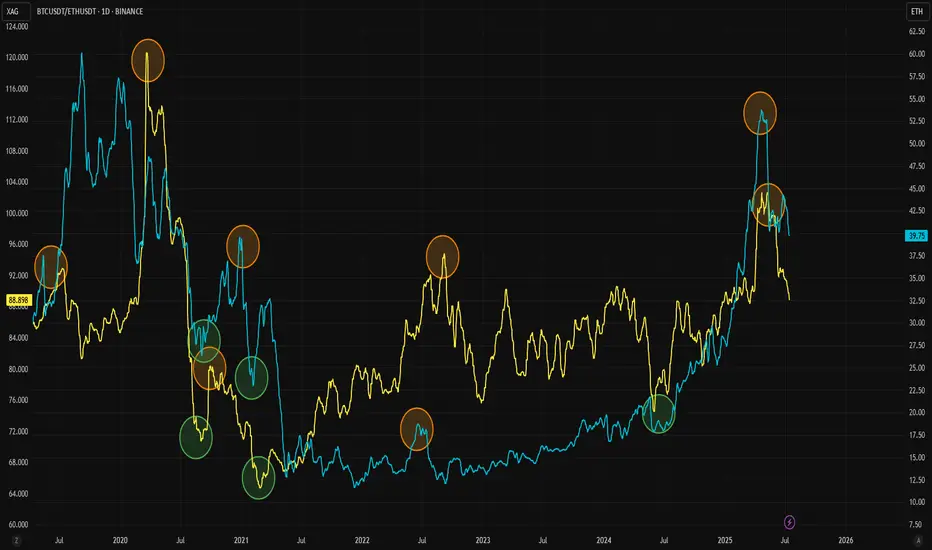
Want to Know What Happens in Crypto? Check Silver InsteadThe Gold/Silver ratio is one of the key indicators that highlights major turning points in modern economic history. Similarly, the ETH/BTC ratio is widely followed as a gauge of strength in the crypto market and the beginning of altcoin seasons. Interestingly, these two ratios also appear to correlate well with each other.
As adoption of both Ethereum and Bitcoin has grown, the Gold/Silver and BTC/ETH ratios have started to move more closely together. They often follow similar patterns, with tops and bottoms forming one after the other. For clarity, this analysis uses the BTC/ETH ratio rather than ETH/BTC.
Historically, BTC/ETH tends to lead during market tops, followed by a similar move in the Gold/Silver ratio. This pattern has been observed repeatedly since 2020. When it comes to bottoms, the timing between the two ratios is usually tighter, as seen during the 2020, 2021, and 2024 lows.
The latest signal came from a top in the BTC/ETH ratio, and the Gold/Silver ratio now appears to be following that move. Given the cyclical nature of crypto markets, both ETH and silver could be at the early stages of new upward trends. For a potential trend reversal, it may be wise to keep a closer eye on silver in the coming weeks.

Nothing Changed, Still BullishDO NOT FORGET USING A STOP LOSS
Warning:
This is just a suggestion and we do not guarantee profits. We advise you analyze the chart before opening any position.
I hope you are always profitable

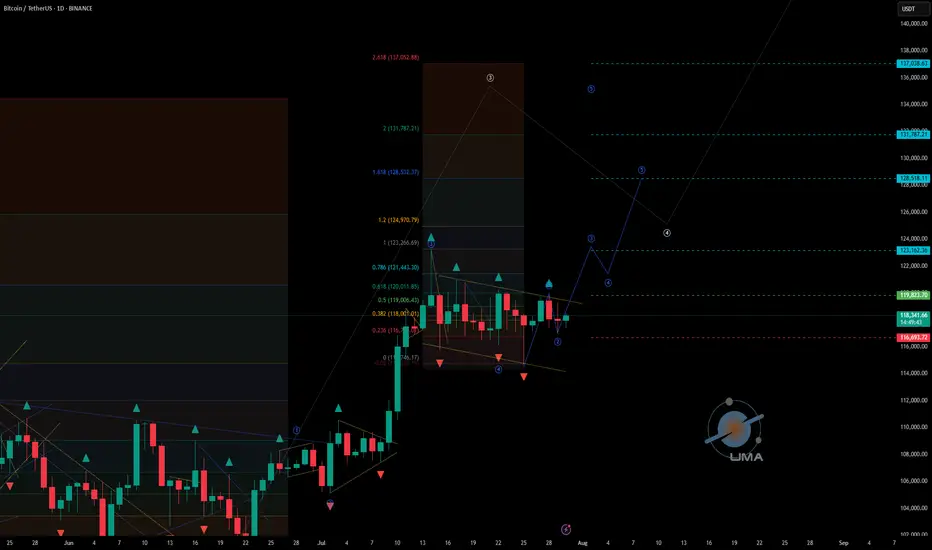
BTCUSDT - UniverseMetta - Signal#BTCUSDT - UniverseMetta - Signal
D1 - Formation of potential 3rd wave from the level in continuation of the 5th wave on W1. Stop behind the maximum of the 2nd wave.
Entry: 119823.70
TP: 123162.36 - 128518.11 - 131787.21 - 137038.63
Stop: 116693.72
BTCUSD IS still bullish? Yes sure
Hi dears
I think Bitcoin is continuing to rise. The first target is probably $120,000 and then $140,000.
What do you think?
If you agree with me, please like and comment.
Thank you.
BTCUSDT-4H {Now Eyes on the Buy-Side Sweep}BTC on the 4H chart just executed a classic liquidity grab at support, followed by a strong bullish push.
🔹 Descending trendline tapped multiple times (indicating compression)
🔹 Entry zone forming on retest of previous demand
🔹 Target: Buy-side liquidity above $123K
🔹 Volume + RSI divergence supports the bullish bias
