BTC/USDT: Define Your Next Winning MoveHere's the reality: While others panic and second-guess, successful traders recognize the blueprint when they see it.
The Setup That Separates Winners From Losers
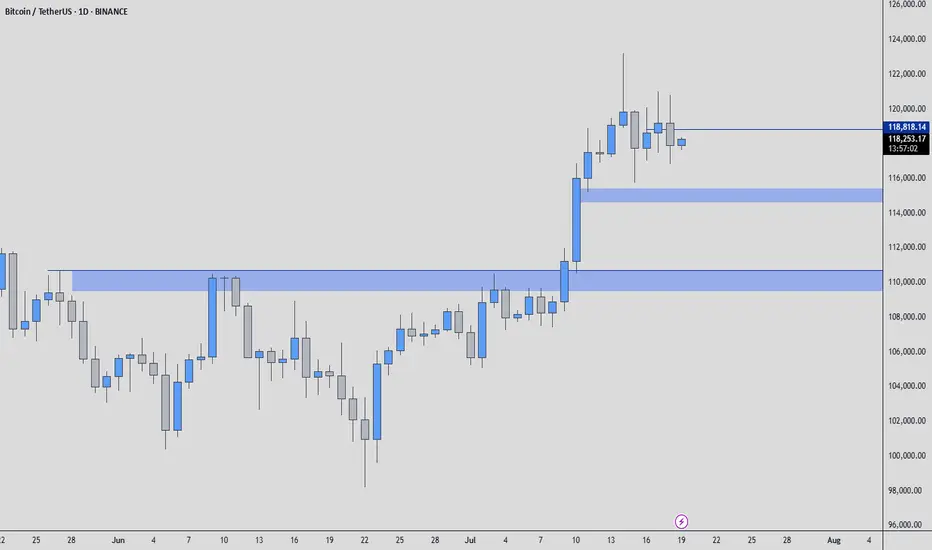
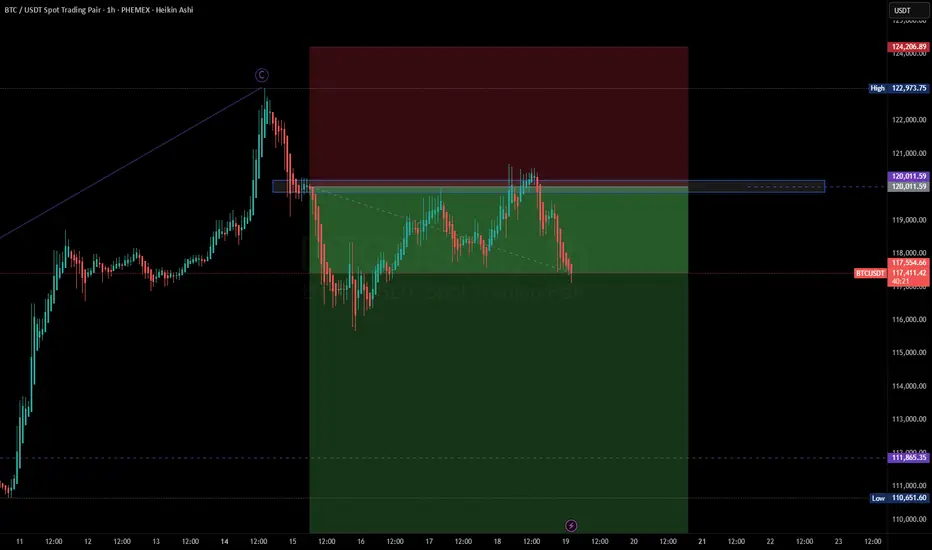
Two major support zones (marked in blue) tell the complete story. My footprint CDV analysis confirms what institutional money already knows - these levels aren't suggestions, they're battle lines.
Your Proven Path Forward
Zone 1: Primary accumulation target - where smart money loads up
Zone 2: Final defense line - where rebounds launch
The Choice Is Simple
Execute at these levels with precision, or watch from the sidelines as others capitalize. My track record speaks for itself - these aren't hope-based predictions, they're data-driven opportunities.
What Happens Next
Follow this blueprint: You position at support, manage risk precisely, and capture the inevitable bounce that follows institutional accumulation.
Ignore it: Watch others profit while you chase price higher later.
Bottom Line
The market has drawn the map. The footprint data confirms the plan. Your success depends on one thing: execution when opportunity knocks.
The zones are marked. The analysis is complete. The choice is yours.
BTCUSDT trade ideas
BTCUSD LongThe analysis is given on the chart! I'm back on the charts after 9 months i guess. Would learn back again for the next 6 months and come back like an OG profitable trader.
In God we trust ~ Amen.
THIS IS NOT A FINANCIAL ADVICE.

Bitcoin Liquidity updateCRYPTOCAP:BTC
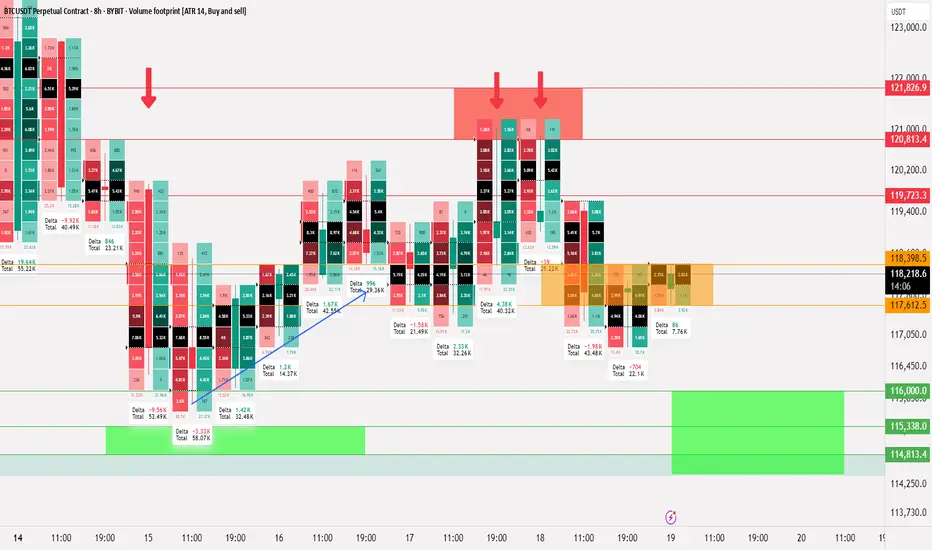
📄 Update on liquidity movement and key liquidity cluster points
◀️ Summary of the first movement: A sale occurred at 121826 and a break happened at 117612, after which liquidity was collected between 116 - 115
◀️ After collecting liquidity, we mentioned that breaking 117612 would allow testing 119723, and that is what happened
⭕️ Now, a selling range has formed between 120813 - 121826, which is clear on the price chart and the way it bounced down
🟣 The current movement is confined between 118398 - 117612
📄 Regarding trading ideas:
⭕️ The thought here is to buy between 11600 - 114813 if a break occurs at 117612 and trading starts below it
⭕️ The second idea, in case this break does not happen, is to wait for confirmation of trading above 118398, and in this case, it's preferable to wait until Monday
BTCUSDT 1 Month Trading Idea... for next 2 Years...I think BTCUSDT will go back to 30,000 - 40,000 USDT price range befor it will go back to 200,000 USDT

Bitcoin Bearish Outlook | Rejection from Key Resistance – TargetBitcoin has recently tested a strong structural resistance zone and showed clear signs of rejection, marked by bearish candlestick formations and declining bullish momentum.
This reaction suggests a potential short-term correction, especially as price begins to move away from the resistance with increased bearish pressure.
The next area of interest lies around the Fair Value Gap (FVG) formed in the range of [insert your FVG zone, which could act as a magnetic target for price in the coming sessions.
Should the price continue its downward move and break below minor support levels, this FVG zone becomes a probable destination.

BTCUSDT BTC/USDT (Bitcoin):
Trend: Strong uptrend.
Current Conditions: Price is near key resistance around $117,000-$121,000 after a sharp rise.
Entry Recommendation: Entry is not recommended at this time. It is better to wait for a correction to the previous support area (e.g., $109,000-$111,000 or $105,000-$108,000) and look for confirmation of a bullish reversal. Entry at current levels is high risk due to the potential for a correction.
Cryptocurrency Futures Market Disclaimer 🚨🚨🚨
Trading cryptocurrency futures involves high risks and is not suitable for all investors.
Cryptocurrency prices are highly volatile, which can lead to significant gains or losses in a short period.
Before engaging in crypto futures trading, consider your risk tolerance, experience, and financial situation.
Risk of Loss: You may lose more than your initial capital due to the leveraged nature of futures. You are fully responsible for any losses incurred.
Market Volatility: Crypto prices can fluctuate significantly due to factors such as market sentiment, regulations, or unforeseen events.
Leverage Risk: The use of leverage can amplify profits but also increases the risk of total loss.
Regulatory Uncertainty: Regulations related to cryptocurrencies vary by jurisdiction and may change, affecting the value or legality of trading.
Technical Risks: Platform disruptions, hacking, or technical issues may result in losses.
This information is not financial, investment, or trading advice. Consult a professional financial advisor before making decisions. We are not liable for any losses or damages arising from cryptocurrency futures trading.
Note: Ensure compliance with local regulations regarding cryptocurrency trading in your region.
thanks for like and follow @ydnldn to have more information outlook and free signal.
About me :
"I am a passionate swing trader focused on analyzing financial markets to capture profit opportunities from medium-term price movements. With a disciplined approach and in-depth technical analysis, I concentrate on identifying trends, support-resistance levels, and price patterns to make informed trading decisions. I prioritize strict risk management to protect capital while maximizing profit potential. Always learning and adapting to market dynamics, I enjoy the process of refining strategies to achieve consistency in trading."
BTC #Bitcoin (BTC/USDT) 1-hour chartThis Bitcoin (BTC/USDT) 1-hour chart shows a bearish breakout from a symmetrical triangle or rising wedge pattern. The breakout is confirmed by a strong red candle below the lower trendline, suggesting downward momentum.
Pattern: Bearish wedge/triangle.
Breakout Level: ~118,000 USDT.
Target Zone: Around 112,511 USDT, marked as a potential reversal area.
Resistance: ~119,315 USDT.
This indicates bearish sentiment in the short term unless BTC quickly reclaims the upper trendline.
Thanking you


_Bitcoin Update
As you all know recently BTC just made a ATH record and aggressive move up panda fam right ? 🚀
Now bitcoin is consolidating or moving sideways in this structure panda fam same time altcoins are moving crazy upwards like altszn 🤯🚀
GOOD NEWS : Bitcoin is forming a possible good bullish structure for continuation pump panda fam, First confirmation will be break on trend resistance and reclaim above NEW ATH.
TAKE NOTE : As long as we are inside on the structure its still consider as sideways panda fam or ranging in short undecided directional bias. ✍️

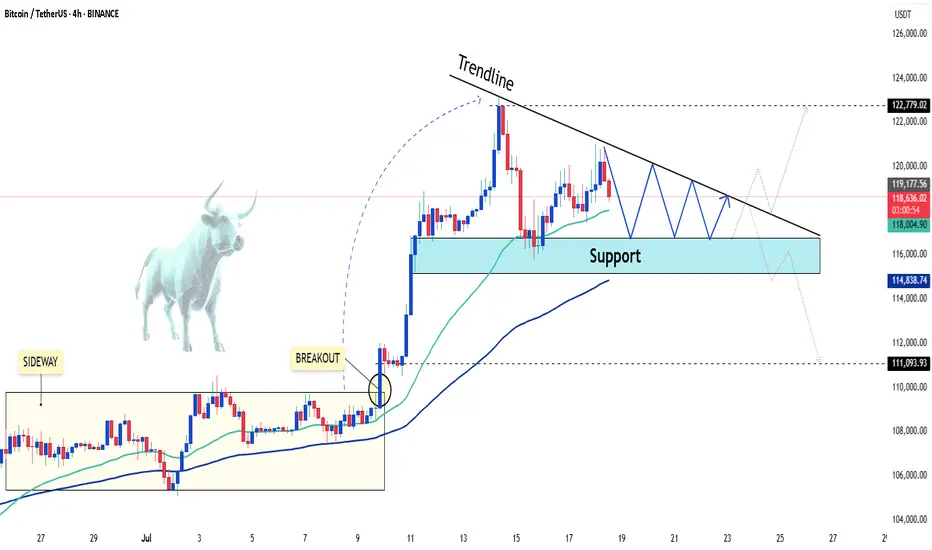
BTCUSDT: A Period of Adjustment and the Next TrendAfter a strong rally to record highs, BTCUSDT is currently entering a period of slight correction. The coin is now trading around 118,500 USD, down more than 0.57% on the day.
From a technical perspective, BTCUSD is moving within a narrowing price wedge, showing a slight downtrend. The support level at 116,500 USD is acting as a springboard for the Bulls. However, as the price approaches the tip of the wedge, a breakout may occur at any time, with two possible scenarios highlighted on the chart.
My personal outlook is that BTCUSDT will continue to decline in the short term before breaking out of the wedge in an upward direction. What do you think about BTCUSDT?
Please share your thoughts in the comments and don’t forget to like this post!
Wishing you all happy and successful trading!
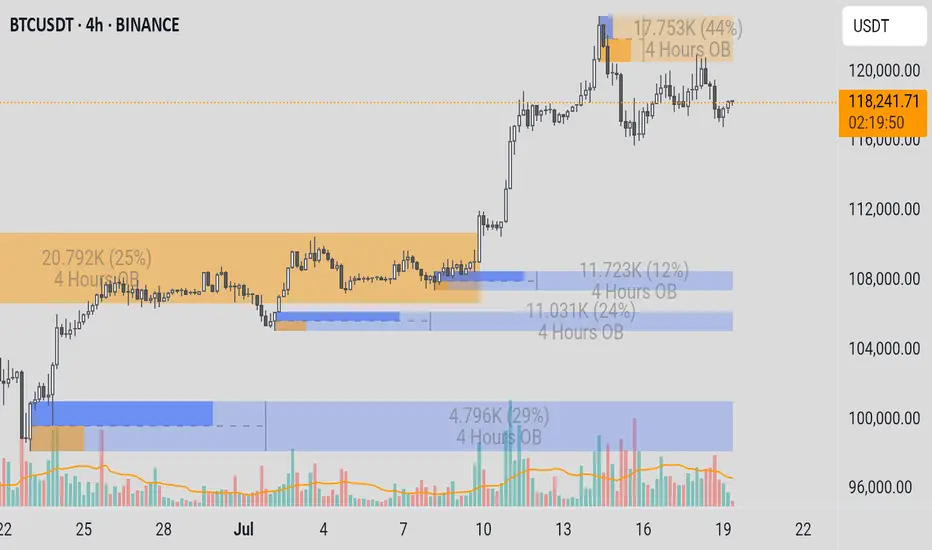
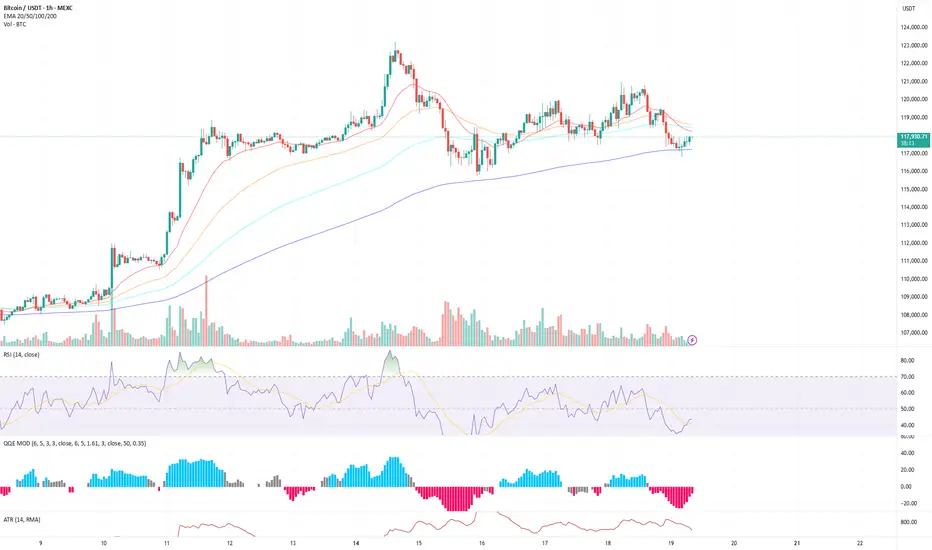
BTC Pullback Near 200 EMA – Bounce or Breakdown?Bitcoin is currently undergoing a measured pullback after its recent push toward $121K. On the 1H timeframe, price has tested the 200 EMA and held so far, forming a short-term support near $117K. This aligns with a prior consolidation area and is showing some early signs of bottoming.
On the 4H chart, price is also consolidating after a healthy run-up. While momentum has cooled, BTC remains above key moving averages. RSI is approaching mid-range levels (~48), and the QQE is lightly bearish but not aggressive.
Key Zones to Watch:
Support (1H + 4H confluence):
🔹 $117,000 – $117,300 (EMA 200 + historical pivot + bounce region)
Resistance/Breakout Target:
🔹 $118,500 – $119,500 → Area where shorter EMAs are clustered
🔹 $121,000 → Previous local high
Take Profit (if bounce plays out):
🔹 TP1: $119,200
🔹 TP2: $120,800
🔹 TP3: $122,800
Scenarios:
Bullish Bias (if price reclaims $118.5K+):
Reclaiming EMAs and printing higher lows would suggest continuation.
RSI crossing 50 and increasing volume would confirm short-term bullish momentum.
Bearish Bias (if $117K breaks):
Breakdown from this base could send BTC to test $116K or even back to $114.5K range.
Look for volume spike + MACD/QQE confirmation for further downside.
Summary:
BTC remains in a constructive uptrend on higher timeframes. The current pullback is still within normal range, especially while price respects the 200 EMA on both 1H and 4H charts. This is a key decision zone—bulls want to see a reclaim of $118.5K, while bears need to break below $117K to take control.

BTC/USDT (1H) Market Analysis – July 19
BTC is hovering just below the 200 EMA, having recently bounced off it with a small recovery candle.
The recent downtrend from the $121K peak has flattened, and price is forming a potential short-term base above the $117K support.
There's low-volume chop, suggesting indecision or a pause before the next leg.
Key Technical Levels
Support zone: $117,200 – $117,500 (200 EMA + recent wick support)
Resistance zone: $118,500 – $119,000 (cluster of short EMAs + prior supply)
Breakout level: $119,500 (for a bullish continuation)
Breakdown level: $116,800 (for further downside)
Indicator Insights
RSI: 42.86 and curling up slightly → shows a potential recovery attempt but still below neutral.
QQE MOD: Deep in bearish territory (–8.53), but we’re seeing the first signs of easing negative momentum.
ATR: 681 and gradually falling → declining volatility, aligning with consolidation.
Bias & Scenarios
Bullish Case:
If BTC holds above the 200 EMA and breaks above $118.5K with volume, we could see a retest of the $119.5K–$120K zone.
RSI breaking 50 and QQE printing lighter red would confirm upward momentum.
Bearish Case:
Failure to reclaim EMAs and a drop below $117K could send price toward $116K or even back to the breakout base at $114.5K.
Watch for volume spikes on red candles and RSI breaking back under 40.
Sell and wait because of the 100days growth rule 100 days for ETH BTC and most. Some more days for doge maybe and solana. Then i may buy back if it is a quick drop.

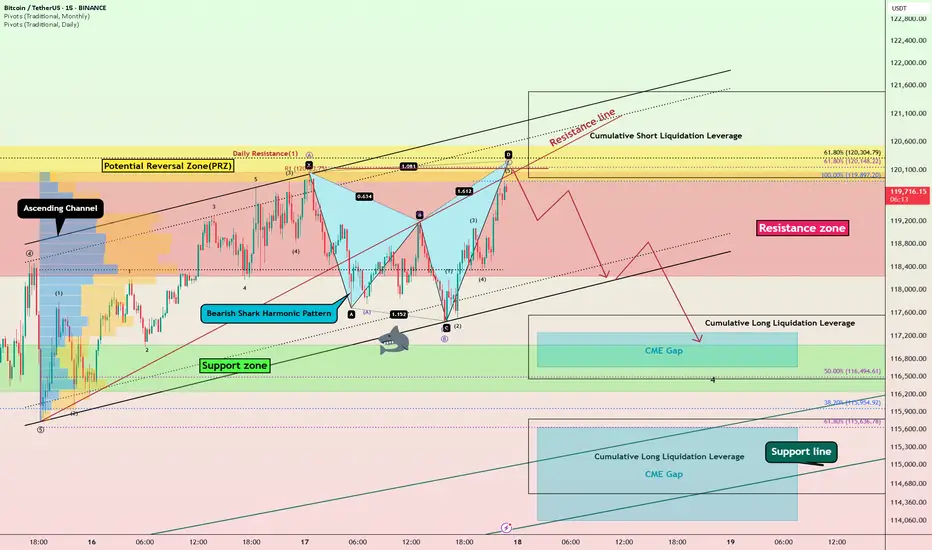
Bitcoin Bearish Shark Detected – CME Gap Below $115K in Sight?Today's analysis is on the 15-minute timeframe , following the previous analysis I shared with you on the 1-hour timeframe .
Bitcoin ( BINANCE:BTCUSDT ) is currently trading in the Resistance zone($120,100-$118,240) near the Potential Reversal Zone(PRZ) and Cumulative Short Liquidation Leverage($121,490-$119,965) .
From a technical perspective , it looks like Bitcoin is completing the Bearish Shark Harmonic Pattern on the 15-minute timeframe .
From an Elliott wave theory perspective, it looks like Bitcoin is completing the microwave 5 of wave C of the Zigzag Correction(ABC/5-3-5) .
I expect Bitcoin to start falling from the top of the ascending channel and at least decline to the lower line of the descending channel, and if the ascending channel breaks this time, we should wait for the CME Gap($117,255-$116,675)/CME Gap($115,060-$114,947) to fill.
Cumulative Long Liquidation Leverage: $117,556-$116,465
Cumulative Long Liquidation Leverage: $115,773-$114,513
Do you think Bitcoin can create a new ATH again?
Note: Stop Loss(SL)= $121,620
Please respect each other's ideas and express them politely if you agree or disagree.
Bitcoin Analyze (BTCUSDT), 15-minute time frame.
Be sure to follow the updated ideas.
Do not forget to put a Stop loss for your positions (For every position you want to open).
Please follow your strategy and updates; this is just my Idea, and I will gladly see your ideas in this post.
Please do not forget the ✅' like '✅ button 🙏😊 & Share it with your friends; thanks, and Trade safe.
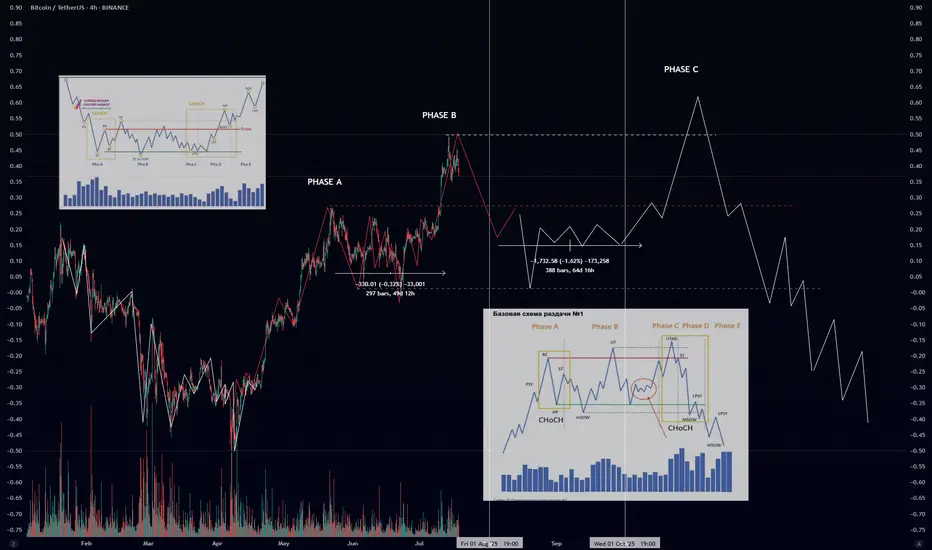
Wyckoff Distribution Schematic #1 – ExplainedIf you’ve ever wondered how smart money offloads their positions before a major downtrend — this is it. The Wyckoff Distribution Schematic #1 is the mirror opposite of accumulation. It reveals how institutions distribute (sell) to retail before the market collapses.
🔍 Phases Breakdown:
🟠 Phase A – Preliminary Supply & Buying Climax
PSY (Preliminary Supply): First signs of selling pressure.
BC (Buying Climax): Sudden surge in price with high volume – often traps late buyers.
AR (Automatic Reaction): Price drops as buyers lose momentum.
ST (Secondary Test): Retest of the top – often with lower volume.
🔄 CHoCH (Change of Character): Early warning sign that supply is increasing.
🟡 Phase B – Building the Cause
Sideways price action where large players distribute their holdings.
UT (Upthrust): Fake breakout above resistance.
mSOW (Minor Sign of Weakness): Slight breakdowns showing cracks in structure.
🔴 Phase C – The Trap
UTAD (Upthrust After Distribution): Final fakeout to trap bulls before the real drop.
Market often shows strength… right before the collapse.
Another CHoCH confirms the shift toward bearish control.
🔵 Phase D – Breakdown Begins
LPSY (Last Point of Supply): Final bounces with weak demand.
MSOW (Major Sign of Weakness): Strong breakdown on high volume — momentum shifts decisively.
⚫ Phase E – Downtrend
Distribution complete.
Price trends downward with weak rallies.
Retaiя is left holding the bag.
📊 Volume matters: look for volume spikes on upthrusts and breakdowns, and declining volume on bounces.
🔁 Compare with Accumulation:
Accumulation ends in Spring → Uptrend 📈
Distribution ends in UTAD → Downtrend 📉
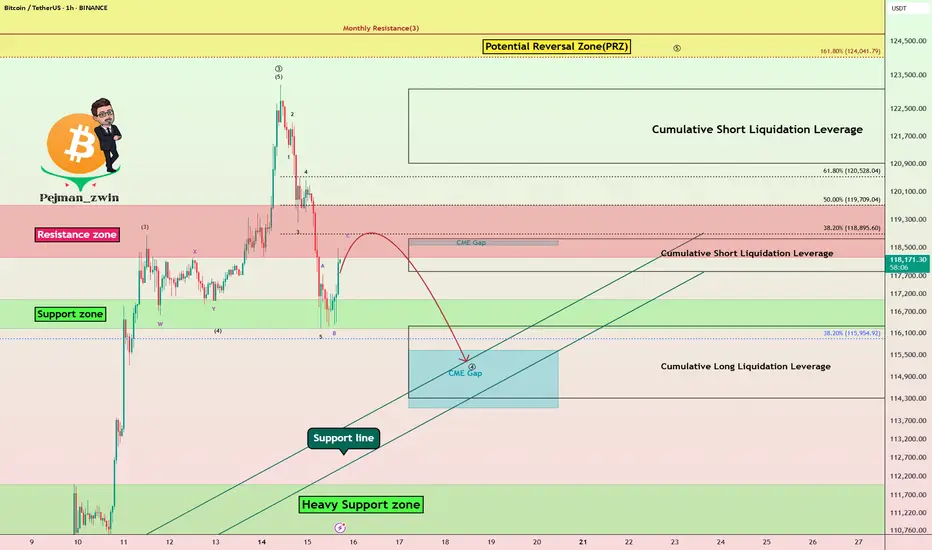
Bitcoin Struggles Below $120K:Will the CME Gap Pull Price Lower?Bitcoin ( BINANCE:BTCUSDT ) has been experiencing a high momentum bullish trend in recent days, which few people expected, especially when it crossed $120,000 . However, in the past 24 hours , Bitcoin has fallen back below $120,000 .
Bitcoin is currently trading in the Resistance zone($119,720-$118,240) and Cumulative Short Liquidation Leverage($118,757-$117,829) on the 1-hour time frame .
In terms of Elliott Wave theory , Bitcoin appears to be completing a main wave 4 . Main wave 4 is likely to have a Zigzag Correction(ABC/5-3-5) .
I expect Bitcoin to attack the Support lines and fill the CME Gap($115,060-$114,947) in the next hour.
Cumulative Short Liquidation Leverage: $123,087-$120,922
Cumulative Long Liquidation Leverage: $116,305-$114,325
Do you think Bitcoin can create a new ATH again?
Note: Stop Loss(SL)= $121,000
Please respect each other's ideas and express them politely if you agree or disagree.
Bitcoin Analyze (BTCUSDT), 1-hour time frame.
Be sure to follow the updated ideas.
Do not forget to put a Stop loss for your positions (For every position you want to open).
Please follow your strategy and updates; this is just my Idea, and I will gladly see your ideas in this post.
Please do not forget the ✅' like '✅ button 🙏😊 & Share it with your friends; thanks, and Trade safe.
BTC - local situation (1h) SHORT🔻 Breaking down from a bearish pattern.
I expect a local decline to $114,000 - $112,000 on the 1h timeframe.

BTC - bearish wedge, 60k$ not a joke🔻 Globally, we are in a bearish wedge.
The price made a fake breakout and currently looks weak. On the 1D timeframe, we’re in an ascending channel similar to what we saw in 2021. Back then, after making a second higher high, the price sharply reversed downward.
📉 I believe the relevant downside targets are $60,000 and $40,000.
🔺 I’m currently in a short position, with a stop at $125,333.

ABC Short PositionThis is a live trade, ABC short position on the 1hr time frame. There is a larger short position on the 4hr chart if we break 111,865 area. Watching for reversals & ABC formations to the upside to closeout trade.
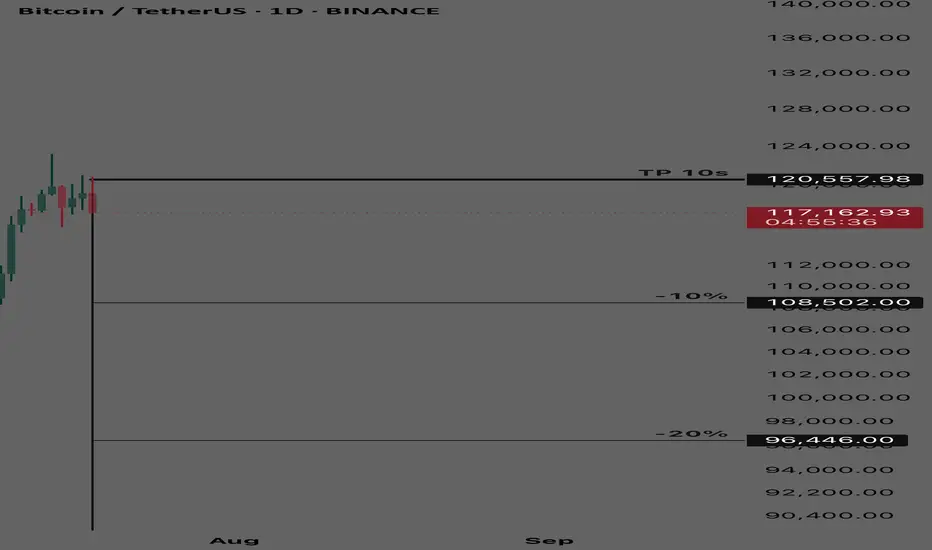
BTCUSDT - Short Term Buy Cycle BTCUSDT
Short term buy cycle
TP at 120558
% bubble ratio
Currently in a negative bubble either fair value at 120558, the cycle is a short term and expected to be closed within maximum 6 months
Spot trading plan:
Start to buy from (-10%) bubble ratio and below
Bitcoin Overall: New local low b4 ATHCurrently looking for something like the following, Take out the stops, and hold the the range below Before new all-time high

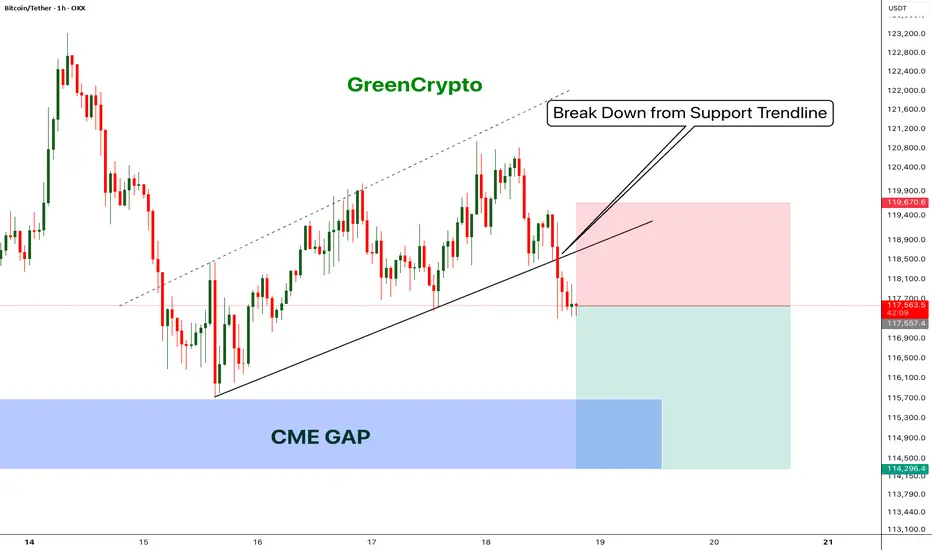
Bitcoin - Bears will push the price fill CME Gap- Bitcoin has broken down from the trending support,
- Price has been going down without any retracement on 1H candle.
- Looks like bitcoin will CME gap before going up further.
- A high risk Short Trade opportunity is here
Entry: 117,431
Stop Loss: 119,670
TP1: 116152.8
TP2: 114403.6
Move SL to Breakeven on TP1 hit
Don't forget to like and follow
Cheers
GreenCrypto
Need to retest $91k before next big moveI think now Bitcoin can take healthy correction before to takeoff 🛫 for major upside move.
And if BTC break $124k than we can see $134.5k before take correction..
Let's see what will happen next..
