BTCUSDT trade ideas
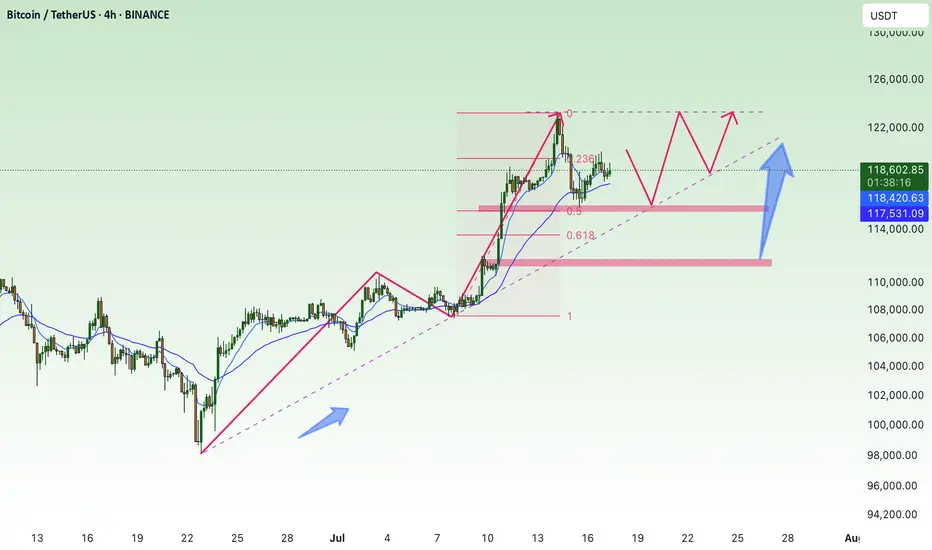
BTC - Make way for $126k!SO likely YOO, If it holds the orange box it gets to that part as supposed!

BTC Could Start Another Bullish WaveBTC Could Start Another Bullish Wave
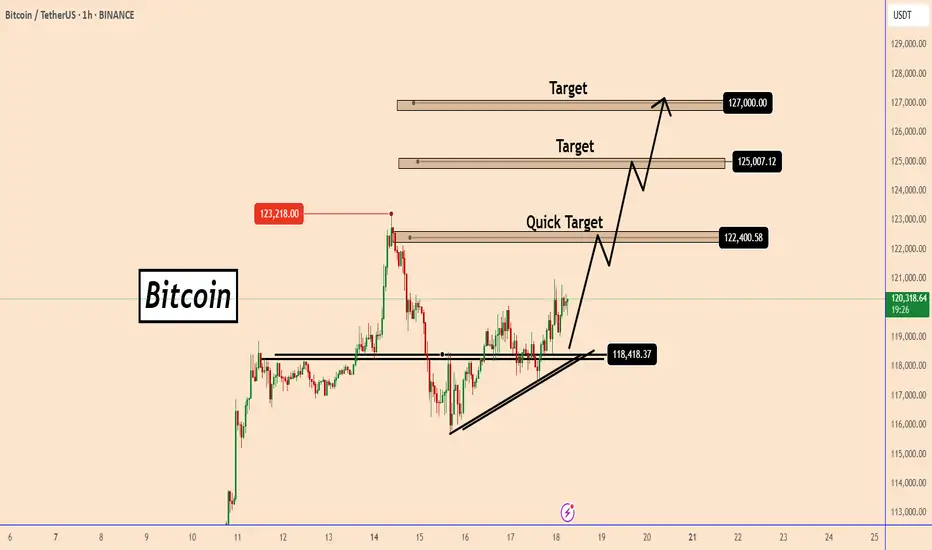
Over the past two days, bitcoin has been holding strong above 118400. It seems that this small structural area could push BTC higher.
For now, ETH has performed better and BTC may follow suit.
I am looking for short-term targets near 122400, 125000 and 127000.
You may find more details in the chart!
Thank you and Good Luck!
PS: Please support with a like or comment if you find this analysis useful for your trading day
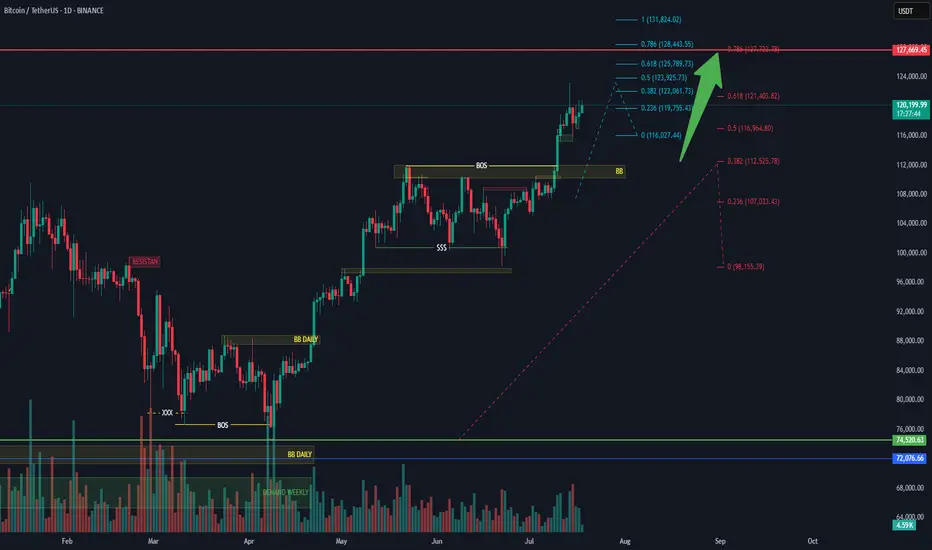
Bitcoin is ULTRA MEGA Bullish!See the trend lines and fib levels for your resistance and support levels. It's great that Bitcoin is breaking through the blue trend line on top. If it chops sideways here for a while at this level, this will serve as a strong new support level for bitcoin when it comes back down in Q4.
I believe $130k is the lowest potential target for bitcoins ATH this cycle. Until that level is approaching, I'm ultra mega bullish and trading altcoins with leverage. USDT Dominance and BTC Dominance are in free fall right now so altcoins are pumping hard while bitcoin chills at the resistance levels.
Check support at 115854.56-119086.64
Hello, traders.
If you "Follow", you can always get new information quickly.
Have a nice day today.
-------------------------------------
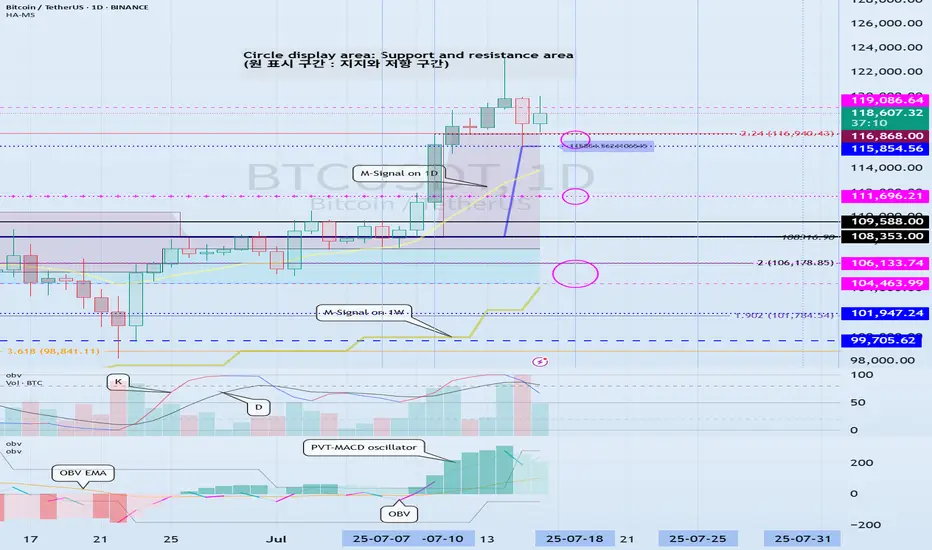
(BTCUSDT 1D chart)
On the 1W chart, the DOM(60) indicator was created at the 119086.64 point.
Accordingly, the key is whether it can be supported near 119086.64.
The meaning of the DOM(60) indicator is to show the end of the high point.
In other words, if it rises above HA-High ~ DOM(60), it means that there is a high possibility of a stepwise upward trend.
On the other hand, if it fails to rise above DOM(60), it is likely to turn into a downtrend.
The basic chart for chart analysis is the 1D chart.
Therefore, if possible, check the trend of the 1D chart first.
The DOM(60) indicator of the 1D chart is currently formed at the 111696.21 point.
And, the HA-High indicator was created at the 115854.56 point.
Therefore, since it cannot be said that the DOM(60) indicator of the 1D chart has been created yet, if the price is maintained near the HA-High indicator, it seems likely to rise until the DOM(60) indicator is created.
We need to look at whether the DOM(60) indicator will be created while moving sideways at the current price position or if the DOM(60) indicator will be created when the price rises.
If the price falls and falls below 111696.21, and the HA-High indicator is generated, the HA-High ~ DOM(60) section is formed, so whether there is support in that section is the key.
-
Since the DOM(60) indicator on the 1W chart was generated, if it fails to rise above the DOM(60) indicator, it is highly likely that the HA-High indicator will be newly generated as it eventually falls.
Therefore, you should also look at where the HA-High indicator on the 1W chart is generated when the price falls.
-
The next volatility period is around July 18 (July 17-19).
Therefore, you should look at which direction it deviates from the 115854.56-119086.64 section after this volatility period.
Since the K of the StochRSI indicator fell from the overbought section and changed to a state where K < D, it seems likely that the rise will be limited.
However, since the PVT-MACD oscillator indicator is above 0 and the OBV indicator is OBV > OBV EMA, it is expected that the support around 115845.56 will be important.
-
Thank you for reading to the end.
I hope you have a successful trade.
--------------------------------------------------
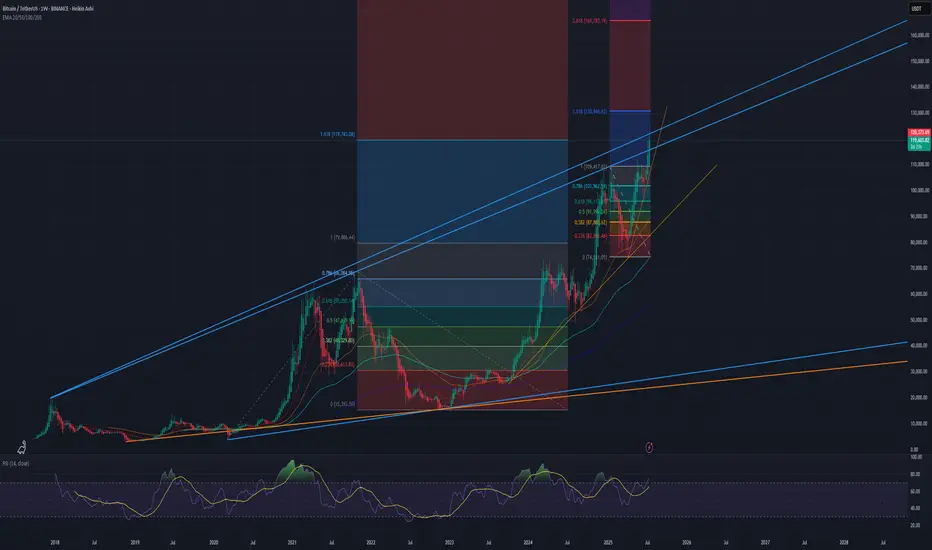
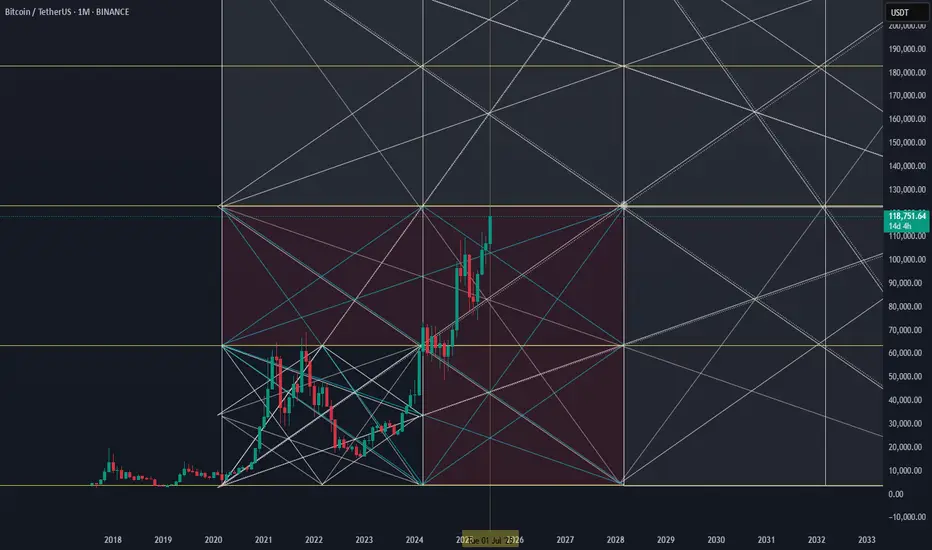
- Here is an explanation of the big picture.
(3-year bull market, 1-year bear market pattern)
I will explain the details again when the bear market starts.
------------------------------------------------------
BTC/USD bearish conf. finally?BTC printed a double top on the 5m and on the 1h.
BTC being very weak all over the day, even running against ETH and co.
That might be the signal for the retracement "everybody" is waiting for.
BYBIT:BTCUSDT.P

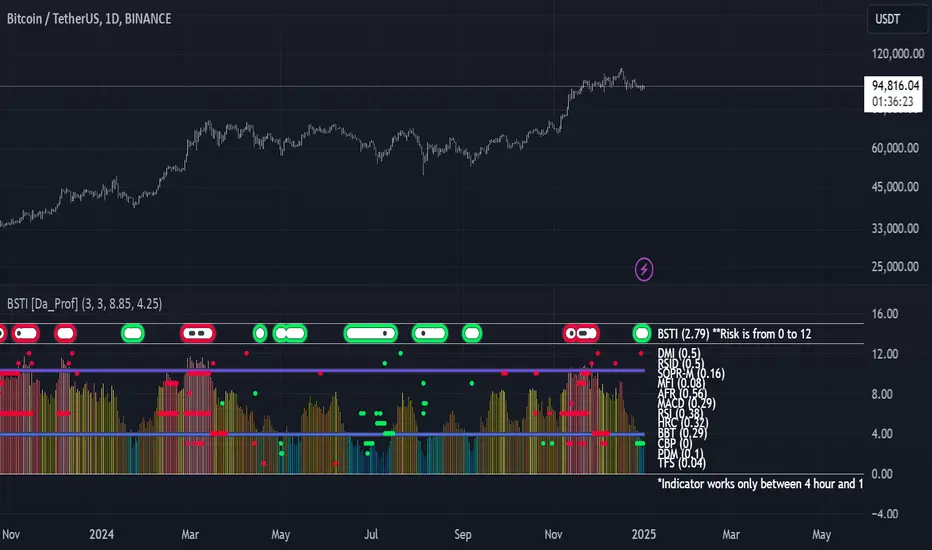
The $BTC Swing Indicator Signals Low RiskHappy New Year! The indicators that make up the Bitcoin Swing Trade Indicator (BSTI) are bottoming in aggregate. I've been searching for nice daily swing trade indicators and have been swapping them out in the BSTI. Therefore, the BSTI has gone through changes, but it is almost ready for prime time. I'm thinking of changing out one more indicator. The solid ones I'm keeping are the SOPR momentum, money flow, aggregate funding rate (AFR), MACD, RSI, hash rate capitulation, Bollinger band trend, Coinbase premium, plus directional movement, and the transaction fee spike indicators. Besides the AFR, which is neutral, the indicators are signaling generally low risk.
--Da_Prof
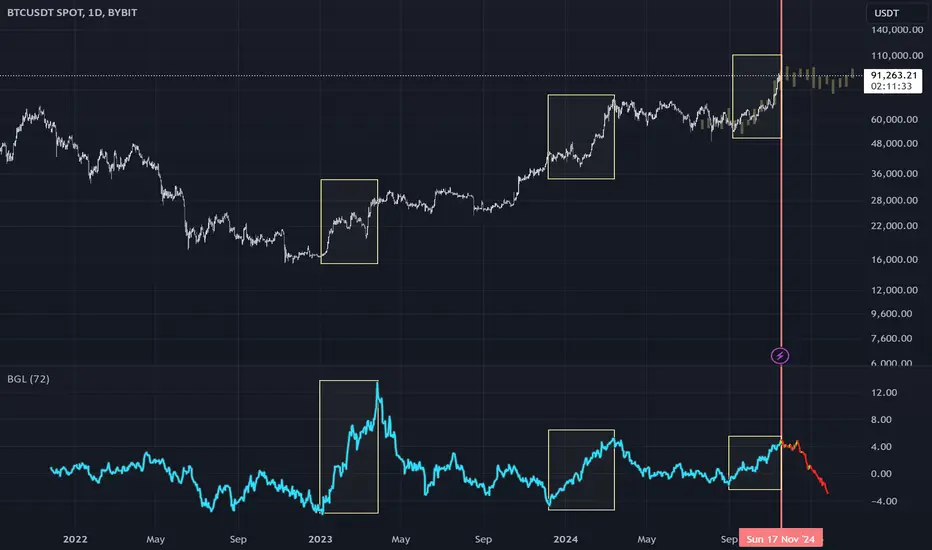
Global liquidity downtrend cometh!During this current BTC cycle, major uptrends in global liquidity have corresponded to major uptrends in the market 72ish days later. The last major uptrend in liquidity is about to run its course, pause, and then downtrend. If this relationship holds, we are at or near at least a pause in the local up trend. I have my popcorn ready to see if this plays out.
Note: The global liquidity prediction pauses until December 11th and then downtrends, so if we see floating higher prices until that point and then a pause, the relationship would still be valid.
Second Note: I will publish the BGL (Bitcoin Global Liquidity) indicator very shortly. Please test it out and DM me if you see any issues or have suggestions.
--Da_Prof
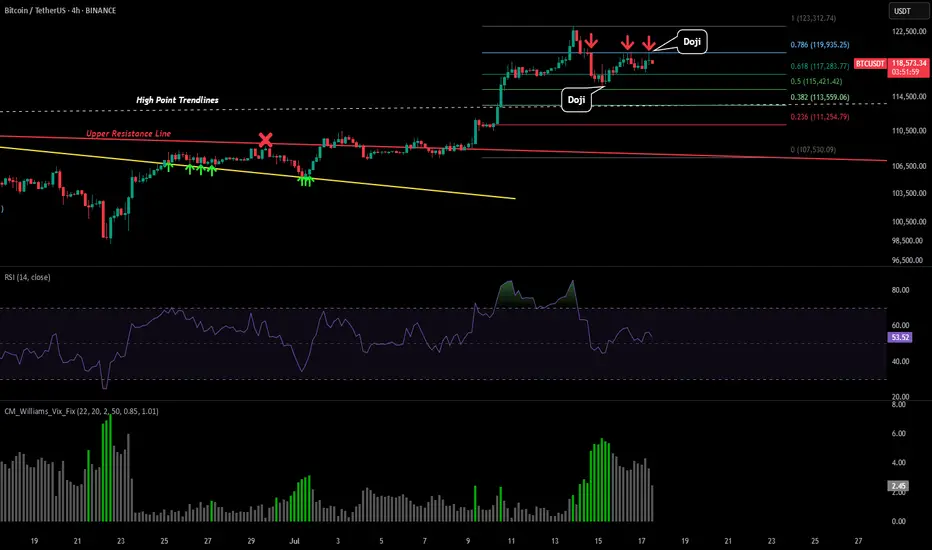
BTC - 0.786 LTF StrugglePlease refer to our previous post:
If you look at the predictive fib model we presented in our last post, we are starting to get more accurate developments. Today we just saw another rejection at our 0.786 predictive fib level with a potential reversal doji.
That is now 3 touchpoints of resistance right around $120k (which is also inline with the 1.618 extension).
Therefore if price starts to decline the predictive price targets to the downside remain in place.
Still bullish on BTC, but this will be the LAST UP SWING!Take Profit around 130K.
Daily close above 133K will fail the analysis.

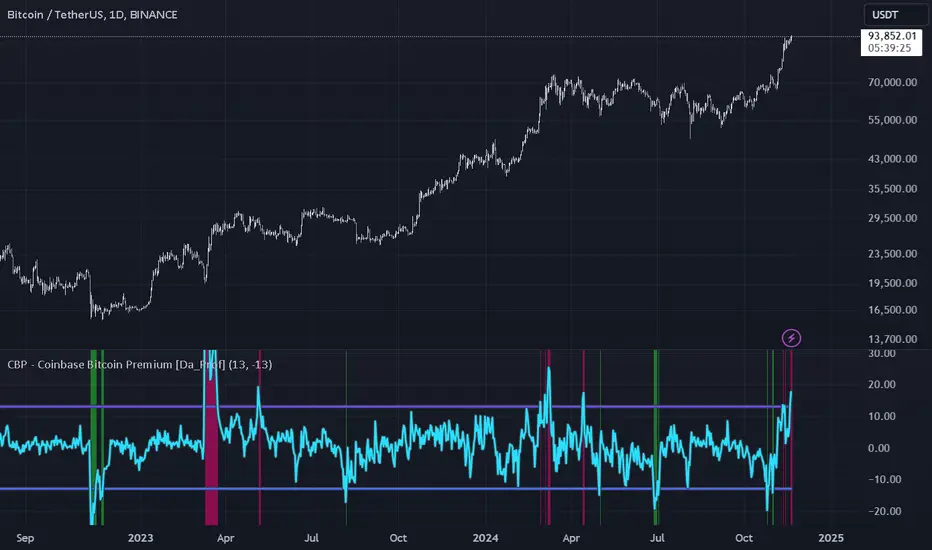
Coinbase Premium indicates High Risk on BTCThe Coinbase Premium Indictor shows the CBP risk is high. The previous times the CBP premium has reached these levels, CRYPTOCAP:BTC generally started a range or downtrend.
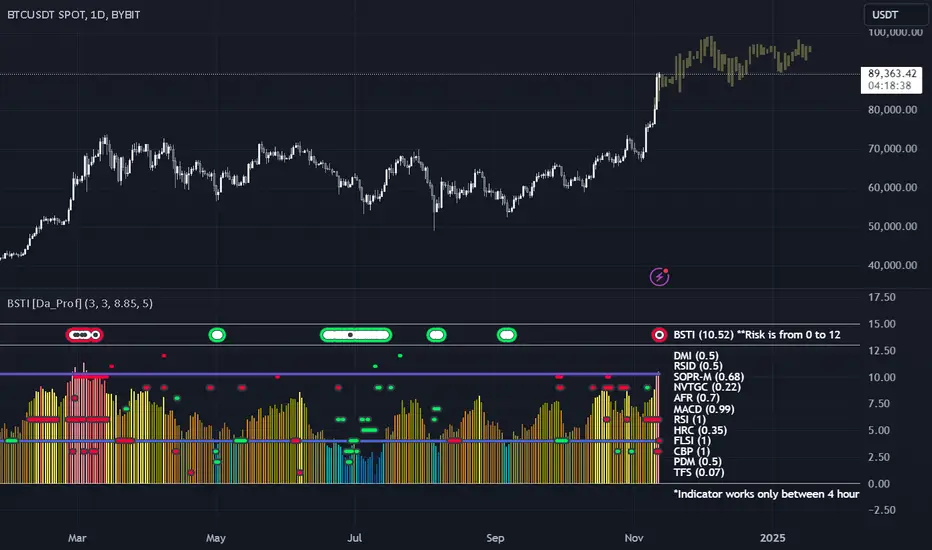
BTSI signals high riskThe BTSI has signaled a high risk area for BTC. These can happen and price can still go up for a while until a bear deviation. The bars pattern is what happened the last time.
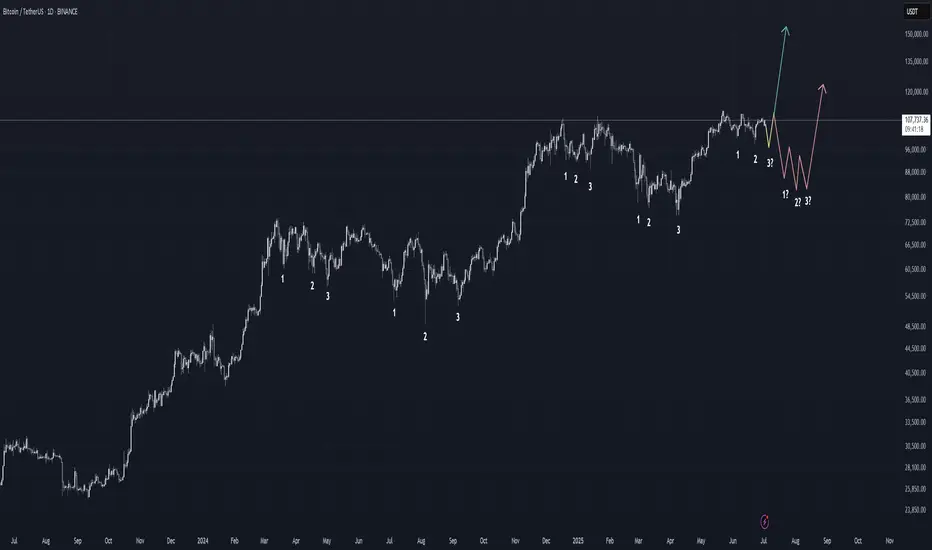
BTC third tap incoming? Recently, BTC has traded for a large amount of time in ranging environments. These ranges have started with a local range high and then an initial 3-tap accumulation (i.e., a local low and then two sweeps of that low) before making a solid attempt at the range highs. The sweeps of the lows are meant to shake people out and provide fuel to try to break higher. The previous two times, that initial attempt failed and the price was sent lower to put in a second 3-tap accumulation at lower prices.
Will the current price move back down to put in the 3rd tap of the current relatively small accumulation? That is my base case. I believe we will see some lower prices locally to put in the 3rd tap. I think the Bitcoin Swing Trade Indicator (BSTI) will fire off green one more time and then we will then make a run to try to break out of this current massive range (that started last year in November). This current range is fairly small, so it is not worth it to me to sell here to try to buy lower.
The bigger question is: Will we have enough fuel to durably break out of this range after the 3rd tap of the current accumulation (green line) or are we destined to repeat the pattern of the last two bigger ranges (red line), one of which we are still in? I personally believe we will break out after the smaller range 3rd tap (the green line) based on the larger context of cycle theory, how long we have been in this range, and how the current small range is part of the larger range starting back in November 2024.
It will be interesting to see what happens.
Da_Prof
Note that TV won't allow publication of a private/unpublished indicator anymore or I would have shown the BSTI, which is now published as invite only. It's implementation is too complicated to publish openly, so I don't feel comfortable doing that. If you want access, please DM me on TradingView. Thanks.
Why Your indicators Fail to Work For You and WHY.Many commonly used indicators—RSI, MACD, and others—show win rates around **30–40%** when used as direct trade signals and may make a slight profit overall, but loose in a ranging market.
Oddly enough, if you reverse them—buy when it says sell, sell when it says buy—you can often push the win rate up to **65–70%**.
But here’s the catch:
👉 Even with a high win rate, these “inverse strategies” still **tend to lose money** over time. Why? The few times the market trends it will wipe out any profits you might have made.
---
🧠 What's Really Going On?
* Indicators trigger **crowd behavior**, not institutional intent.
* Institutions use crowd-driven signals to identify **liquidity clusters**
* Standard signals become **traps**, not trade ideas.
I call this Hidden or Dynamic liquidity
So when indicators say "Buy!", the smart money sees that as an opportunity to sell *into* the crowd’s enthusiasm—then reverse the move once retail traders are trapped.
Institutions can see when, say the 20 SMA is about to cross the 50 SMA. This gives them a heads up that and opportunity may be coming to use the liquidity it generates from the ensuing retail trades to enter their opposing trades.
---
⚠️ Takeaway:
Indicators may be more useful as **tools to locate liquidity**, not predict direction.
Use them to observe where *others* are getting in, then ask:
🔍 *If I were a large player needing liquidity, where would I execute my order?*
See Indicators triggering not as entry positions but as potential pivot points.


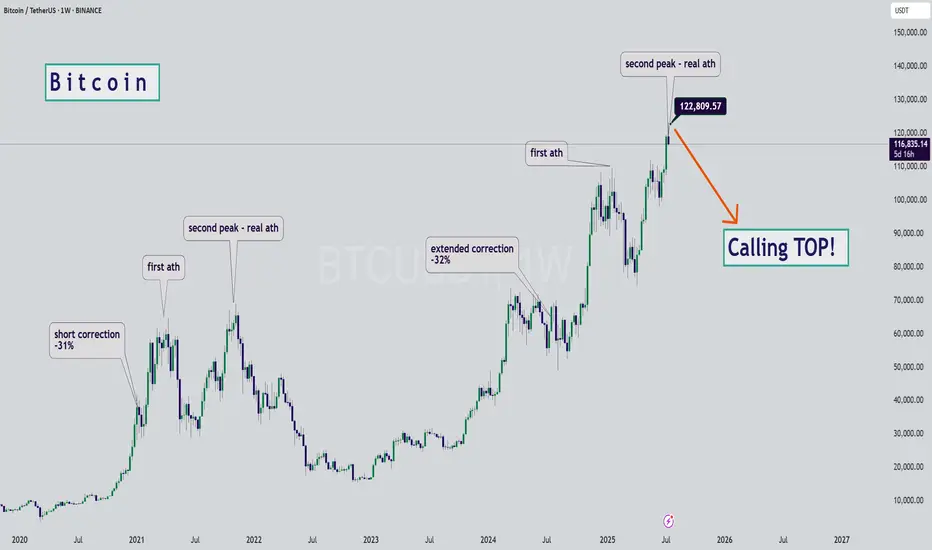
BTC - Calling the Start of the Bearish SeasonHello Watchers ☕
This was my previous Bitcoin update where I had a target of $116K, and also then closed all open positions at $122K:
I'm calling the top here mainly because of the way the chart looks, it really is classic Wyckoff if you look at the duration of the current bullish cycle, which has lasted a whole 973 Days with a 564% increase. What goes up, must come down!
Just for interest sake, the previous bullish cycle ran for 600 days with a 700% increase.
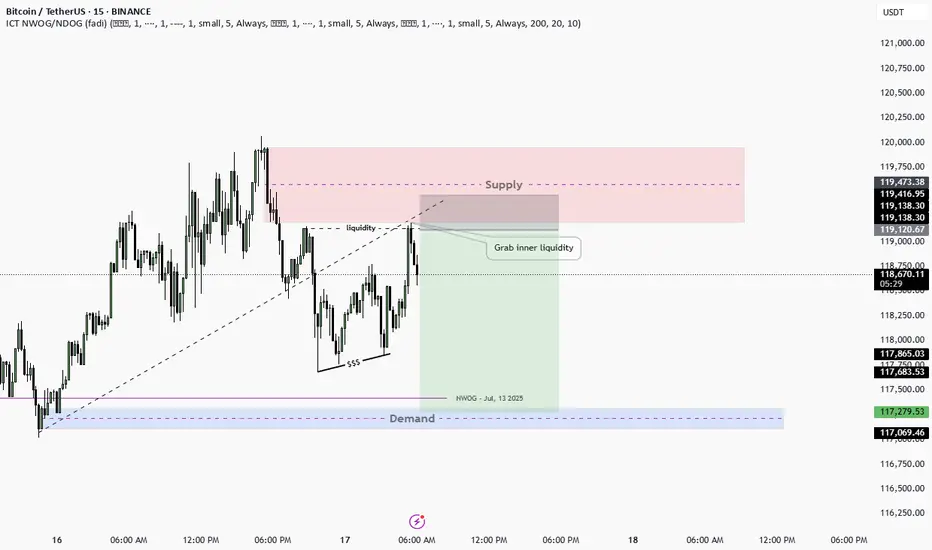
Daily Pan Trade NO.1SMC concept that actually work really nice after we take inner liquidity we going for demand zone
BTC - Signals of Cooloff IncomingPlease refer to our previous post:
To give additional detailed context of what to look for please look at our last post that is linked above. So far with recent price developments this idea is still intact.
What I have also outlined in todays post are some of the reason this short term retracement is still in place.
-Market has moved up very fast
-Lots of leverage from the highs need to be flushed
-Daily candle close below our first 1.618 extension target
-Daily RSI just got rejected from the 70
If we do see a retracement then all those price levels mentioned in our last post are valid. I have also add a predictive fib model that could outline important future price levels on the LTF.
Given this model does not have much price data to go off of the accuracy cannot be for certain but pay attention the the 0.382 around $113.6k and the predicted bottom around $107.5k if price drops that low.
The way price could avoid a LTF retracement is by the daily RSI reclaiming strength above the 70 level and negating the rejection. Will make an updated post if this is to occur.

BTC - Last Resistance Before New HighsPrice is back at the same zone that rejected it months ago — but this time with momentum and a clean trendline behind it. Stoch RSI is stretched, signaling a possible short-term cooldown… or a breakout into uncharted territory.
Keep your eye on that 126K liquidity magnet 👀
#Bitcoin #BTCUSD #CryptoTrading #ChartAnalysis #TechnicalAnalysis #BreakoutTrading #TrendlineSupport #QuantTradingPro #TradingView

BITCOIN PREDICTION: INSIDER DATA THAT WILL HIT YOU HARD(warning)I am sharing with you my personal insider data of what I know about Bitcoin right now!

BTC AI Prediction Dashboard - 6h Price Path (17.07.25)
Prediction made using Crypticorn AI Prediction Dashboard
Link in bio
BTCUSDT Forecast:
Crypticorn AI Prediction Dashboard Projects 6h Price Path (Forward-Only)
Forecast timestamp: ~10:30 UTC
Timeframe: 15m
Prediction horizon: 6 hours
Model output:
Central estimate (blue line): -119,394
Represents the AI’s best estimate of BTC’s near-term price direction.
80% confidence band (light blue): 118,475 – 119,566
The light blue zone marks the 80% confidence range — the most likely area for price to close
40% confidence band (dark blue): 117,621 – 120,336
The dark blue zone shows the narrower 40% confidence range, where price is expected to stay with higher concentration
Volume on signal bar: 121.96
This chart shows a short-term Bitcoin price forecast using AI-generated confidence zones.
Candlesticks reflect actual BTC/USDT price action in 15-minute intervals.
This helps visualize expected volatility and potential price zones in the short term.

BTC sideways above 115k💎 BTC PLAN UPDATE (July 17)
NOTABLE NEWS ABOUT BTC
Bitcoin Price Forecast: BTC Recovers as Trump Steps In to Revive Crypto Legislation Momentum
Bitcoin (BTC) saw a mild recovery, trading around $119,000 at the time of writing on Wednesday, after falling nearly 2% the previous day. This rebound followed an announcement by U.S. President Donald Trump on Wednesday morning, stating that the GENIUS Act is ready to be passed by the House during the legislative “Crypto Week”, sparking optimism in the crypto market. Furthermore, institutional demand continues to grow, with spot Bitcoin ETFs recording over $400 million in inflows on Tuesday, extending the growth streak since July 2.
TECHNICAL ANALYSIS
🧠 Pattern Overview:
The chart clearly displays an Elliott Wave pattern (1) → (2) → (3) → (4) → (5) along with Fibonacci Retracement and Extension levels, helping to identify potential support and resistance zones.
1. Elliott Waves:
Wave (3) was completed around the $122,144 zone and the market is currently in the corrective wave (4).
Wave (5) is expected to move upward with targets at:
• 1.618 Fibonacci Extension: ~$127,404
• Or further: ~$130,747
2. Support Zone (grey area below):
Located around $115,000 – $116,000, which is:
• The 0.5 – 0.618 retracement of Wave (3)
• Aligned with the EMA200 and dotted black trendline support.
If the price falls into this area, it’s highly likely to bounce back and form Wave (5).
3. Danger Zone if Broken:
If this support fails, price may fall deeper to:
• $113,200 (0.786 retracement),
• Or even lower: $111,600 – $111,800
4. Potential Scenarios:
Two main outcomes:
• Continued Uptrend: Price bounces from the support zone and heads toward $127,000 – $130,000
• Breakdown: If the support breaks, a deeper decline may occur, breaking the wave structure.
Follow the channel for continuous and up-to-date analysis on XAUUSD, CURRENCIES, and BTC.