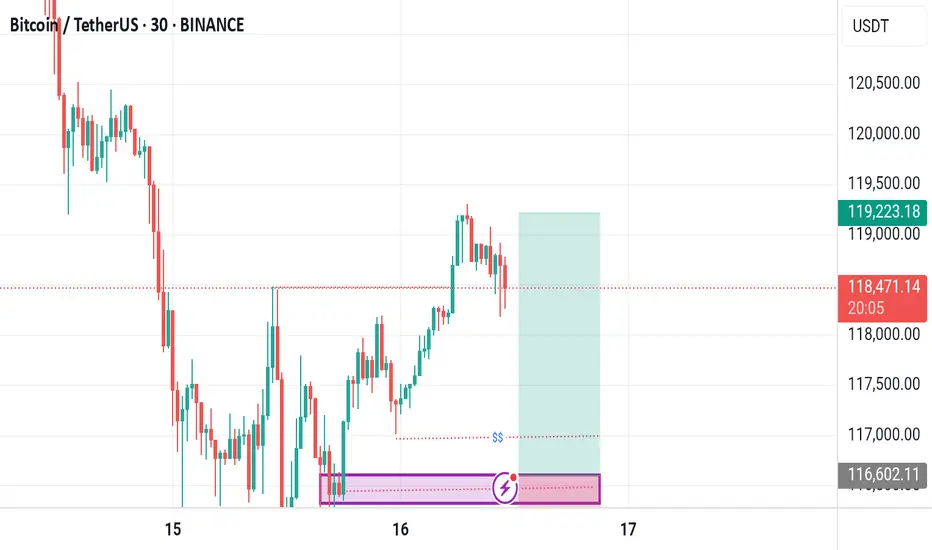
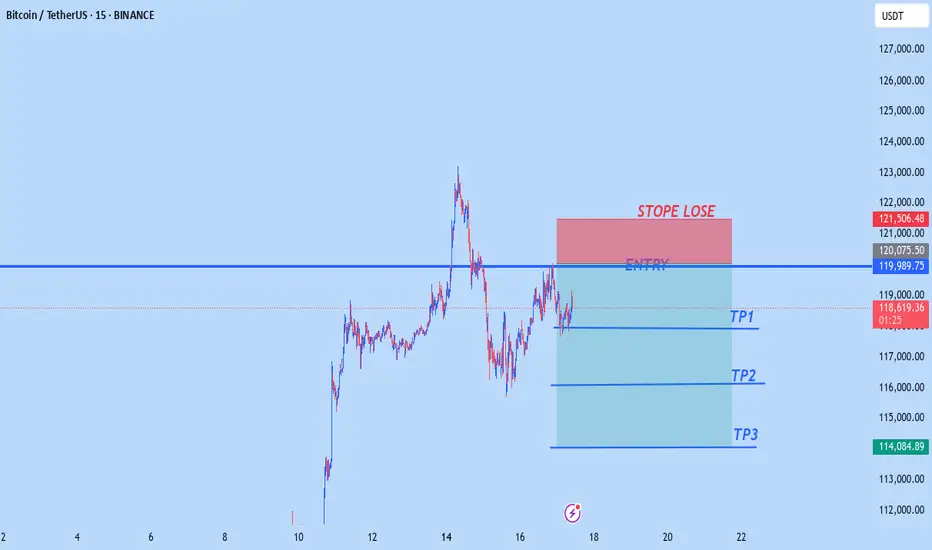
BTCUSD NEW OUTLOOK Btcusd sell from 120,000
tp1 118,000
tp2 116,000
tp3 114,000
Stopelose 121,500
Trade at your own risk
BTCUSDT trade ideas
Bitcoin Forever Bitcoin's Technical Trajectory: Analysis for Q3-Q4 2025
Breaking New Records: Bitcoin's Path Beyond the July Peak
With Bitcoin currently trading near historical highs after reaching its all-time high of $123,218 in July 2025, we find ourselves in unprecedented territory. This comprehensive technical analysis examines Bitcoin's potential trajectory through the remainder of 2025, leveraging multiple analytical frameworks to identify probable price targets and key levels.
Current Market Context
Bitcoin has experienced a remarkable ascent in 2025, climbing from around $85,000 in January to establish a new all-time high of $123,218 in July. After this peak, we've seen a period of consolidation with price action forming a potential bull flag pattern between $117,000-$120,000. This consolidation phase represents a critical juncture for Bitcoin's next directional move.
The most recent data shows Bitcoin trading around $118,200 in late July, representing a modest pullback of approximately 4% from the all-time high. This shallow retracement suggests underlying strength rather than exhaustion in the primary trend.
RSI Analysis: Healthy Momentum Reset
Despite Bitcoin's extraordinary rise to $123,218 in July, the daily RSI has demonstrated remarkable resilience. After reaching overbought territory (70+) during the July peak, the indicator has now cooled to approximately 42-46, indicating a healthy reset of momentum conditions without surrendering the broader uptrend.
The weekly RSI reading of 46.4 is particularly significant—showing that despite the recent consolidation, Bitcoin maintains substantial momentum capacity before reaching the extreme readings (80+) that typically signal major cycle tops. This technical positioning creates an ideal scenario where momentum has reset while price structure remains intact.
Most notably, the absence of bearish divergences between price and RSI on higher timeframes suggests the current consolidation is likely a pause rather than a reversal in the primary trend.
Wyckoff Analysis: Re-accumulation Before Continuation
The price action following the $123,218 July peak displays classic characteristics of Wyckoff re-accumulation rather than distribution:
The initial decline from the peak represents a "Preliminary Support" (PS) phase
The subsequent trading range between $117,000-$120,000 shows tight price action with decreasing volatility
Volume characteristics show diminishing selling pressure rather than distribution
Recent price action suggests we're approaching the "Spring" phase that typically precedes markup
According to the data, Bitcoin's price action in late July shows decreasing volatility with narrowing price ranges, consistent with the "Cause Building" phase in Wyckoff methodology. This structure indicates institutional accumulation is still occurring at these elevated levels—a powerful sign that smart money anticipates further upside potential. The completion of this re-accumulation pattern projects a move toward the $135,000-$145,000 range in the coming months.
Supply/Demand Zone Analysis: Key Levels Identified
Supply and demand zone analysis reveals critical price levels that will influence Bitcoin's next directional move:
Major demand zone established between $115,000-$117,000 (recent consolidation floor)
Secondary support cluster at $108,000-$110,000 (previous resistance turned support)
Primary resistance at $123,200-$125,000 (all-time high region)
Limited historical supply overhead above $123,218 suggests minimal resistance once this level is breached
The formation of fresh demand zones during the recent consolidation indicates strategic accumulation before the anticipated upward expansion. The neutralization of previous supply zones during the advance to all-time highs has effectively cleared the technical pathway for Bitcoin's next significant move higher.
Volume Analysis: Confirming the Bullish Case
Examination of trading volume during the recent consolidation provides crucial validation for our bullish thesis:
Declining volume during pullbacks indicates diminishing selling pressure
Volume spikes on upward moves suggest accumulation on strength
The Volume-Weighted Average Price (VWAP) maintains a positive slope, confirming the underlying strength of the trend
The high-volume node has migrated upward in recent weeks, signalling comfort with accumulation at these unprecedented price levels—a powerful indication of market confidence in Bitcoin's valuation. The buying/selling volume differential maintains a positive bias, confirming underlying accumulation despite price consolidation.
Fibonacci Extension Framework: Projecting Targets
With Bitcoin having established a new all-time high at $123,218 in July, we can project potential targets using Fibonacci extensions from the most recent significant swing points:
The 127.2% extension from the June-July rally projects to approximately $132,000
The 161.8% extension suggests potential movement toward $145,000
The 200% extension indicates a possible target of $160,000
These projections align with psychological thresholds that could serve as natural targets in this new price discovery phase.
Elliott Wave Analysis: Extended Fifth Wave Scenario
The current price action suggests we're likely in an extended fifth wave scenario within a larger degree bull cycle:
Primary waves I through III appear complete with the move to $123,218 in July
The current consolidation represents wave IV
Wave V is projected to reach the $140,000-$160,000 range
This wave count suggests potential for continued appreciation toward the $145,000-$160,000 range before a more significant corrective phase begins. The internal structure of the current consolidation displays textbook proportional relationships, further validating our analysis.
Price Projection Timeline
August-September 2025:
Completion of the current consolidation phase with a potential final retest of support in the $115,000-$117,000 range. This would represent the "Last Point of Support" in Wyckoff terminology and provide a final opportunity for institutional accumulation before the next leg up. A decisive break above $125,000 would confirm the end of the consolidation phase.
October 2025:
Renewed momentum pushing Bitcoin toward the $132,000-$140,000 range, potentially coinciding with seasonal strength typically observed in Q4. This phase could see increased institutional participation as year-end positioning begins, with volume expansion confirming the strength of the move.
November-December 2025:
Final wave extension potentially reaching the $145,000-$160,000 range, representing a 20-30% appreciation from current all-time high levels. This phase may exhibit increased volatility and could be followed by a more substantial correction as the extended fifth wave completes.
Key Levels to Monitor
Support Zones:
Primary: $115,000-$117,000 (must hold for bullish scenario)
Secondary: $108,000-$110,000 (previous resistance turned support)
Tertiary: $100,000-$102,000 (psychological and technical support)
Resistance Zones:
Immediate: $123,200-$125,000 (all-time high region)
Target 1: $132,000-$135,000 (127.2% Fibonacci extension)
Target 2: $145,000-$150,000 (161.8% Fibonacci extension)
Target 3: $160,000+ (200% Fibonacci extension)
The Technical Case for New Highs
Despite Bitcoin already achieving unprecedented price levels in July, multiple technical frameworks suggest the potential for continued appreciation:
Historical Precedent: Previous bull cycles have shown Bitcoin capable of extending significantly beyond initial all-time highs before cycle completion
Institutional Adoption: On-chain metrics indicate continued accumulation by large holders despite elevated prices, with exchange outflows remaining positive
Technical Structure: The current consolidation pattern resembles re-accumulation rather than distribution, suggesting the market is preparing for another leg higher
Momentum Characteristics: Current momentum readings have reset from overbought conditions without breaking the underlying trend structure
Strategic Considerations
With Bitcoin having already achieved a new all-time high at $123,218 in July, strategic approaches might include:
Maintaining core positions while implementing trailing stop strategies
Adding to positions during retests of key support levels ($115,000-$117,000)
Considering partial profit-taking at key Fibonacci extension levels
Remaining vigilant for signs of distribution patterns that may emerge at higher levels
Conclusion: The Path to $160,000
The weight of technical evidence suggests Bitcoin has entered a new paradigm of price discovery following its break to all-time highs in July 2025. While the path may include periods of consolidation and volatility, the underlying trend remains firmly bullish with multiple technical frameworks projecting targets in the $145,000-$160,000 range by year-end 2025.
The current consolidation phase represents a healthy reset of momentum conditions rather than a trend reversal, creating an ideal technical foundation for Bitcoin's next major advance. With institutional adoption continuing to grow and technical indicators suggesting ample room for further appreciation, Bitcoin appears well-positioned to achieve new record highs in the coming months.
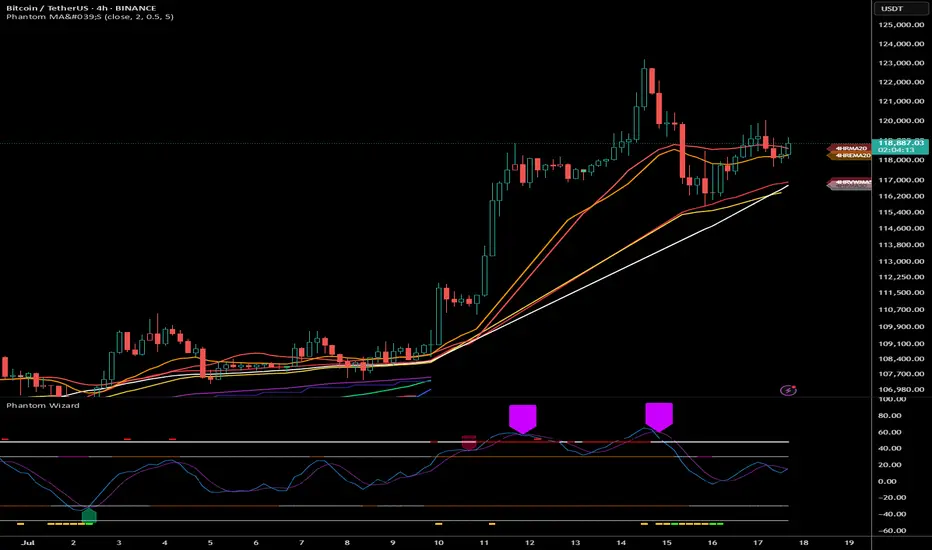
Bitcoin (BTC): Smaller Correction Means Nothing | BullishBitcoin still looks strong;we had a smaller correction recently, but buy-side volume still shows signs of dominance.
Accumulation is on, so we might have a very volatile movement very soon; be careful!
Swallow Academy
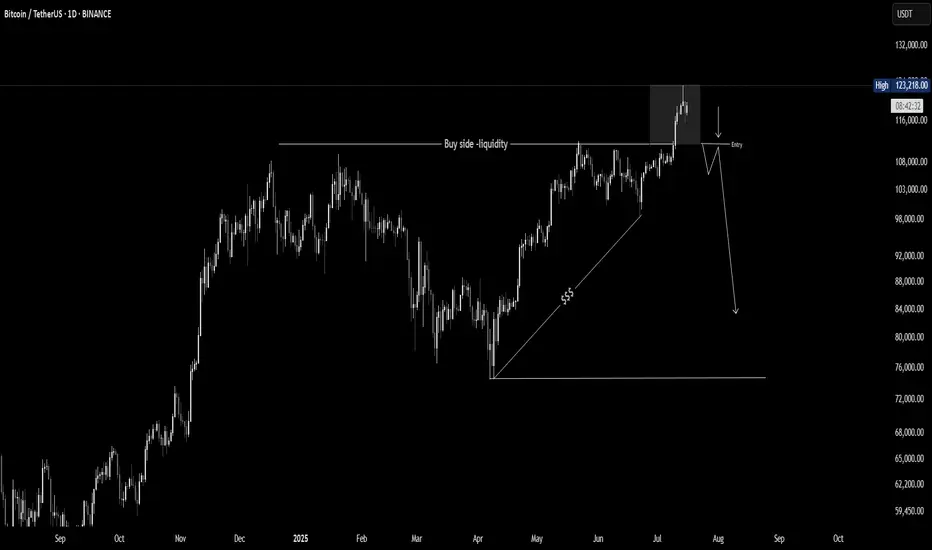
We are going downBitcoin clearly broken below this bear flag and retested lower line. Invalidation is close above 120k.

The new floor of BitcoinI calculated the new floor for low-risk entry for Bitcoin as 8700. If it falls from this ceiling, this floor can create pivot

Potential path for BTC (no free lunch)
The market gets horny as PA moves into the weekly open again.
BTC pulls an F-you move and dumps into the Daily fair value gap
THEN continuation actually happens

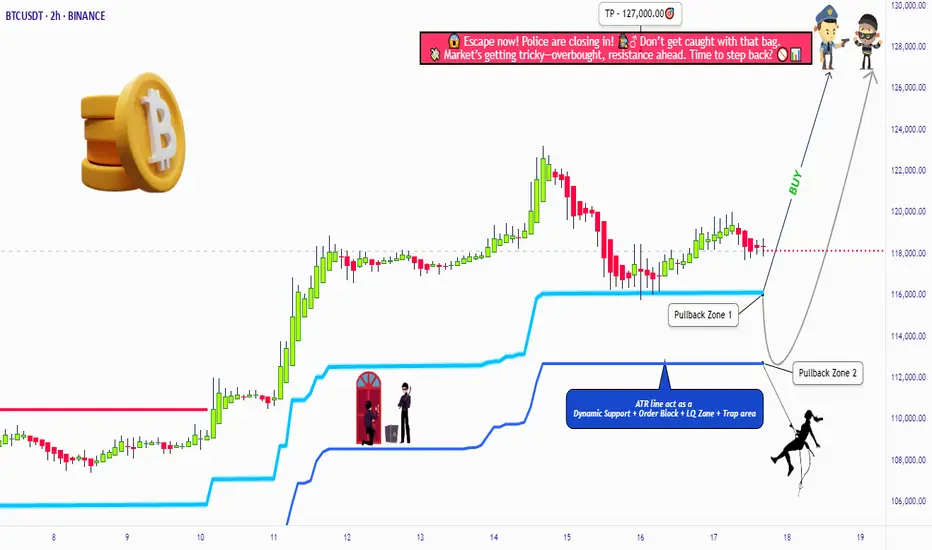
BTC/USDT Heist Mode: Buy Low, Escape Rich🏴☠️"Bitcoin vs Tether" Crypto Market Robbery Blueprint 🔥 | Thief Trading Style (Swing/Day Plan)
🌍 Hey Money Makers, Chart Hackers, and Global Robbers! 💰🤑💸
Welcome to the new Heist Plan by your favorite thief in the game — this time targeting the "Bitcoin vs Tether" Crypto Market like a smooth criminal on the charts. 🎯📊
This is not your average technical analysis — it's a strategic robbery based on Thief Trading Style™, blending deep technical + fundamental analysis, market psychology, and raw trader instincts.
💼 THE SETUP — PREPARE FOR THE ROBBERY 🎯
We're looking at a bullish operation, setting up to break into the high-value vaults near a high-risk, high-reward resistance zone — beware, it's a high-voltage trap area where pro sellers and bearish robbers set their ambush. ⚡🔌
This plan includes a layered DCA-style entry, aiming for max profit with controlled risk. Chart alarms on, mindset ready. 🧠📈🔔
🟢 ENTRY: "The Robbery Begins"
📍 Zone-1 Buy: Near 116200.00 after MA pullback
📍 Zone-2 Buy: Near 112600.00 deeper pullback
🛠️ Entry Style: Limit Orders + DCA Layering
🎯 Wait for MA crossover confirmations and price reaction zones — don’t chase, trap the market.
🔻 STOP LOSS: "Plan the Escape Route"
⛔ SL for Pullback-1: 113000.00 (2H swing low)
⛔ SL for Pullback-2: 110000.00
📌 SL placement depends on your position sizing & risk management. Control the loss; live to rob another day. 🎭💼
🎯 TARGET ZONE: “Cash Out Point”
💸 First TP: 127000.00
🏁 Let the profit ride if momentum allows. Use a trailing SL once it moves in your favor to lock in gains.
👀 Scalpers Note:
Only play the long side. If your capital is heavy, take early moves. If you’re light, swing it with the gang. Stay on the bullish train and avoid shorting traps. Use tight trailing SL.
🔎 THE STORY BEHIND THE HEIST – WHY BULLISH?
"Bitcoin vs Tether" shows bullish momentum driven by:
💹 Technical bounce off major support
🌏 Macroeconomic & geopolitical sentiment
📰 Volume + sentiment shift (risk-on)
📈 Cross-market index confirmation
🧠 Smart traders are preparing, not reacting. Stay ahead of the herd.
👉 For deeper insight, refer to:
✅ Macro Reports
✅ COT Data
✅ Intermarket Correlations
✅ CHINA-specific index outlooks
⚠️ RISK WARNING – TRADING EVENTS & VOLATILITY
🗓️ News releases can flip sentiment fast — we advise:
❌ Avoid new positions during high-impact events
🔁 Use trailing SLs to protect profit
🔔 Always manage position sizing and alerts wisely
❤️ SUPPORT THE CREW | BOOST THE PLAN
Love this analysis? Smash that Boost Button to power the team.
Join the Thief Squad and trade like legends — Steal Smart, Trade Sharp. 💥💪💰
Every day in the market is a new heist opportunity — if you have a plan. Stay tuned for more wild robbery blueprints.
📌 This is not financial advice. Trade at your own risk. Adjust based on your personal strategy and capital. Market conditions evolve fast — stay updated, stay alert.
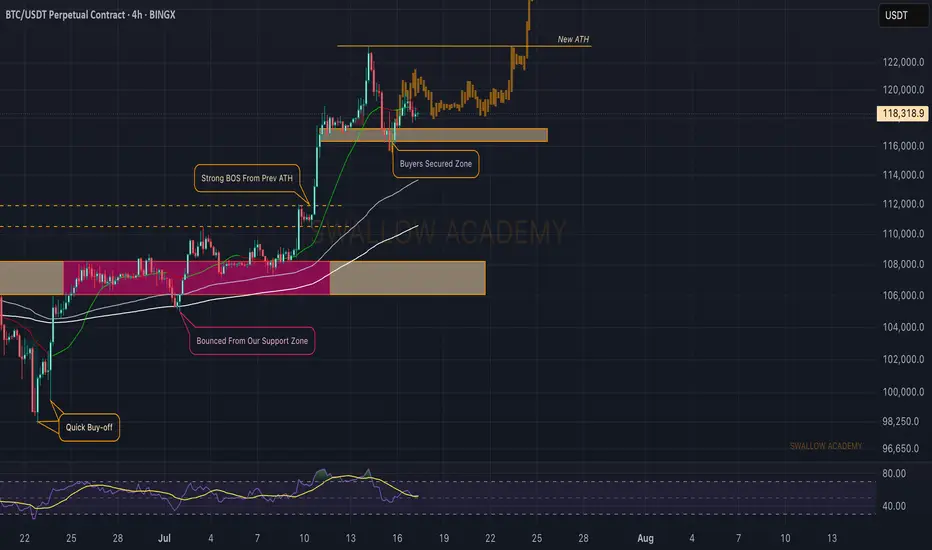
BTC Nears $120K – Pullback Risk or Breakout Launchpad?Bitcoin has rallied strongly after breaking its multi-week consolidation, now hovering just under the key psychological and historical resistance at $120K. The daily chart shows price floating above the 20EMA, with no signs of distribution—yet. However, the dense liquidity pocket between $110K–$114K remains a magnet in case of a technical pullback.
If bulls defend $118K and price cleanly breaks above $121K with strong volume, the next target lies in the $125K–$128K zone. Spot ETF inflows remain healthy, and any dovish pivot from the Fed could set off another crypto-wide bull wave.
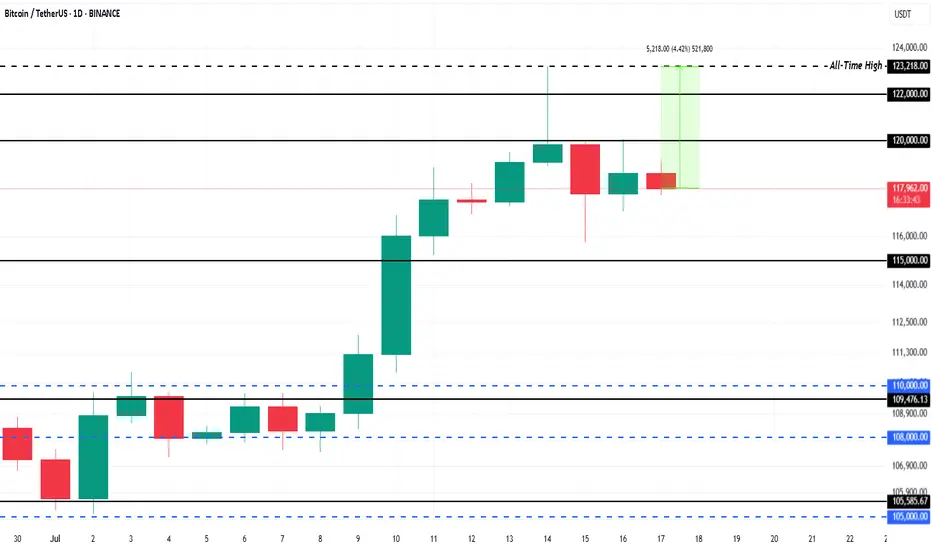
$1.5 Billion ETF Inflows Could Push Bitcoin Price 4% to New ATHBINANCE:BTCUSDT is currently trading at $118,325, facing resistance at the $120,000 level. This resistance is crucial for Bitcoin if it wants to break back to its ATH of $123,218 . The 4.4% gap to reach the ATH indicates potential for growth, but Bitcoin needs to secure support above $120,000 for this to happen.
This week, spot BINANCE:BTCUSDT exchange-traded funds (ETFs) saw over $1.5 billion in inflows , a significant portion of which occurred in the last 48 hours during Bitcoin’s dip.
The influx of institutional money highlights that investors are confident in Bitcoin’s potential despite the market cooling. If this trend persists, it could propel BINANCE:BTCUSDT price upward, as institutional support provides stability.
If BINANCE:BTCUSDT can hold above $120,000 and push past $122,000, it could continue its ascent toward new all-time highs. The current market conditions and ETF inflows support a bullish outlook, with a significant chance of breaking the resistance.
However, the risk of profit-taking remains , which could lead to a price drop. If BINANCE:BTCUSDT faces selling pressure, it could fall back to $115,000 , erasing a portion of recent gains. This would invalidate the bullish thesis, causing Bitcoin to retest lower support levels.
#BTCUSDT | Massive Breakout – Now What?Bitcoin has broken out of a multi-week descending wedge on the 4H chart — a classic bullish reversal pattern. Price is now consolidating just above $116,818 support, forming a base for the next leg up.
What Just Happened:
Clean breakout above the wedge resistance
Strong momentum candle above $111,862
Immediate rejection near $122,341
Currently retesting the previous breakout zone
Key Levels:
Resistance: $122,341
Support: $116,818 → key short-term level
Breakout Support: $111,862
Deeper Support: $105,189
Invalidation Level: $97,205
Bullish Outlook:
If BTC holds $116,818 and breaks above $122,341 with volume, the next leg could extend toward $128,000–$132,000.
Bearish Risk:
Losing $116,818 with volume → look for retest near $111,862 or even $105,189 for a stronger bounce.
Bias:
Bullish above $116,818 — watching for consolidation before continuation.
Trade Setup (if planning to enter):
Entry on retest of $116,818–$117,000
SL: Below $114,000
TP1: $122,341
TP2: $128,000
TP3: $132,000
DYOR | Not Financial Advice

Need a trading strategy to avoid FOMO
Hello, traders.
If you "Follow", you can always get new information quickly.
Have a nice day today.
-------------------------------------
1D chart is the standard chart for all time frame charts.
In other words, if you trade according to the trend of the 1D chart, you can make profits while minimizing losses.
This can also be seen from the fact that most indicators are created based on the 1D chart.
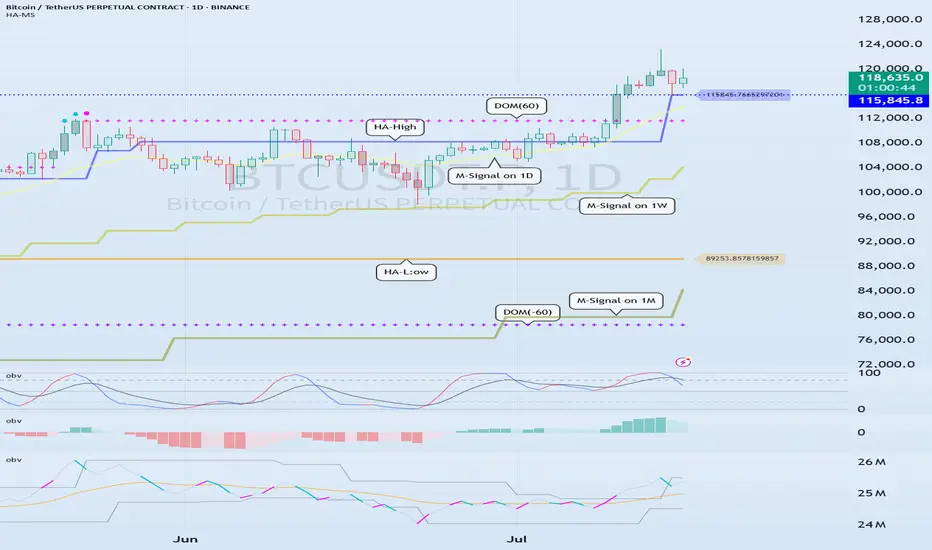
In that sense, the M-Signal indicators of the 1M, 1W, and 1D charts are suitable indicators for confirming trends.
If the price is maintained above the M-Signal indicator of the 1M chart, it is highly likely that the upward trend will continue in the medium to long term, so it is recommended to take note of this advantage especially when trading spot.
The M-Signal indicator on the 1W, 1D chart shows the medium-term and short-term trends.
The M-Signal indicator uses the MACD indicator formula, but it can be seen as a price moving average.
You can trade with just the price moving average, but it is difficult to select support and resistance points, and it is not very useful in actual trading because it cannot cope with volatility.
However, it is a useful indicator when analyzing charts or checking general trends.
Therefore, what we can know with the M-Signal indicator (price moving average) is the interrelationship between the M-Signal indicators.
You can predict the trend by checking how far apart and close the M-Signal indicators are, and then checking the direction.
-
If you have confirmed the trend with the M-Signal indicator, you need support and resistance points for actual trading.
Support and resistance points should be drawn on the 1M, 1W, and 1D charts.
The order of the roles of support and resistance points is 1M > 1W > 1D charts.
However, the strength of the role of support and resistance points can be seen depending on how long the horizontal line is.
Usually, in order to perform the role of support and resistance points, at least 3 candles or more form a horizontal line.
Therefore, caution is required when trading when the number of candles is less than 3.
The indicators created considering this point are the HA-Low and HA-High indicators.
The HA-Low and HA-High indicators are indicators created for trading on the Heikin-Ashi chart and indicate when the Heikin-Ashi candle turns upward or downward.
Therefore, the creation of the HA-Low indicator means that there is a high possibility of an upward turn.
In other words, if it is supported by the HA-Low indicator, it is a time to buy.
However, if it falls from the HA-Low indicator, there is a possibility of a stepwise decline, so you should also consider a countermeasure for this.
The fact that the HA-High indicator was created means that there is a high possibility of a downward turn.
In other words, if there is resistance from the HA-High indicator, it is a time to sell.
However, if it rises from the HA-High indicator, there is a possibility of a stepwise upward turn, so you should also consider a countermeasure for this.
This is where a dilemma arises.
What I mean is that the fact that the HA-High indicator was created means that there is a high possibility of a downward turn, so you know that there is a high possibility of a downward turn, but if it receives support and rises, you think that you can make a large profit through a stepwise upward turn, so you fall into a dilemma.
This is caused by greed that arises from falling into FOMO due to price volatility.
The actual purchase time should have been when it showed support near the HA-Low indicator, but when it showed a downward turn, it ended up suffering a large loss due to the psychology of wanting to buy, which became the trigger for leaving the investment.
Therefore, if you failed to buy at the purchase time, you should also know how to wait until the purchase time comes.
-
It seems that you can trade depending on whether the HA-Low and HA-High indicators are supported, but the task of checking whether it is supported is quite difficult and tiring.
Therefore, to complement the shortcomings of the HA-Low and HA-High indicators, the DOM(60) and DOM(-60) indicators were added.
The DOM(-60) indicator indicates the end of the low point.
Therefore, if it shows support in the DOM(-60) ~ HA-Low section, it is the purchase time.
If it falls below the DOM(-60) indicator, it means that a stepwise downtrend is likely to begin.
The DOM(60) indicator indicates the end of the high point.
Therefore, if it is supported and rises in the HA-High ~ DOM(60) section, it means that a stepwise uptrend is likely to begin.
If it is resisted and falls in the HA-High ~ DOM(60) section, it is likely that a downtrend will begin.
With this, the basic trading strategy is complete.
This is the basic trading strategy of buying when it rises in the DOM(-60) ~ HA-Low section and selling when it falls in the HA-High ~ DOM(60) section.
For this, the trading method must adopt a split trading method.
Although not necessarily, if it falls in the DOM(-60) ~ HA-Low section, it will show a sharp decline, and if it rises in the HA-High ~ DOM(60) section, it will show a sharp rise.
Due to this volatility, psychological turmoil causes people to start trading based on the price, which increases their distrust in the investment market and eventually leads them to leave the investment market.
-
When looking at the movement of the 1D chart, it can be seen that it is not possible to proceed with trading at the moment because it is already showing a stepwise upward trend.
However, since there is a SHORT position in futures trading, trading is possible at any time.
In any case, it is difficult to select a time to buy because the 1D chart shows a stepwise upward trend.
However, looking at the time frame chart below the 1D chart can help you select a time to buy.
The basic trading strategy is always the same.
Buy when it rises in the DOM(-60) ~ HA-Low section and sell when it falls in the HA-High ~ DOM(60) section.
Currently, since the 1D chart is continuing a stepwise upward trend, the main position is to eventually proceed with a long position.
Therefore, if possible, you should focus on finding the right time to buy.
However, if it falls below the HA-High indicator of the 1D chart, the possibility of a downtrend increases, so at that time, you should focus on finding the right time to sell.
In other words, since the HA-High indicator of the current 1D chart is generated at the 115845.8 point, you should think of different response methods depending on whether the price is above or below the 115845.8 point.
Therefore, when trading futures, increase the investment ratio when trading with the main position (a position that matches the trend of the 1D chart), and decrease the investment ratio when trading with the secondary position (a position that is different from the trend of the 1D chart) and respond quickly and quickly.
When trading in the spot market, you have no choice but to trade in the direction of the 1D chart trend, so you should buy and then sell in installments whenever it shows signs of turning downward to secure profits.
In other words, buy near the HA-Low indicator on the 30m chart, and if the price rises and the HA-High indicator is created, sell in installments near that area.
-
You should determine your trading strategy, trading method, and profit realization method by considering these interrelationships, and then trade mechanically accordingly.
If you trade only with fragmentary movements, you will likely end up suffering losses.
This is because you do not cut your losses.
-
Thank you for reading to the end.
I hope you have a successful trade.
--------------------------------------------------
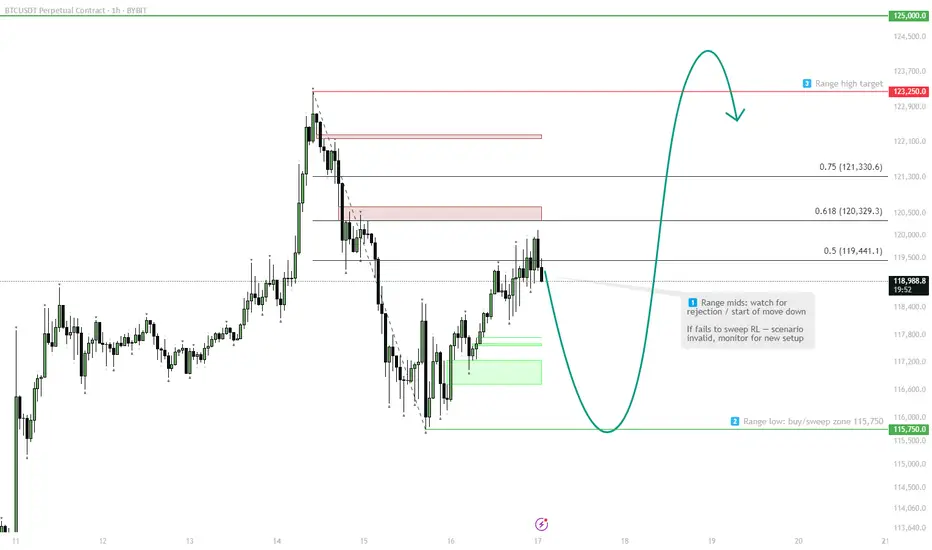
BTC — Chop → Range Low Sweep → Range High1. Watch for push to range mids (119.4–121.3)
2. Anticipate move back to range low (115,750) — buy zone
3. Target range high (125,000) after sweep
If no sweep to RL — scenario invalid
My Macro Take on BTCAfter checking BTC HTF charts, my take is that there is a resistance around $123K–$125K zone (psychological + measured move extensions). I drew a fib extension in november last year where I pointed out that 108K+ will be ATH Q1 2025 (check my TV post). It hit 110K, so pretty close. The next level was 125K, so that´s pretty close to were we are now (123K). So were are we heading now?
I might draw a new fib soon, but I see that monthly is strongly bullish. Stoch RSI is turning up from mid-range, so still has room to run. Volume hasn't spiked dramatically, so a healthy climb without blow-off. 100K looks like a resistance turned into support (also a psychological level).
Weekly is bullish with last weeks strong candle managed to breakout from that 110K level (should now be resistance level). Volume is increasing week-over-week the last weeks which confirms breakout strength. I see that if we loose 100K it could be critical (invalidation of bullish BIAS).
On daily the Stoch RSI is curling downward from overbought which might imply cooling off = short-term retrace. Price has rallied sharply and is currently pulling back slightly after tagging 123K. A pullback to 110-116K looks likely. It would be healthy and expected.

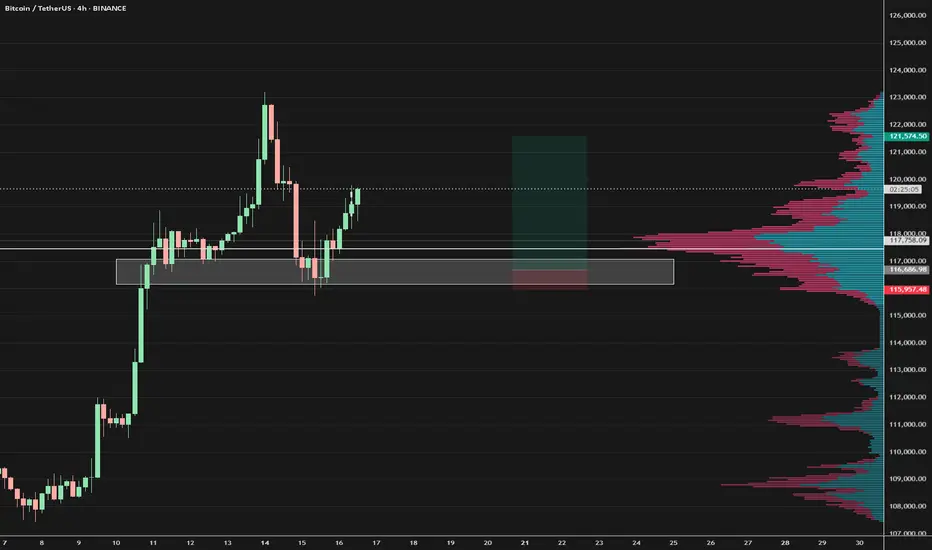
Bitcoin short from 121kLooking for shorts at these leveks.
Target aroind cme gap.
Also npoc level is down at that region.
Patiently waiting.

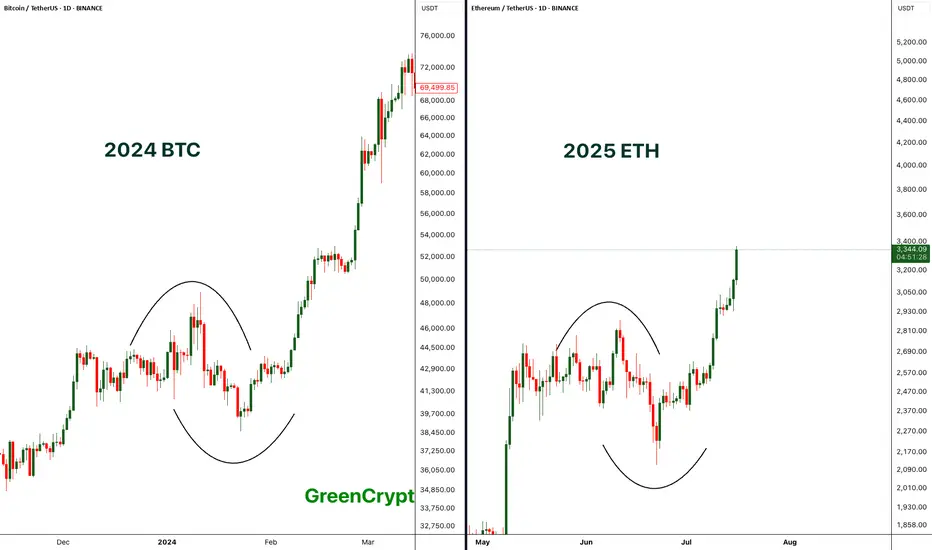
Comparing BTC 2024 with ETH 2025 - Perfect Match- If compare the chart pattern of BTC from 2024 with the current 2025 ETH pattern, wee see exactly similar chart patterns being formed here.
- Price started consolidating then it had fake breakout towards both the sides and finally the real breakout.
- BTC breakout push the price towards the new all time high above 69K, if we ETH follows similar trend then we can expect new all time high on ETH.
Let's see how it plays out.
Stay tuned for more updates.
Cheers
GreenCrypto
BTC Long London Low 07/16/25Next Monday between 2am-3am EST BTC will have retraced to 116-117k. This is where I will open a long, target 121500k-122k sl 115750.
BTC may sweep below this region before monday but I won't play a long until noted. The reason is based on the fact monday london sets the low range of the week and is the highest probable time to enter a swing trade. Price will most likley reach TP by Wednesday. Also The big confluence is the 1.1 B worth of longs placed at 116000.
Bitcoin Wave Analysis – 16 July 2025- Bitcoin reversed from a support area
- Likely to rise to resistance level 122770.00
Bitcoin cryptocurrency recently reversed up from the support area located between the key support level 115000.00 and the support trendline of the daily up channel from June.
This support area was further strengthened by the 38.2% Fibonacci correction of the sharp upward impulse from July.
Given the clear daily uptrend and the strongly bullish sentiment seen across cryptocurrency markets today, Bitcoin cryptocurrency can be expected to rise to the next resistance level 122770.00 (top of the previous impulse wave i).
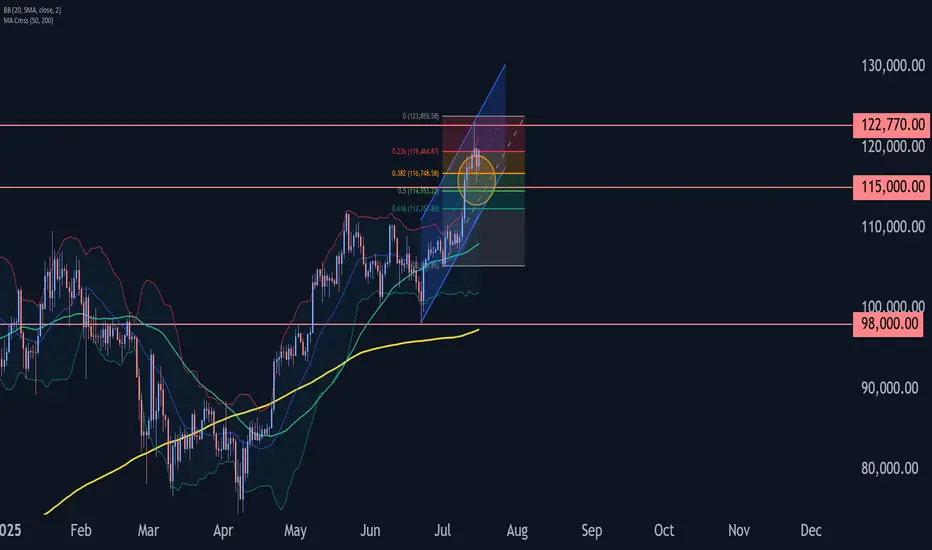
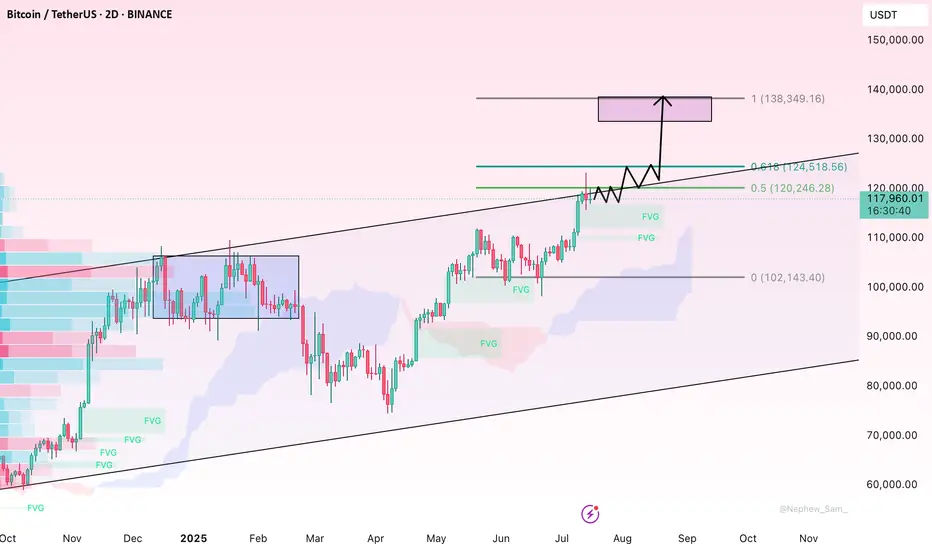
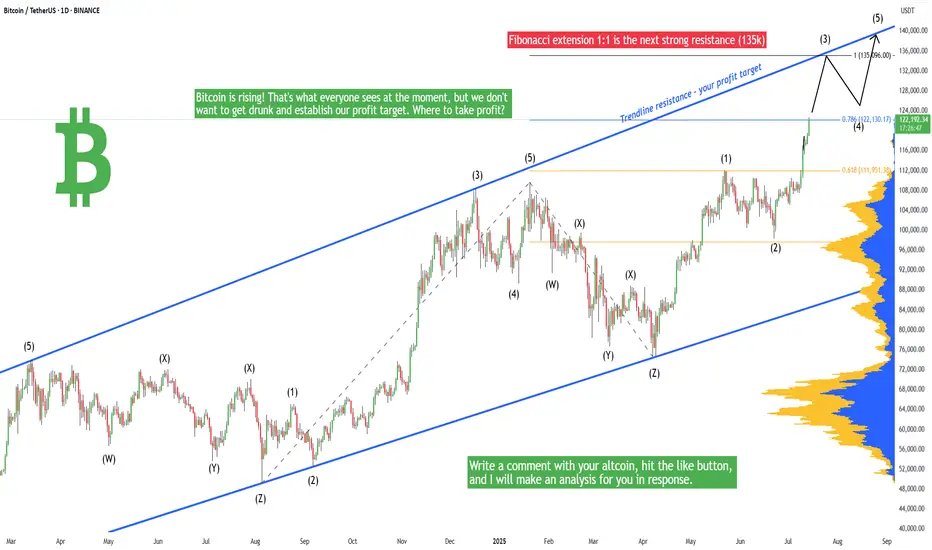
Bitcoin - Will hit 135k in the short-term, Elliott and FIBOBitcoin is rising! That's what everyone sees at the moment, but we don't want to get drunk and establish our profit target. Where to take profit? Because we are in the price discovery mode, there is no previous price action above the current price. At this moment we really cannot use any horizontal lines, gaps, volume profiles, imbalances, previous ranges, or previous swing highs to establish our profit target. So we have to use special tools, such as Fibonacci extension or Elliott Wave.
The Fibonacci extension is a great tool - in bitcoin's case we have a 1:1 FIB extension sitting at 135,096. This level is also in confluence with a major trendline that we can see on the chart. This gives us a really good profit target in the short term for this particular trade. This is also an opportunity to short Bitcoin here, if you trade futures. From the Elliott Wave perspective, we are in wave (3), so I made a prediction on where this wave should terminate and also where wave (5) should terminate. I think my analysis definitely makes sense! Please share your analysis in the comment section, only copy your link here.
Trading tip at the end: Avoid the Obvious / Market Traps - Some obvious trading situations are kind of a trap where the chances are that everyone else has also spotted a wonderful trade situation which eventually sets you up for a disaster. Many people get trapped in some obvious good looking trades. Some obvious trades can sometimes be the market traps as they are hyped, professional traders stay away from these traps. Write a comment with your altcoin + hit the like button, and I will make an analysis for you in response. Trading is not hard if you have a good coach! This is not a trade setup, as there is no stop-loss or profit target. I share my trades privately. Thank you, and I wish you successful trades!
BTC/USDT Trade Update – July 16🚨 BTC/USDT Trade Update – As Planned! 🚨
Shared this setup earlier, and it’s unfolding exactly as expected. Hope you’re all locking in solid profits! 💸
🔹 Entry: BUYER STEP‑IN zone at 116.5 K – 118 K
🔹 Confirmation: Strong bullish engulfing from demand + reclaim of 118 K
🔹 Current Price: 119 K+ and climbing
🔹 Targets Ahead: 120.7 K 🔜 122 K 📈
📌 Why it’s working:
• Demand absorption after liquidity sweep
• V‑shaped recovery forming a higher low
• Increasing momentum + follow‑through volume
🔥 Riding the wave—letting profits run!
🔔 For more real‑time setups, follow 👉 @Ali15349323
#BTC #Bitcoin #CryptoTrading #PriceAction #Profits #TradingView

#BTC Beware of the risk of a pullback📊#BTC Beware of the risk of a pullback⚠️
🧠From a structural perspective, we are continuing the trend of the long-term bullish structure in the long cycle, but there is no bullish structure as a supporting force in the short cycle, so we need to be wary of the possible risk of a pullback!
➡️At present, there is a relatively large resistance near 121,000, and the support reaction near 116,000 has been realized. The short-term support area we need to pay attention to next is 112,000-114,000
Let's take a look👀
🤜If you like my analysis, please like💖 and share💬
BITGET:BTCUSDT.P

BTC Just Broke the High - But Don't get Trapped!Bitcoin just swept the recent high, triggering breakout euphoria. But this could be a classic liquidity grab, not a true breakout. If price fails to hold above the level and shifts structure, we may see a sharp bearish reversal BINANCE:BTCUSDT BINANCE:ETHUSDT 👀
TradeCityPro | Bitcoin Daily Analysis #130👋 Welcome to TradeCity Pro!
Let’s dive into the Bitcoin analysis and key crypto indices. As usual, in this analysis, I’ll go over the futures triggers for the New York session.
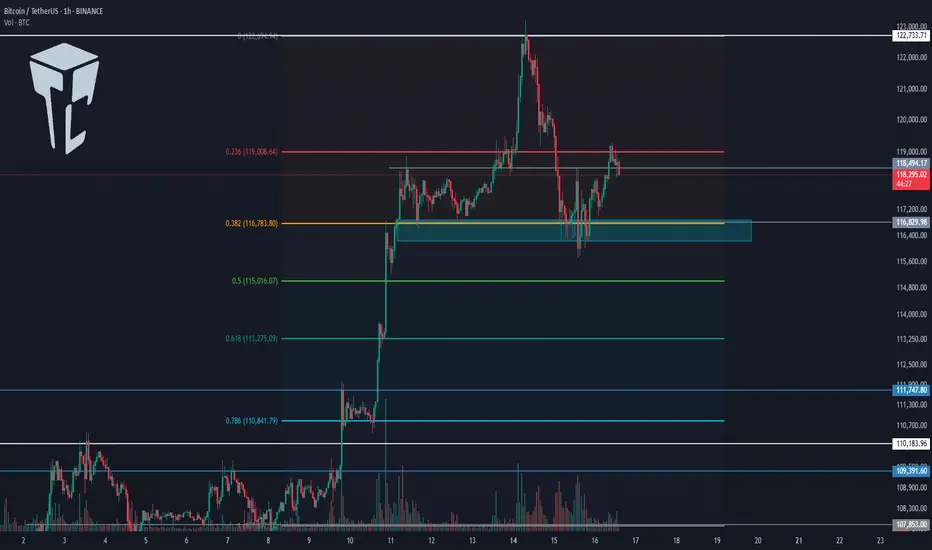
⏳ 1-hour timeframe
As you can see in the 1-hour timeframe, Bitcoin was supported at the 116829 zone yesterday and is now moving upward.
📈 The long position trigger at 118494 has been activated, and the price is currently pulling back to this level.
💥 The 0.236 Fibonacci level is right above the price, and if it breaks, the price can continue moving upward.
⚡️ The current local top is 122733, which can be the first target for the long position. Breaking this level would also be our main trigger for a long entry.
👑 BTC.D Analysis
Bitcoin dominance is still falling and has now confirmed below the 63.96 zone.
🔍 Currently, the trend is fully bearish, and breaking 63.50 will confirm continuation of the downtrend.
📅 Total2 Analysis
Total2 is rising alongside the drop in Bitcoin dominance and has confirmed above 1.33.
🎲 The next resistance is at 1.41, and the current uptrend can continue toward that level.
📅 USDT.D Analysis
Tether dominance has confirmed below 4.36 and is continuing its downward move.
✔️ The next support is at 4.22, and breaking this level would initiate the next major bearish leg.
❌ Disclaimer ❌
Trading futures is highly risky and dangerous. If you're not an expert, these triggers may not be suitable for you. You should first learn risk and capital management. You can also use the educational content from this channel.
Finally, these triggers reflect my personal opinions on price action, and the market may move completely against this analysis. So, do your own research before opening any position.
BTC buy signalBitcoin is ready to rally upward targeting the swing point that broke above the market structure, so we expect a pullback to the order block bellow the liquidity zone as our point of interest.