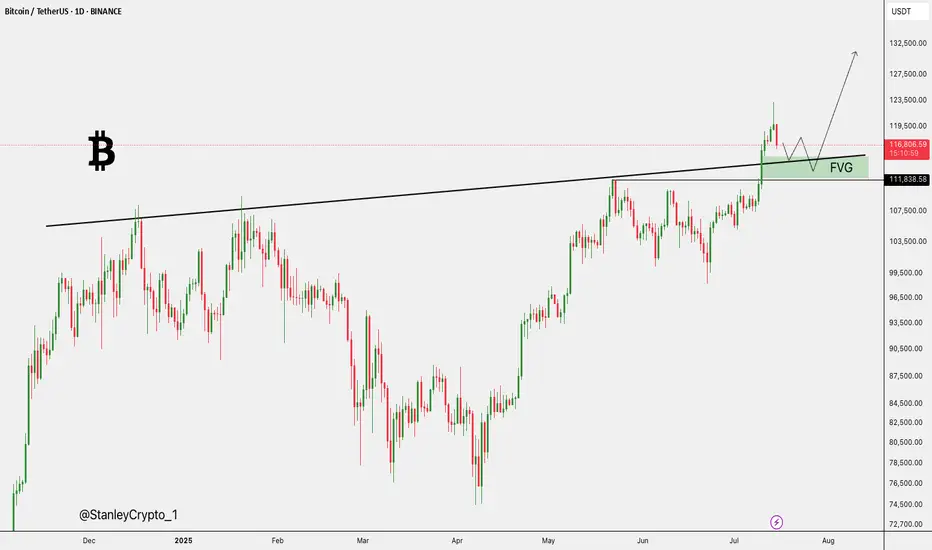
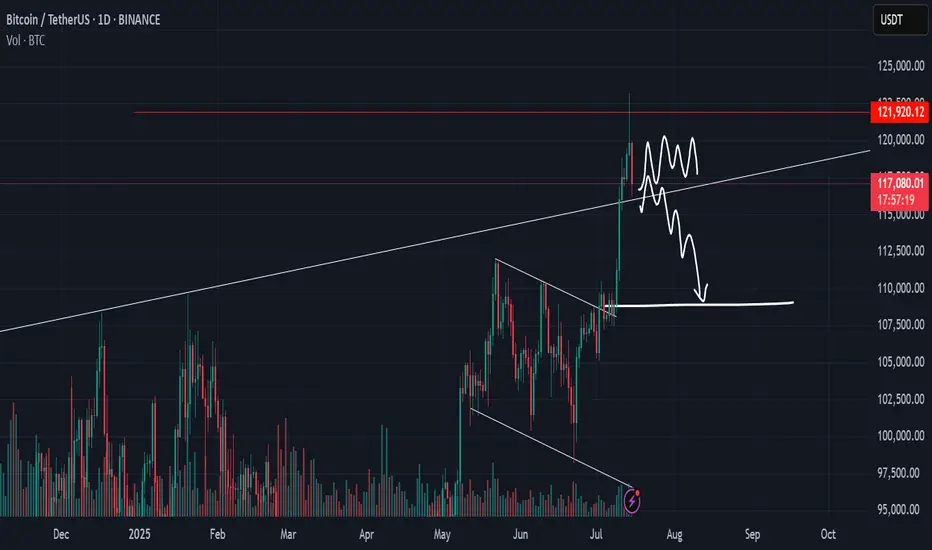
Bitcoin’s Wild Ride to New ATHs: What’s Next for Traders?Hello, TradingView warriors! 👋
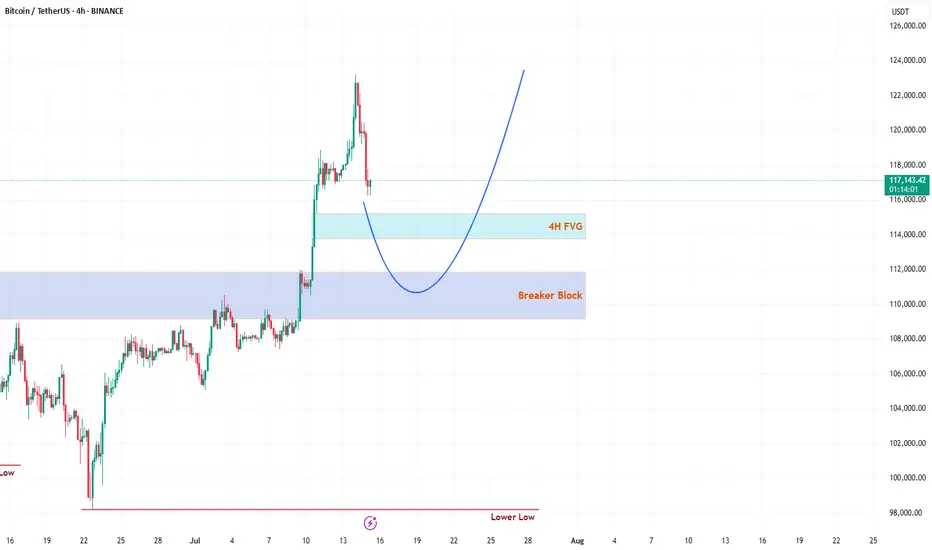
Have you caught Bitcoin (BTC) smashing through a new all-time high (ATH) this Monday? 🎉 If you blinked, you might’ve missed it! But don’t worry, the crypto king isn’t done with its rollercoaster ride just yet. After soaring to new heights, BTC has pulled back for a retracement—not a full-on reversal, so hold your horses! 🐎 Whales are playing their usual games, setting traps for unsuspecting traders. Don’t fall prey to their tricks! 🦈 Let’s break down the key levels to watch and stay one step ahead. 💡
🔍 Key Levels to Watch on the Chart
1️⃣ 4H Fair Value Gap (FVG)
This 4H FVG is a thing of beauty—my personal favorite! 😍 But let’s be real, Bitcoin doesn’t care about aesthetics. This FVG is likely to act as the first resistance level. Here’s the plan:
If respected, expect BTC to use this level as a springboard to catapult back toward the ATH. 🚀
If broken, BTC might slide toward the stronger resistance below. Keep your eyes peeled for how price reacts here! 👀
2️⃣ Daily Breaker Block (PD Array)
This is the big one—a rock-solid resistance zone on the daily timeframe. I’m leaning toward BTC dipping into this Breaker Block to clear out liquidity before making its next big move to retest the ATH. 🏦 This level is a magnet for price action, so don’t sleep on it! 😴
🛠️ Trading Strategy: Stay Sharp!
Patience is your best friend right now, traders. 🙏 Don’t rush into trades without confirmation. Watch how BTC interacts with these two levels:
4H FVG: Look for rejection or a breakout to gauge short-term direction.
Daily Breaker Block: If price dips here, it’s likely hunting liquidity before the next leg up.
Wait for clear price action before jumping in—let the market show its hand! 🃏 Stay disciplined, avoid the whale traps, and let’s ride this BTC wave together. 🌊
📚 Want More? Follow Me!
If you’re hungry for more technical analysis insights and market updates, hit that follow button! 📈 I share tips, tricks, and breakdowns to help you navigate the markets like a pro. Let’s level up your trading game together! 💪
What’s your take on BTC’s next move? Drop your thoughts below, and let’s discuss! 💬 Happy trading, and may the profits be with you! 📈
BTCUSDT trade ideas
BTC retracement comingBTC seems to follow the 2-2,5 stdv price structure. Based on simply stdv from last manipulation leg down it suggests we are now at reversal zone, and I expect price to retrace down. First reaction seems to support this plan. Aiming at $88,5K.
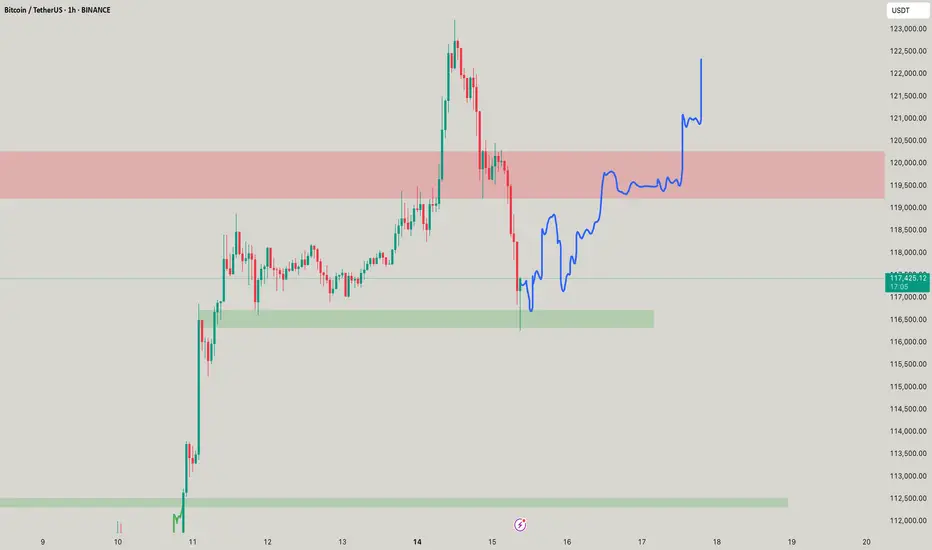
BTC still Holding the Demand Zone, Bitcoin is currently holding the demand zone between $116K and $117K, which also aligns with the retest area of a previously broken trendline—making this zone quite strong. If BTC manages to close above $117.8K on lower timeframes, we could see the beginning of a new uptrend targeting around $130K. However, if this zone fails due to any unexpected news or events, the next key support lies between $111K and $113K.
Bitcoin (BTC): Current Neckline Zone is Crucial | Bounce Coming?After a recent push to a new ATH area, the price has cooled down, which led the price back to the local neckline zone, which is our next important zone.
This correction cooled down the Bollinger Bands Channel and RSI, which would mean we are just one MSB (on smaller timeframes) away from another rally towards the upper zones.
Now if for any reason we fall more, then this might turn into a nasty movement, as our target would be then around $110K, where we would be looking for another buy entry (if we fail to get that MSB we are currently looking for).
Swallow Academy
BTC BIG SHORT!We did a mirror retest, and many other signals also point to a sharp decline, indicating numerological codes 69/96.
$BTC All Eyes on the FVG Zone. CRYPTOCAP:BTC broke out above key resistance and is now retesting the FVG zone near $112K–$115K.
Holding this level could trigger a fresh rally toward $127K–$132K.
DYRO, NFA
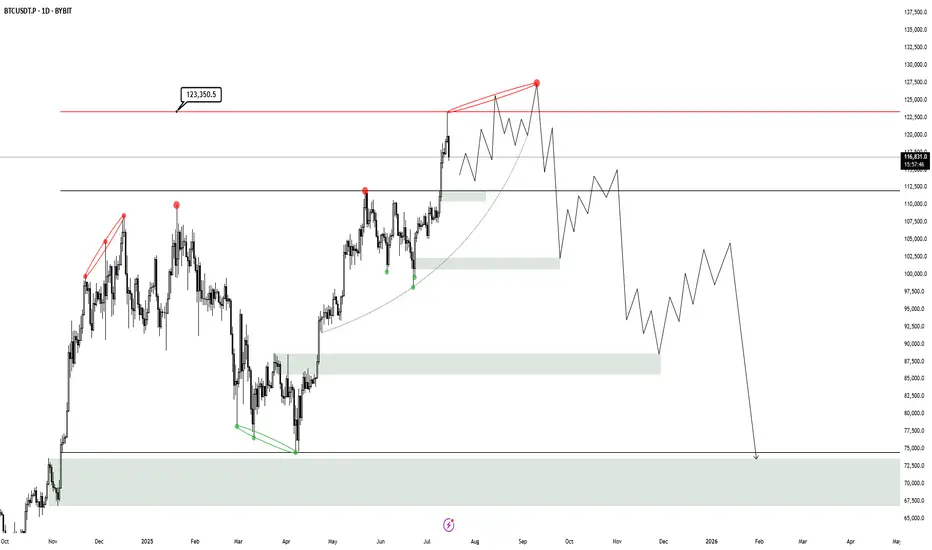
BTC HTF Distribution V3This is my new outlook for BTC if this 250 day old range is intended to be a HTF Distribution Model 1, which has neither been confirmed nor invalidated. A weekly close above 123.350$ will invalidate this model and likely lead to higher prices. Yesterday we had a perfect rejection from the deviation limit, which now probably creates a new range, that then will either reaccumulate or distribute.
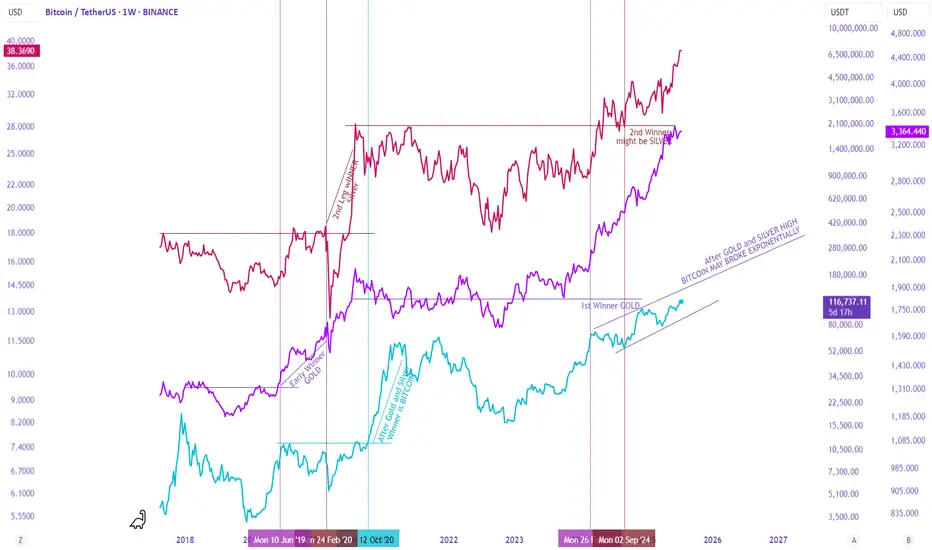
Gold, Silver, and Bitcoin – A Staggered Anti-Currency Rotation?There seems to be a complex yet recurring relationship between Gold, Silver, and Bitcoin during anti-currency phases (when fiat weakens).
First Leg – Gold Leads
Gold typically leads the first leg, breaking out to new highs. Silver follows but lags—trending up without breaking major resistance. During this phase, the Gold/Silver ratio expands.
Second Leg – Silver Takes Over
Eventually, Silver breaks resistance and becomes the second leg leader. As it outperforms Gold, the Gold/Silver ratio contracts back to mean.
Bitcoin, during this time, is usually bottoming or entering Stage 2 (early uptrend). This time, it has already broken resistance but is rising slower than in past cycles.
Third Leg – Bitcoin Dominates
As Gold and Silver peak and begin to correct, Bitcoin accelerates, often making new all-time highs (ATH).
This staggered rotation played out during the 2018–2022 cycle. Let's see if history rhymes in this cycle.
It stopped (resisted) where the AI said it would! Very Exciting!Witness the precision: Price hit resistance exactly as predicted by AI analysis. Thrilling confirmation of my AI tech-driven trading insights!

BITCOIN LONG TRADEBTC had a large flush after its ATH of 123.1k causing most late longs to get wiped out. It seems fear has been overestimated and we should see a reversal soon. We're also near major support on the 4h and have an oversold StochRSI. CPI numbers are coming out today so make sure you're managing risk accordingly and only invest what you can afford to lose.
What i see, still normalBTC has now found resistance at the mid trendline, once this flips support we look for massive uptrend
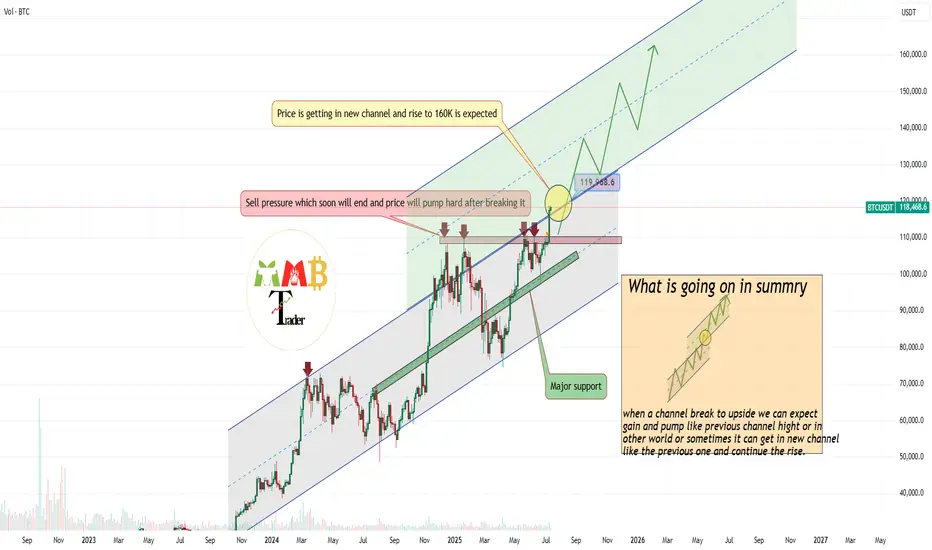
Bitcoin in New Ascending channel wait for 160K$As we can see Price broke previous ATH & channel resistance together and is holding strong, if it continue soon new channel is path to claim for Price based on chart and targets like 160K is just easy to hit.
So get Ready for new Highs and ATH here also this breakout to upside was mentioned in previous analysis and now that it is happening don't get surprise if you see notifications like Bitcoin new ATH 150K$.
DISCLAIMER: ((trade based on your own decision))
<<press like👍 if you enjoy💚
Bitcoin, its time to short full leverage ?this idea still great
now bitcoin ranging or auto dump ?
short full leverage when retesting on resisten is great
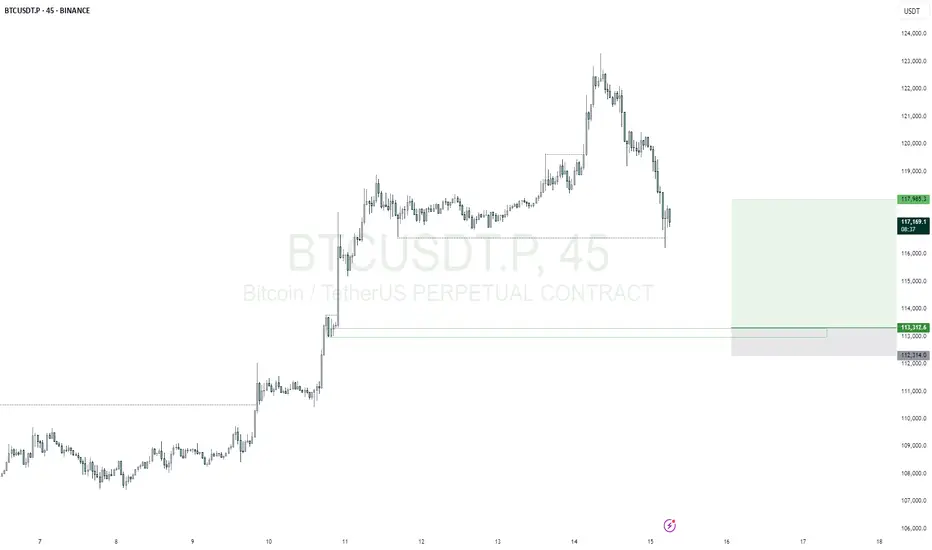
BTCUSDTmy entry on this trade idea is taken from a point of interest below an inducement (X).. I extended my stoploss area to cover for the whole swing as price can target the liquidity there before going as I anticipate.. just a trade idea, not financial advise
Entry; $113312.6
Take Profit; $117985.3
Stop Loss; $112314.0
BTCUSDT. Current scenario range Current scenario range — can shift depending on how the market reacts next.
This analysis is based on the Initiative Analysis concept (IA).
Wishing you profitable trades!

$BTC - LTF OutlookCRYPTOCAP:BTC | 1h
We're establishing a new value area here
Looking at a potential ltf setup:
If 116.5k holds as base support, targeting a move toward 120.5k–121.4k (immediate supply zone)
Similar to past price action, we might see a few pushes before breaking through ltf supply.
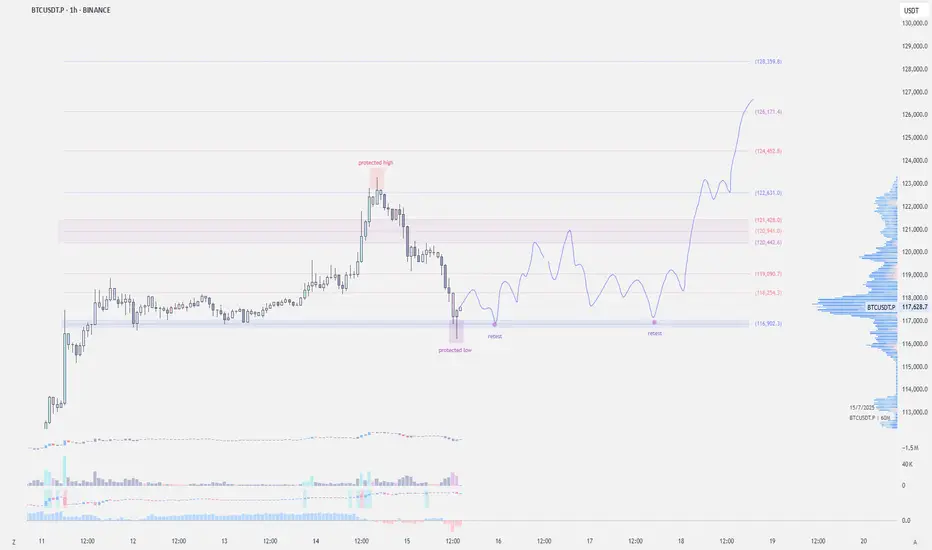
BTC - Can It go back to 123k - 124k?Yeaah IT CAN! Provided you know where it moves out, it have little imbalances at 115k as well so eye on it as well!
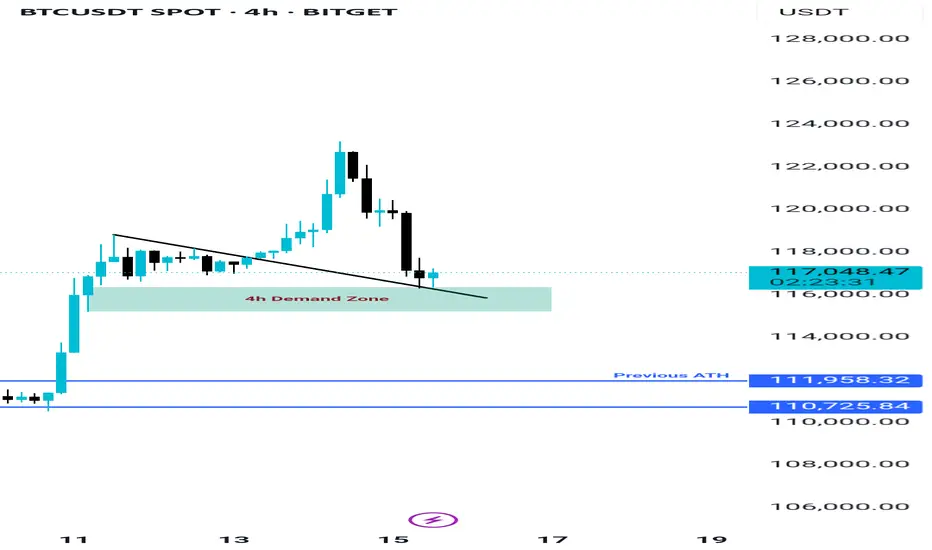
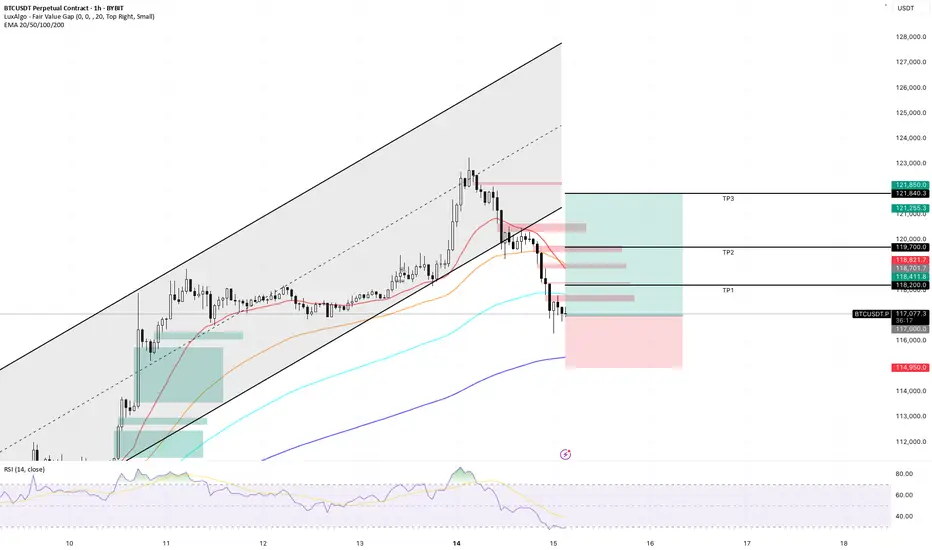
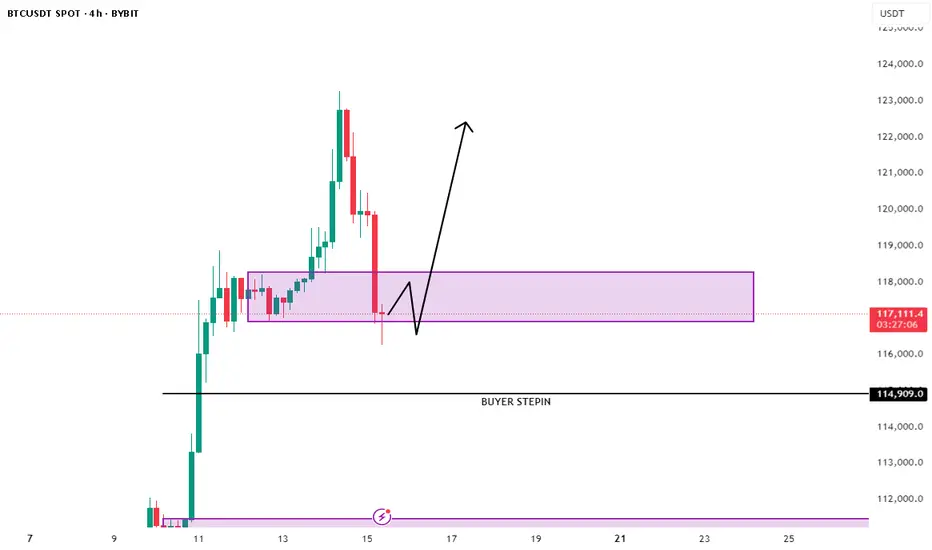
BTC/USDT Long Position Plan🔥 BTC/USDT LONG IDEA (4H CHART)
Published by: Ali15349323
Timeframe: 4H
Exchange: Bybit Spot
Date: July 15, 2025
📊 Analysis Summary:
Bitcoin is pulling back after a strong impulsive move upward. Price has now entered a key 4H demand zone between 116,200 – 117,300, which previously acted as a consolidation base before the breakout.
We are now watching for a potential long entry in this zone, with a bounce confirmation and invalidation criteria clearly defined.
📌 Trade Plan (Long Setup)
Entry Zone:
🔹 116,200 – 117,300 USDT
🔹 Price is currently reacting within this support range
Stop Loss (Invalidation):
🔹 Below 114,900 USDT
🔹 A 4H candle close below this level would break structure and invalidate the setup
Take Profit Targets:
🔹 TP1: 121,000 – Local resistance
🔹 TP2: 123,000 – 124,000 – Imbalance fill zone
🔹 TP3 (Optional): 125,500+ – If momentum continues
🧠 Reasoning Behind the Trade:
✅ Strong demand zone with historical reaction
✅ Wick rejection from the lower boundary, showing early buyer interest
✅ Price structure still bullish unless 114.9k breaks
✅ Previous sell-off likely triggered liquidation — now a chance for recovery bounce
⚠️ Invalidation Criteria:
❌ A 4H candle close below 114,900 signals demand has failed
❌ In this case, the setup is no longer valid — next demand sits around 111k – 112k
🧾 Summary:
We’re looking for a bullish continuation if BTC holds above the current demand zone. A sweep-and-reclaim structure could give confirmation. If the zone fails, no trade — we step aside and wait for deeper support.
📣 Don’t forget to:
🔁 Like & Share
🧠 Follow me @Ali15349323 on X for more trades
#BTC #Bitcoin #Crypto #LongSetup #TechnicalAnalysis #TradingView
Bitcoin Rush: The Carnival and Concerns Behind $120,000Bitcoin Rush: The Carnival and Concerns Behind $120,000
The Bitcoin market is staging an epic rally - the price has broken through the $120,000 mark, setting a new record high. But behind this jubilation, the market has shown signs of overheating.
Market Status: Risks Hidden in the Frenzy
Price Performance: Hit a new high of $123,000 on July 15, up nearly 20% this year, with a total market value of $2.2 trillion (the fifth largest asset in the world)
Market Sentiment: Fear and Greed Index 72 (extreme greed), but more than 100,000 people were liquidated in 24 hours, with a loss of $510 million
Technical Signals: RSI reached 70.9 (overbought zone), and the 30-day unrealized profit and loss ratio reached the 80% percentile
Three major rising engines
Institutional entry
Spot Bitcoin ETF net inflow of $118 million in a single day (BlackRock holds more than 700,000 coins)
MicroStra Tegy's holdings value exceeds $50 billion
Trump Media Group and other listed companies join the "coin hoarding trend"
Regulatory support
The U.S. "Cryptocurrency Week" deliberates on three key bills
Hong Kong passes the "Stablecoin Ordinance" (effective on August 1)
The EU MiCA framework begins to be implemented
Macro support
The probability of the Fed's September rate cut is 72.3%
The weakening of the U.S. dollar + trade protection policies boost risk aversion demand
Bitcoin's positioning shifts from "speculative assets" to "digital gold"
Key technical signals
Breakthrough pattern: daily "three white soldiers" candle + ascending triangle breakthrough, target 128,000-132,000 U.S. dollars Yuan
Key position:
Support: $116,800 (near term), $112,000 (key)
Resistance: $121,500 (short term), $140,000 (long term)
Risk signal: H4 chart RSI reaches 77, MACD histogram shrinks
Future outlook
Short term: If the $112,000 support is maintained, it is expected to challenge $140,000
Risk: Falling below $108,500 may trigger a chain of liquidations
Cycle law: Referring to "peaking 550 days after halving", this round of bull market may peak in October
Breakout trading strategy (suitable for aggressive traders )
Entry conditions:
Price stabilizes above $123,000 with increased trading volume (at least 1.5 times the 20-day average volume)
4-hour chart closes above the previous high for three consecutive positive lines
Targets:
First target $128,000 (1.618 Fibonacci extension level)
Second target $135,000 (psychological barrier + upper channel track)
Stop loss setting:
Day trading: Falling below the $120,000 round mark
Swing trading: Falling below the $116,800 support platform
Conclusion: Bitcoin is writing a new chapter in history, but investors need to be wary of "extreme joy leads to sorrow". Remember: when others are fearful, I am greedy, and when others are greedy, I am fearful - this old saying always applies to the crypto market.