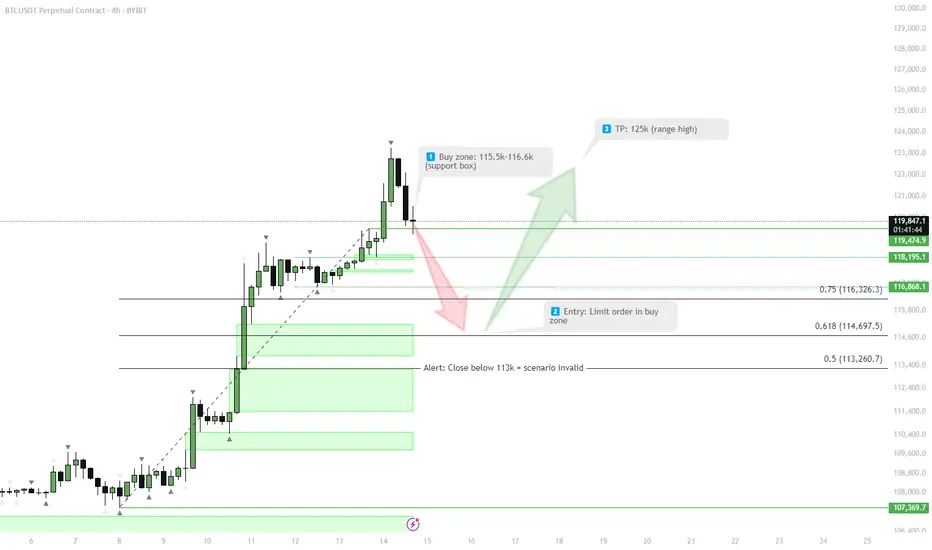
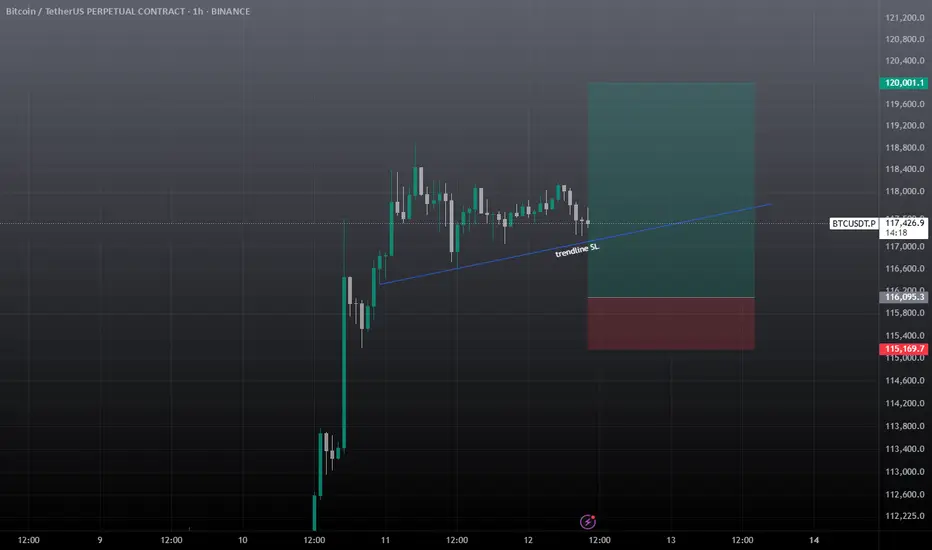
BTC — Long from Support Box (#4h) | BULLISH1. Buy: Limit order 115.5k–116.6k
2. Alert: If close < 113k, scenario invalid
3. Target: 125k
BTCUSDT trade ideas
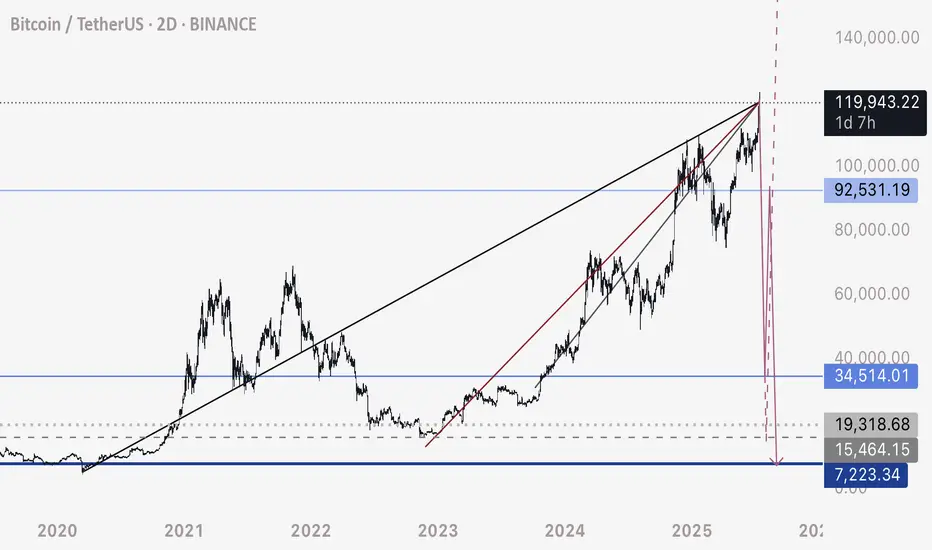
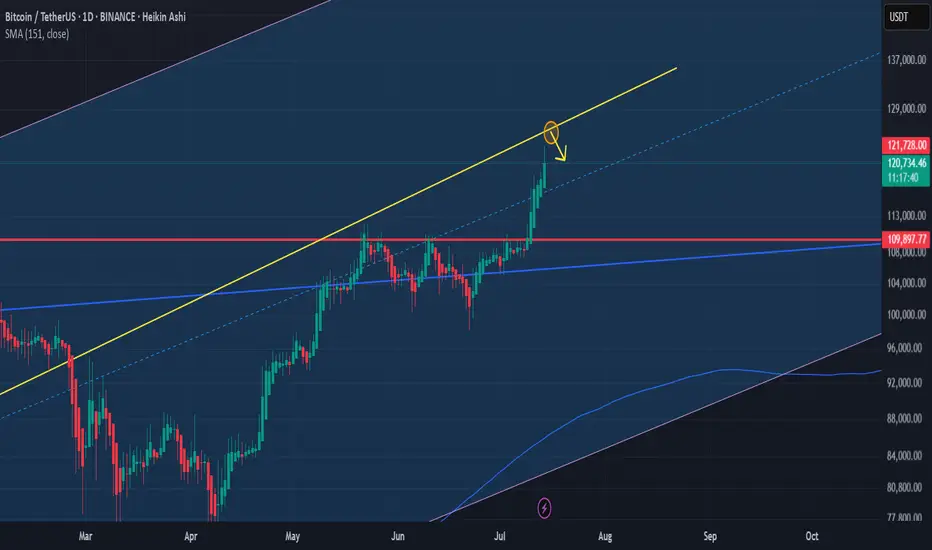
BTC - Last Attempt at Predicting TopThis is my last attempt at predicting the top of this upwards move on the HTF.
Adjusting these trendlines to where BTC pumped to, which was a lot higher than initially anticipated, it does look to me that these trendlines are still respected.
There are 3 bearish ascending lines that price has been interacting with - I assume we are looking at a crossing intersection of them, per the chart here.
If BTC continues higher without a very fast, drastic free fall - I will be looking at other possibilities. If price moves above 122,000 again, I would consider this invalid - as I suspect the resistance level sits around 120,000 to 120,500 area.
I will be looking for a very fast drop to consider this possibility as valid and likely from here on.
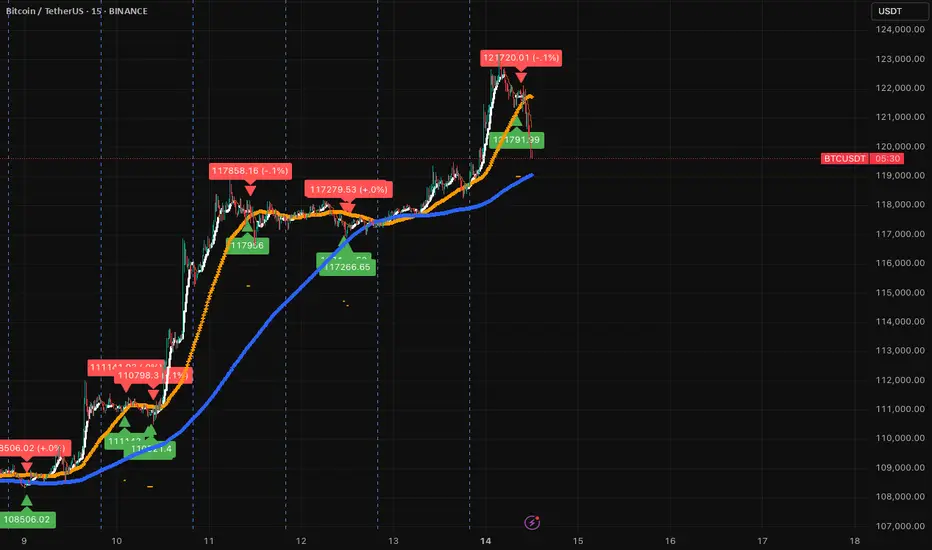
BTC-----Buy around 121100, target 121800 areaTechnical analysis of BTC contract on July 14:
Today, the large-cycle daily level closed with a small positive line yesterday, the K-line pattern continued to rise, the price was above the moving average, and the attached indicator was running in a golden cross. The overall trend is still very obvious, and it can be seen from the overall trend that the retracement is very small. After the shock correction in the two trading days over the weekend, it rose strongly again during the day and broke through the previous high position, so we keep the main idea of buying on retracement in trading; the short-cycle hourly chart intraday price broke upward, the starting point was 118880 area, the current price is consolidating at a high level, the K-line pattern continued to rise, and the attached indicator was running in a golden cross. If we look at the continuation of the high closing today, two conditions must be met: the European market price broke through the intraday high; the retracement cannot break the starting point, otherwise it will be difficult to fall.
Today's BTC short-term contract trading strategy:
Trade in the 121100 area when retracement, stop loss in the 120500 area, and the target is the 121800 area;

Analysis of the Latest Bitcoin Market。On July 14, Bitcoin's price surged sharply, with the highest level reaching $123,100. This breakthrough ended its eight-month-long consolidation phase within the $90,000 - $110,000 range.
The U.S. House of Representatives designated the week of July 14 as "Crypto Week" and plans to deliberate on a number of key bills. Among them, the Guiding and Establishing America's Stablecoin National Innovation Act aims to formulate federal regulations for stablecoins and is regarded as a "landmark legislation" in the cryptocurrency sector. The market expects the cryptocurrency industry to usher in policy dividends.
Market analysts are relatively optimistic about Bitcoin's prospects. The $125,000 level is seen as the next key psychological threshold, and a breakthrough above it would open up greater upside potential. Standard Chartered Bank predicts that Bitcoin will challenge $200,000 by the end of the year. Although the Relative Strength Index (RSI) is at a high level, there is no obvious overbought signal. The moving average system is clearly aligned, and the support level has moved up to $112,000. The market consensus holds that "any pullback represents a buying opportunity."
you are currently struggling with losses,or are unsure which of the numerous trading strategies to follow,You have the option to join our VIP program. I will assist you and provide you with accurate trading signals, enabling you to navigate the financial markets with greater confidence and potentially achieve optimal trading results.

How many bag holders will BTC leave behind?We've had our fun and some fake pumping from the short squeeze. No comes the real stuff! What are the fundamentals and what problem is BTC trying to solve? Ok, crickets. It's a speculative asset, that's it. If history repeats itself, which it typically does, we will see a major pull back and anyone who's bought at the top will have a negative performing portfolio. It's too expensive and you still can't buy a banana with BTC and there are plenty of middlemen involved, which goes 100% against it's original purpose (after the financial crisis).
If you're up, this would be a good time to sell IMHO and buy at the next support level, which is way below 100k.
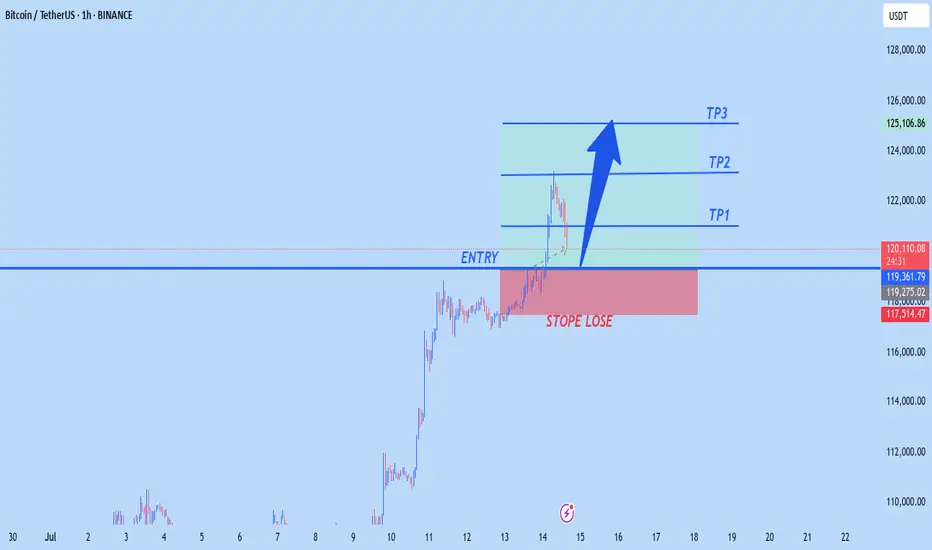
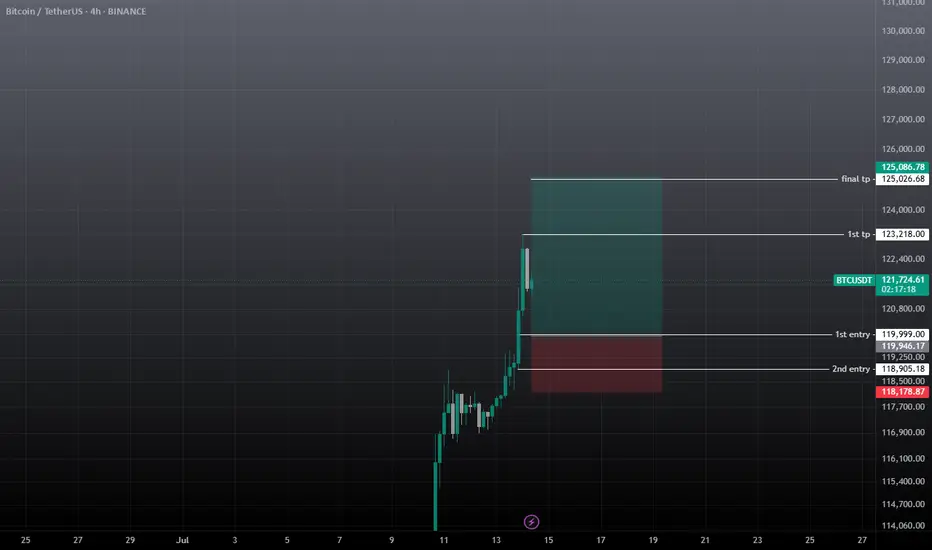
BTCUSD NEW OUTLOOKBtc buy from 119,000
TP1 122,000
Tp2 123,000
Tp3 125,000
STOPE LOSE 117,500
Trade at your own risk
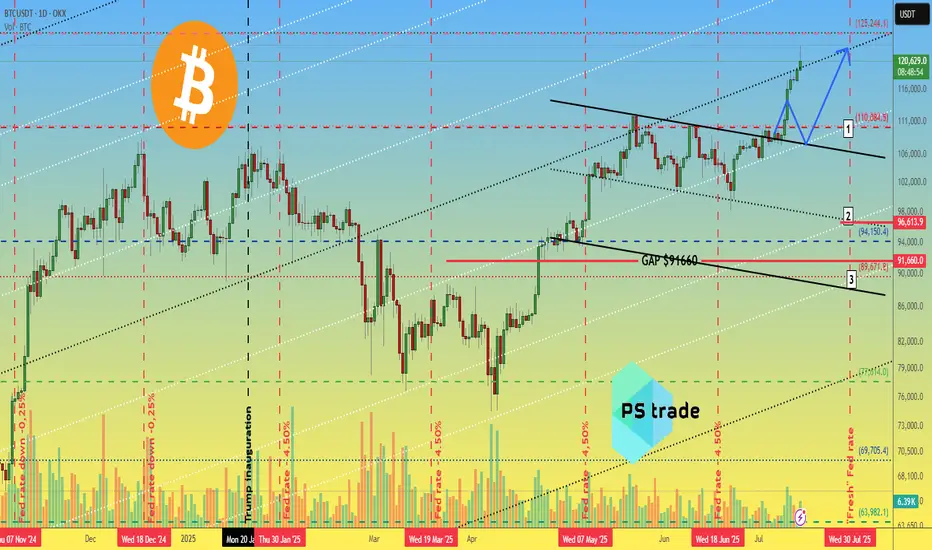
Bitcoin BTC price analysis📈 Two weeks have passed since the previous analysis of the OKX:BTCUSDT chart, and the market has decided to go with the 1️⃣ scenario.
Less than 3% remains to reach $125,000, and the price could easily get there by inertia, but that's a minor detail.
CRYPTOCAP:BTC is updating its ATH, and total liquidations on the crypto market over the past 24 hours are “only” $750 million, of which almost $450 million is accounted for by #Bitcoin.
Weak, very weak... Previously, longs were liquidated for $2+ billion, and it was reported that the actual amount of liquidations was significantly higher due to the fact that the exchanges' data was not fully disclosed. (For the sake of objectivity, at that time, the lion's share of liquidations was accounted for by altcoins, but now this is not the case).
◆ During this time, Trump introduced new tariffs — the market was “on a roll” — it swallowed it and didn't even notice the news.
◆ Tomorrow, July 15, the US CPI will be announced — the forecast is for inflation to rise from 2.4% to 2.6% (although there are rumors that the situation in the US economy is much worse and this may "come to light" tomorrow).
◆ July 16 - PII announcement - these indicators may act as a “cold shower” to bring the market out of its euphoria.
◆ From July 14 to July 18, the US Congress is considering three key crypto laws, including the GENIUS Act. Major players consider this a powerful driver. Perhaps the current growth has already “played out” and priced in expectations for news.
🪐 And this trading week will end on 18.07 with the start of Mercury retrograde, even the US Congress is postponing all important matters, and you still don't believe in it ))
🖐 Long positions are certainly beneficial, appropriate, and in line with the trend at present, but it is advisable to hedge them with stops, because as mentioned above: the price is rising, and there are few liquidations. During the previous decline in the cryptocurrency market, there were significantly more liquidations of long positions, and they may wish to repeat this.
And with the #BTCUSD price correction, there will be a fixation: some will have profits, and some will have losses in stablecoins, which would then be logical to reinvest as capital in altcoins. First in something more voluminous and less risky, and in the last stage, they will pump everything in a row)
But until then, we still need to survive and preserve our deposits.
So, in your opinion: correction to one of the levels:
1️⃣-$110k 2️⃣-$97k 3️⃣-$90k
or
is everything written above complete nonsense, and the market growth has only just begun to “take off”?
Bitcoin Go 130k Now you just have to take a long position and the whole market will be pumped.
Bitcoin 130k __134k
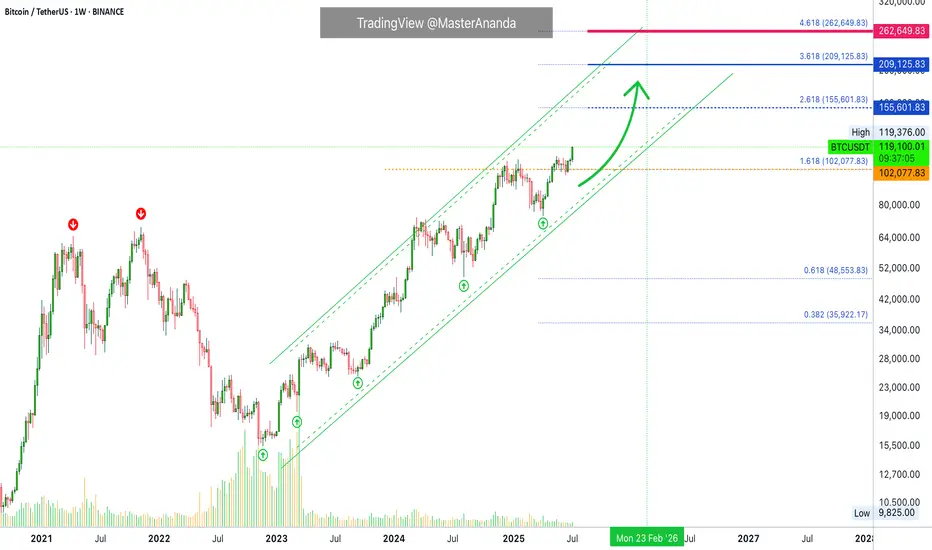
$BTC RISING WEDGE ~ {LONG TERM VIEW}I don't feel like writing, everything is clear. Bitcoin is bullish right now, but keep an eye on this pattern.

Top Altcoins Choice —Your Pick · Bitcoin Hits New All-Time HighBitcoin is once again trading at a new all-time high and as this happens the altcoins go boom.
The first instance circled around the fact that Bitcoin was strong and range trading between $100,000 and $110,000. When Bitcoin goes sideways within a bull market, the altcoins tend to blow up, and blow up they need. Now, when Bitcoin moves to hit a new all-time high and keeps growing; the 2025 Cryptocurrency bull market is fully confirmed.
» Which one is your favorite altcoin trading pair?
» Which project you think will grow the most in 2025 & 2026?
» What is your TOP ALTCOIN CHOICE?
Top Altcoins Choice —Your Pick
Leave a comment with some of your favorite altcoins pairs, the ones you like most and I will do a full analysis for you. I will publish in my profile and also answer directly in the comments section. I will pick and choose.
If you see other commentators that have a pair that you like, make sure to boost their comment and reply. The more boosts a comments gets, higher priority will be given to the project and trading pair.
Boost this publication and leave a comment, let's get started with your TOP ALTCOINS CHOICE!
Namaste.
14/07/25 Weekly OutlookLast weeks high: $119,494.32
Last weeks low: $107,467.52
Midpoint: $113,480.92
NEW BTC ATH!
This is what we've all been waiting for, BTC breaks through resistance at $110,000-112,000 to set a the highest weekly close ever ($119,086). Thanks to a further $2.27B net inflows via BTC ETFs, the passing of the "big beautiful bill" flipping from a more deficit reduction stance by the US to an environment perfectly suited to risk on assets. Things are looking good for Bitcoin.
This week already in the Asia session BTC has broken above the weekly high to hit $123,100. Despite this incredible rally BTC.D has been falling since Thursday of last week. To me this signals altcoins have started to play catch up and we've seen that with ETH breaking $3000 (+14% relative to BTC).
I would like to see BTC consolidating here above the weekly high while altcoin majors break their choppy rangebound environments and shift to a trending environment just as BTC had last week.
There are also major data releases this week:
Tuesday CPI
Wednesday PPI
Thursday Euro CPI
Thursday US Initial Jobless Claims
I do not expect these data releases to have a major effect on the markets in their current state due to the risk appetite we've seen in both crypto and equities, such shallow pullbacks prove the demand is there to absorb and sell-side pressure for now.
Now is an excellent time to back strong projects with great fundamentals that are breaking out from downtrends/ranges in both their USD & BTC pairs, as BTC.D drops alts can print some great returns. Beta plays of ETH & SOL can offer higher returns than the majors themselves in these market conditions too.
Good luck this week everybody!

Weekly trading plan for BitcoinBINANCE:BTCUSDT has currently set a new ATH, trading in the 121k-122k range. While no clear reversal signals are present yet, we're seeing early signs of a 4h RSI divergence. Without solid confirmation, short positions remain risky - price could liquidate shorts multiple times before any meaningful reversal. Key local level to watch is 119k
Trade safe and stay adaptive

BTC BUY / LONG SCALP TRADEWait for the entry to be filled, must use SL and don't use high margin on any trade. If TPs achieved first then ignore the trade.
btcusdt buy / long scalp setupWait for the entry and must use sl on all trades, if tp achieves first then ignore it.
TradeCityPro | Bitcoin Daily Analysis #128👋 Welcome to TradeCity Pro!
Let’s get into the analysis of Bitcoin and key crypto indexes. As usual, I’ll be reviewing the futures triggers for the New York session.
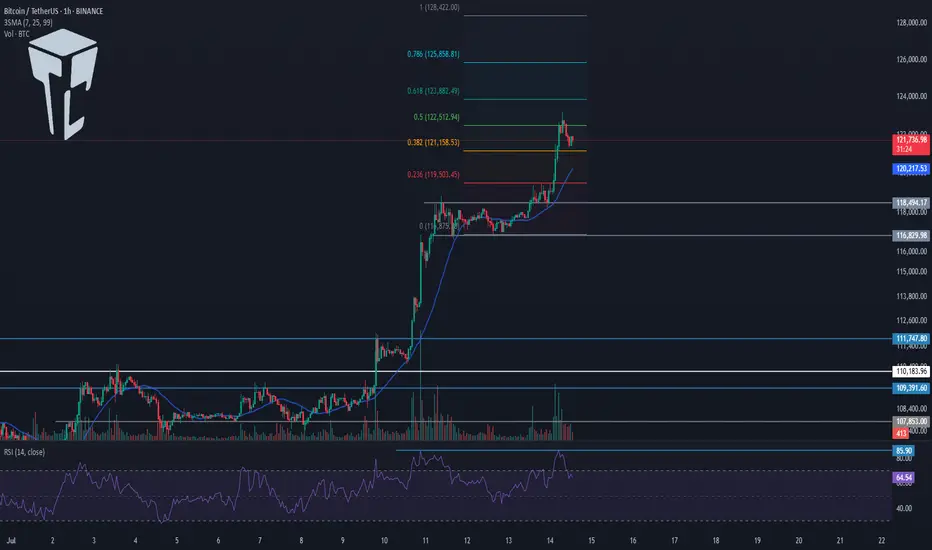
⏳ 1-Hour timeframe
In the 1-Hour timeframe, as you can see, Bitcoin broke the 118494 top yesterday and is now moving upward.
✔️ According to the Fibonacci Extension zones, the price has moved up to the 0.5 Fibonacci level and has been rejected from there, printing a few red candles for now.
📊 The buying volume in this bullish leg was very high, and as you can see, volume was in convergence with the trend. Now that the corrective phase has started, the volume is also decreasing, and still remains in convergence with the uptrend.
🔔 From a momentum perspective, we’ve reached a market top because RSI has reached the ceiling it previously formed at the 85.90 level, reacted to it, and has now dropped back below the 70 zone.
💥 If the 85.90 zone on RSI is broken, we’ll likely see a very sharp and explosive bullish leg from Bitcoin. In that case, the next targets would be the 0.786 and 1 Fibonacci levels.
🔑 For opening a position now, we can enter on the break of 122512, and we could also use the price’s pullback to the SMA25 as an entry. For now, our triggers aren’t highly reliable, so positions should be based more on market momentum.
👑 BTC.D Analysis
Let’s move to Bitcoin Dominance. The dominance range box between the 64.44 and 64.82 is still ongoing, and dominance hasn’t broken out of this box yet.
⚡️ If the box breaks downward, a large amount of capital will flow into altcoins, and we could see major pumps in altcoins.
📅 Total2 Analysis
Moving on to Total2. Yesterday, the 1.3 top was broken and the price moved up toward 1.33 and has now reached that area.
I✨ f that resistance breaks, the next target will be 1.41. If a correction happens, 1.3 and 1.26 are the lower support zones.
📅 USDT.D Analysis
Now to Tether Dominance. A new bearish wave started yesterday and has continued down to 4.22.
🎲 If this zone breaks, the bearish leg can continue down to 4.08.
❌ Disclaimer ❌
Trading futures is highly risky and dangerous. If you're not an expert, these triggers may not be suitable for you. You should first learn risk and capital management. You can also use the educational content from this channel.
Finally, these triggers reflect my personal opinions on price action, and the market may move completely against this analysis. So, do your own research before opening any position.
Long Target UpdateSince there was more info in the price action, I updated my last view of it. I expect a 5th wave extension and a deep pullback. Be careful if we reach +130k and hold the sl tight and observe if any structure for changing trend is forming.
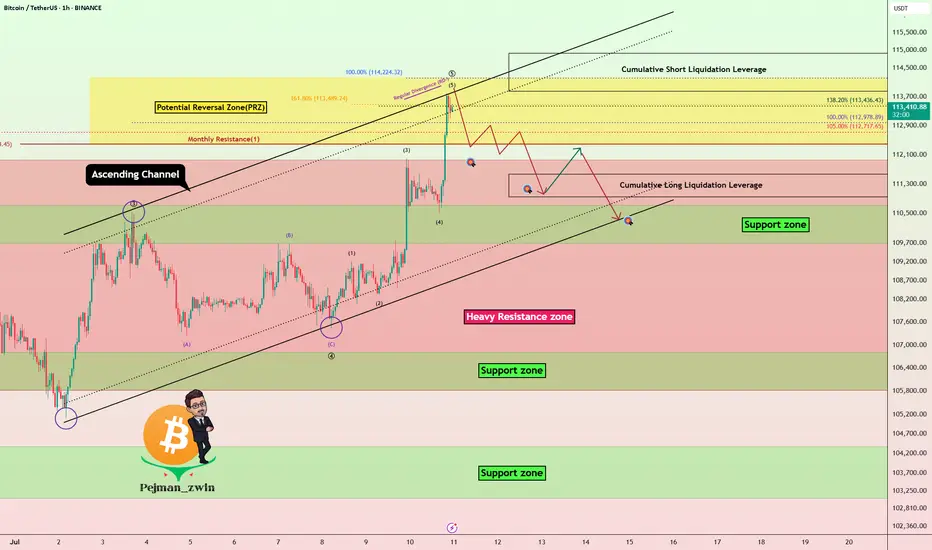
Bitcoin Hits New ATH – Is It Time to Short?Bitcoin ( BINANCE:BTCUSDT ) managed to form a new All-Time High(ATH) in the previous one-hour candles .
Do you think Bitcoin can create a new ATH in the coming hours?
Bitcoin is currently trying to break the Heavy Resistance zone($110,720-$105,820) . It has also penetrated the Potential Reversal Zone(PRZ) and Cumulative Short Liquidation Leverage($114,910-$113,850) .
In terms of Elliott wave theory , it seems that the 5 impulsive waves that Bitcoin started in the last 3 days can be completed above the ascending channel and PRZ .
Also, we can see the Regular Divergence(RD-) between Consecutive Peaks.
I expect Bitcoin to drop to at least Cumulative Long Liquidation Leverage($111,563-$110,947) . At least the price zone Bitcoin is in at the time of publishing this analysis is better for short positions , even if the Stop Loss(SL) is touched .
Note: Stop Loss(SL)= $115,023
Please respect each other's ideas and express them politely if you agree or disagree.
Bitcoin Analyze (BTCUSDT), 1-hour time frame.
Be sure to follow the updated ideas.
Do not forget to put a Stop loss for your positions (For every position you want to open).
Please follow your strategy and updates; this is just my Idea, and I will gladly see your ideas in this post.
Please do not forget the ✅' like '✅ button 🙏😊 & Share it with your friends; thanks, and Trade safe.
Don't take a short position BTCUSDT"Don't take a short position, but be prepared for a temporary drop before the market goes back to ranging. Right now, we're in one of the most exciting moments in the BTC market. "
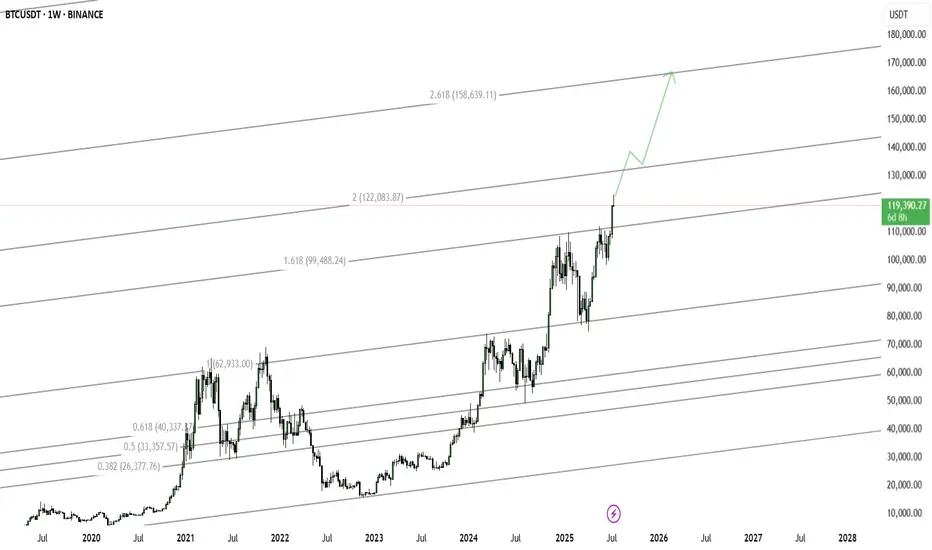
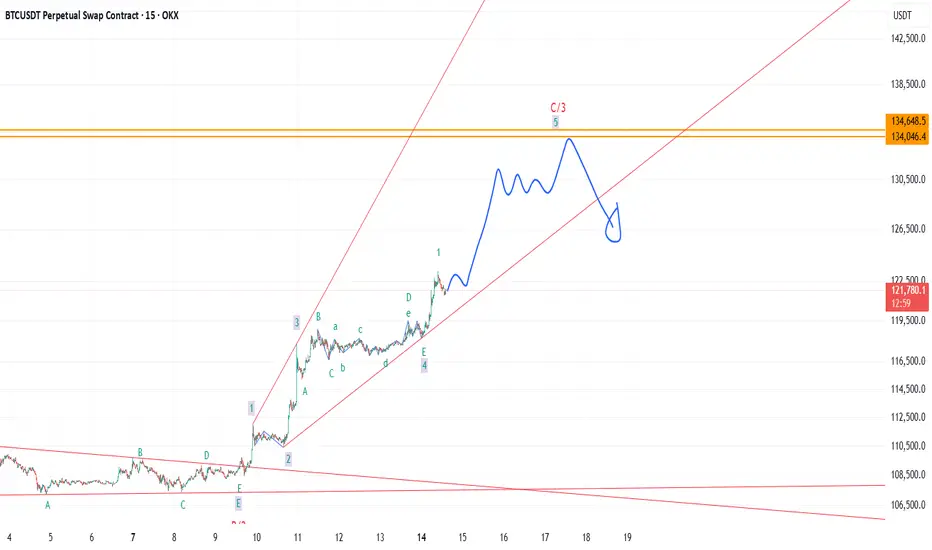
Can Bitcoin reach new highs?Bitcoin reached around 121722, close to the expected target of 130,000. There are two current expectations:
1. Black line: 5-wave rising structure, currently in the 3rd wave rising, and there will be a 5th wave rising after the correction.
2. Purple line: abc rising structure, currently in the last wave c rising, will end the rise ahead of time.
The rise is not yet complete. If it falls below the lower track of the channel, the rise will end.

BTC/USDT bullish with reverse head and shoulderBTC/USDT completed the reverse head and shoulder pattern.
It could be bullish by the pattern.

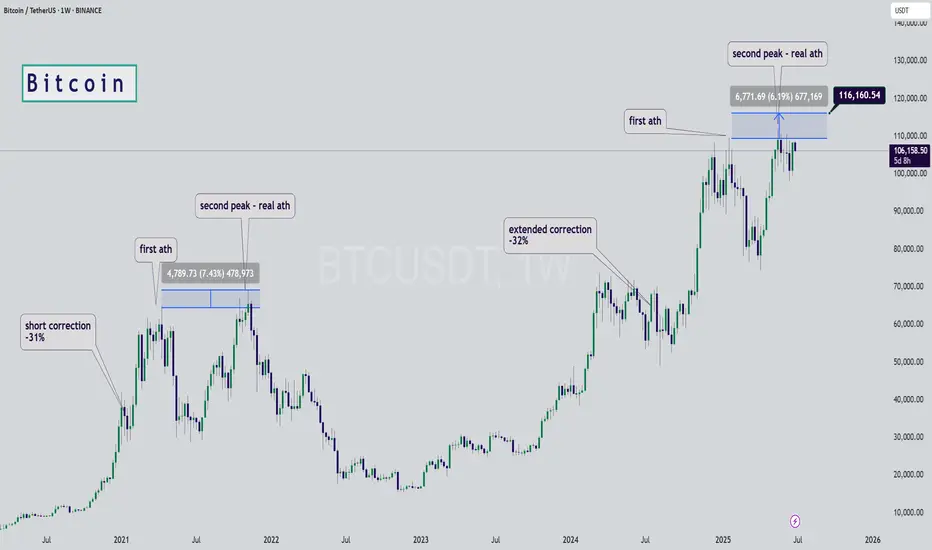
Bitcoin Fractal, increase to $116k Hi Everyone☕👋
BINANCE:BTCUSDT
Been such a long time since I posted. Today I'm looking at BTCUSDT, and I'm looking at the previous all time high cycle and what we were seeing (the pattern aka fractal).
Here's why we're likely going a little higher.
First correction of -32%
Followed by first peak, ATH
Correction, then the second peak and the REAL ath. Which is where we likely are:
Interesting to note that the previous time, the second ath was NOT THAT MUCH HIGHER. This should be considered to manage expectations in terms of how high we can go. Anything above +6% is a bonus.
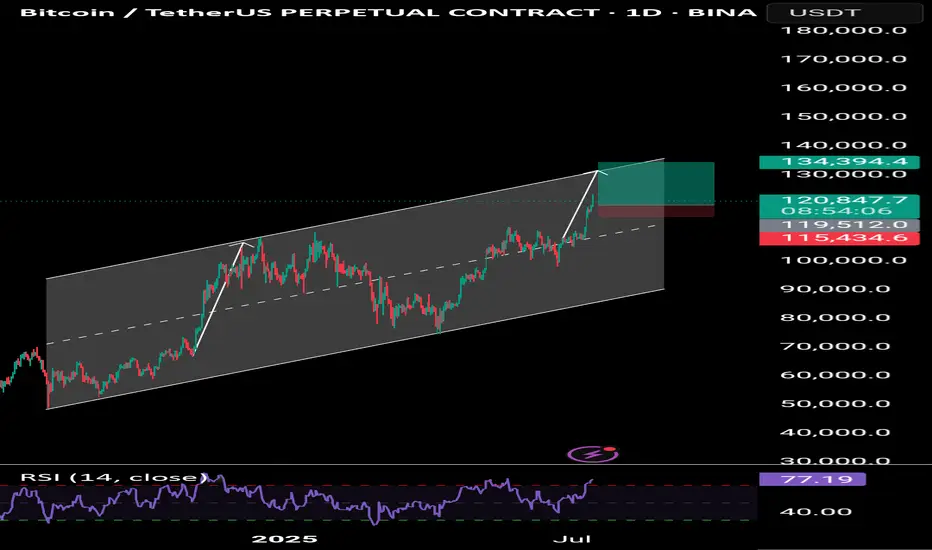
BTC Hits Channel Ceiling – Smart Money Taking ProfitsBINANCE:BTCUSDT.P
🚨 BTC has cleanly broken above $120K, tagging $123,300 today (ATH) — pushing the top boundary of a well-respected rising channel that’s been in play since April.
🔍 Analysis:
Structure & Trend:
Price broke out of a Descending Triangle back in March — that move initiated a trend, not just a spike. Since then, BTC has followed an ascending channel, showing institutional-style demand: controlled, aggressive, and layered.
Current Price Action:
We’re at the upper edge of the rising channel, where many traders either:
- Exit early out of fear of reversal,
or
- Chase breakout longs, often just before a shakeout.
Smart trading now = discipline, not FOMO
If BTC fails to hold above $120K, expect a cool-off to the channel midline around ($111K–$112K) or even lower.
🧠 What to Do as a Trader:
Already in from Lower?
This is your TP zone or trailing stop region. Don't get greedy.
Protect capital. Re-enter on retest or new setup.
Looking to Enter Now?
Not ideal. Let the chart either break and retest cleanly OR
pull back to mid-channel ($112K area) for a high-R:R setup.
📌 Summary
BTC is bullish — no denial. But this is the zone where pros reduce risk and wait for confirmation, while most retail enters blindly.
Don’t be the liquidity.
✅ Follow for more real-time updates
🔁 Share it with your fellow traders
🚀 And hit that Boost button to support the work!
Let’s trade smart, not emotionally. 💯
#CMPInsights
