Bitcoin Weekly Chart Outlook – Retrace Expected at 125KBased on the Bitcoin weekly chart, I’ve noticed a repeating pattern where Bitcoin tends to reach a short-term top or enters a retracement phase at every $25,000 level — $25K, $50K, $75K, $100K.
If this pattern continues, my projection is that Bitcoin could reach its next significant top or retrace zone around $125,000. This level could act as a psychological and technical barrier, attracting profit-taking and triggering a correction.
While this is not financial advice, it’s a structure I’m closely watching as the market unfolds.
What do you think? Let’s discuss.
BTCUSDT trade ideas

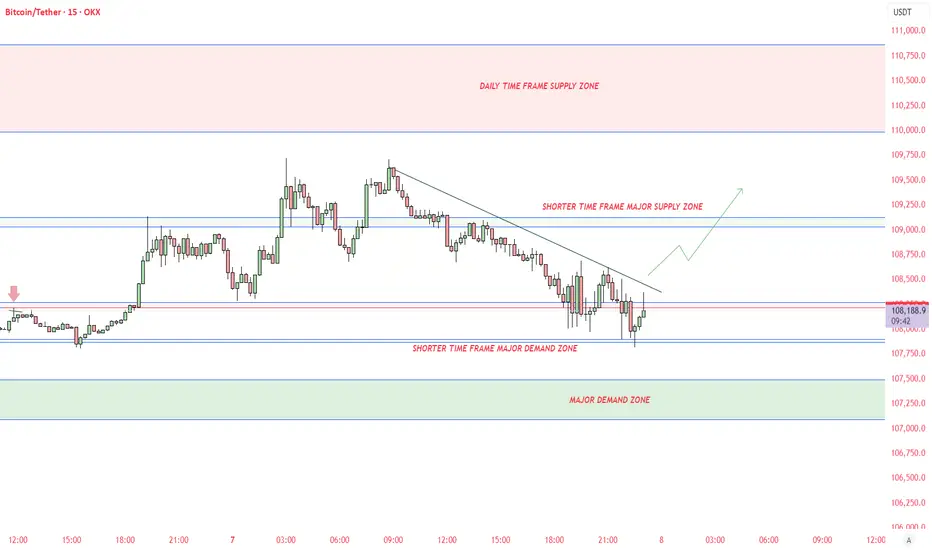
BTCUSDT - MOSTLY UPTREND DIRECTIONAll supply demand zone identified.
May breach till 110000$. Please do your own research before taking any trades
Bitcoin's Macro View: The Next Major Resistance ZoneAnalysis of the Daily Chart
This is the daily (1D) chart for Bitcoin (BTC/USDT), which shows the "big picture" trend over many months.
1. The Significance of the Breakout
You are correct to highlight the breakout. After consolidating for months and forming a solid base since April 2025, Bitcoin has now decisively broken out to new highs for the year. This is a very strong bullish signal on a macro scale, indicating that the long-term uptrend is accelerating.
2. The Immediate Resistance: The Green Zone ($128,000 - $132,000)
After such a powerful move, the next major obstacle is the area marked by the green box on your chart.
What is this zone? This area, approximately between $128,000 and $132,000, represents a major historical resistance or supply zone.
Why is it important? This is likely a price level where significant selling occurred in the past. As the price returns to this zone:
Traders who bought at the previous top may look to sell to get their money back ("break-even selling").
Bulls who have been riding the trend up from the lows may see this as a logical area to take profits.
New sellers may view it as an opportune level to open short positions.
What to Expect
When the price enters this key zone, we can expect a significant reaction. It is the next major battleground between buyers and sellers. Watch for:
A slowdown in the upward momentum.
A period of consolidation or sideways price action.
A potential rejection or a significant pullback from this area.
A clean and powerful break above this $128k - $132k zone would be an exceptionally bullish event, signaling a high probability of continuation towards new all-time highs.

Why This Breakout Feels Like $29K and $48K – Big Moves Ahead?🤔📊 Why This Breakout Feels Like $29K and $48K – Big Moves Ahead? 🚀📈
Hey everyone! It’s Saturday, July 12th , and while the markets take a breather, it’s the perfect moment to zoom out and assess the bigger picture . Are we in for another retail weekend surge?
Let’s break it down 🔍👇
After closely analyzing the charts, one thing becomes clear — this breakout is structurally similar to the previous key breakouts at $29K and $48K. In both historical cases, price surged significantly without immediately retesting the breakout level.
➡️ Back in 2020, price exploded +144% above the yellow level before ever coming back to test it.
➡️ At $48K, a similar move of +49% occurred before signs of exhaustion and a retest emerged.
Fast forward to today: We've just broken above a massive ascending support zone — $114,921–$115K — and the market shows no intention of pulling back yet. This tells us something powerful: Momentum is in control.
💡 According to my technical roadmap, we may not see a retest of $115K anytime soon. Instead, the next target zone lies around $182K–$189K, depending on velocity and sentiment. With halving-to-ATH cycles historically lasting ~550 days, we’re well within that bullish window.
Remember the channel support/last entry right after the Iran-Israel ceasefire on June 23rd? That’s been a defining entry and it’s still playing out beautifully. So we wish for geopolitical stability and peace.
So, while it’s easy to feel left out — don’t short, don’t sulk. This may be our moment to ride the wave long. 🎯📉📈
One Love,
The FXPROFESSOR 💙
Disclosure: I am happy to be part of the Trade Nation's Influencer program and receive a monthly fee for using their TradingView charts in my analysis. Awesome broker, where the trader really comes first! 🌟🤝📈

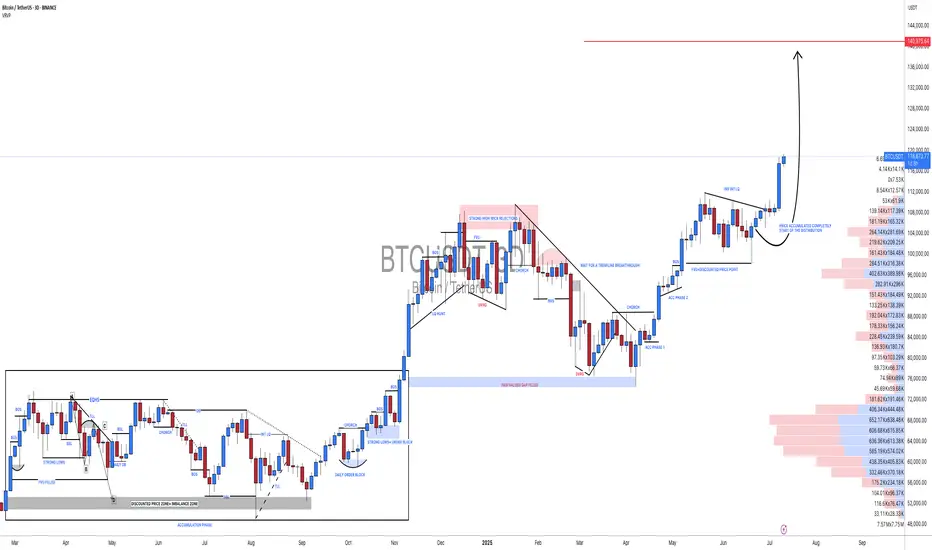
Btc usdt idea I think Btc will top around 140k and alt season will start at the distribution phase . we are so close for the money to start moving to the eth and other alts . pick wisely the time will arrive very quickly

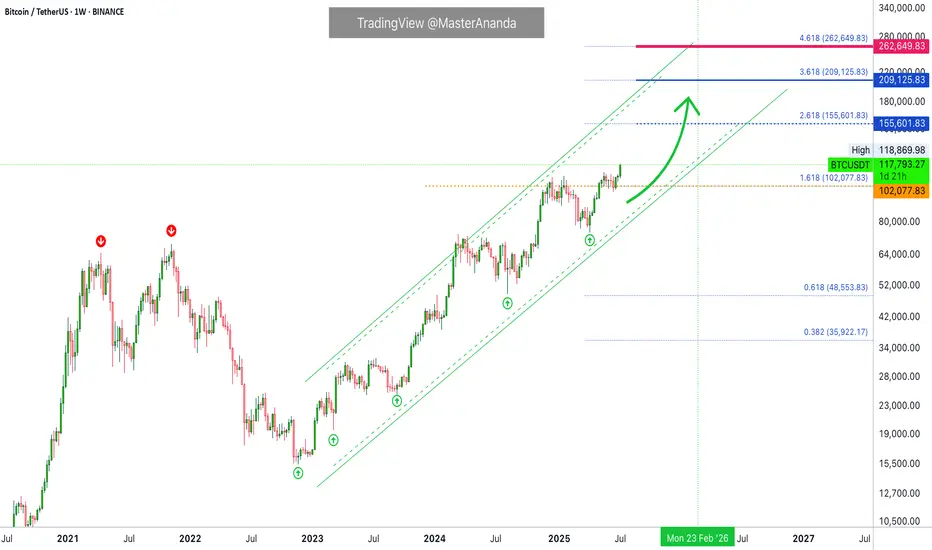
Bitcoin Crash? No! The Bullish Wave Starts Now! $155,601 Next!Some people are still expecting for "Bitcoin to go down." Poor bastards, the advance is just starting. Bitcoin just broke out of a 210 days long consolidation phase. After this huge, long-term consolidation, expect a major advance. Next target is now set at $155,601.
This week is the first week green after the consolidation finally ends. The market was sideways for seven months, with some fluctuations, and the result is a bullish breakout. Why a breakdown? Why expect a drop? If the market just broke up—think about it—why would it go down?
If resistance is confirmed; you remember the range between $100,000 and $110,000. If resistance is confirmed then Bitcoin would start crashing down from $110,000. If the break of $110,000 does happen and Bitcoin moves to $112,000 as a bull-trap, then you would expect a major crash happening from $112,000 and no more. But, reality is saying, showing, something much different. We have a major advance. Resistance has been flipped into support.
Now, the first that is needed is the weekly close. It is still very early into this move but Bitcoin is showing maximum strength. Remember the altcoins? These confirm that the advance is just new, early, because these are recovering from all-time lows or major lows. There is still plenty of room for growth.
My people, wake up! Bitcoin is going up.
The next target is $155,601 and it can go higher, this is only the mid-term target based on the long-term. When Bitcoin consolidates for 7 months, it tends to grow some 137% on average, it can be less but it can also be much more. And it tends to grow at least for 1-2 months, but this also is just the average, Bitcoin can grow straight up for 4 months.
So, are you still bearish?
Oh please no! The bulls already won.
The 2025 bull market final phase starts now, soon you will experience a marketwide bull-run. We have not seen the euphoria phase, this is only the start. Prepare for additional growth.
I am calling out all of the bears, never bet down on Bitcoin; Bitcoin is going up.
Namaste.
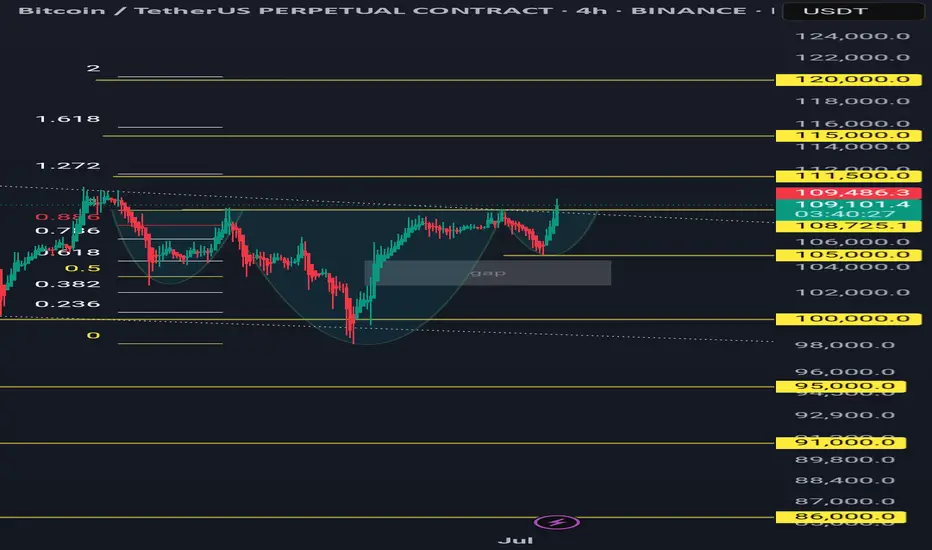
Btcusdt 4hr timeframe, bullish iH&S patternComming from shorters take profit area, formed a bullish ih&s pattern. If closes above 108725 in 4hr time, may activate the pattern.
Targets are 111500, 115000 and 120000
Invalidation if closes below 105k
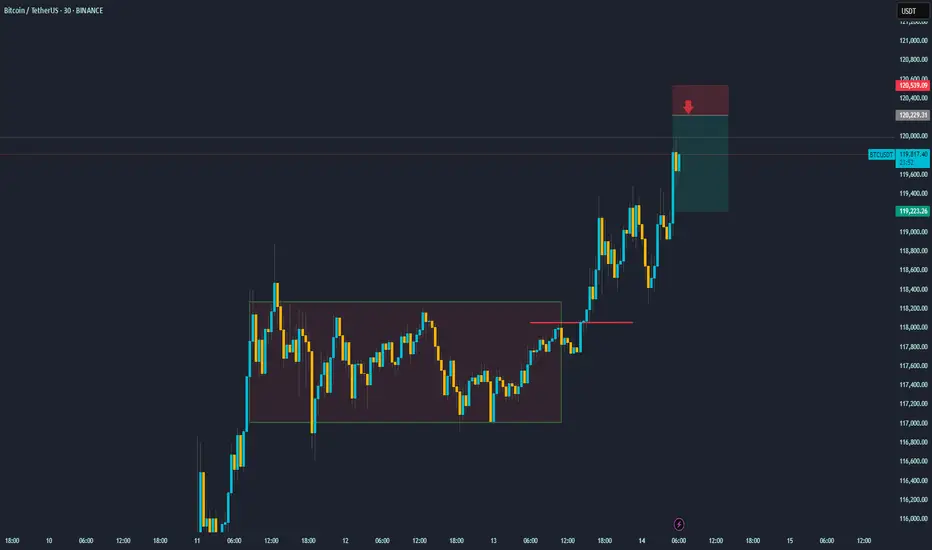
Bitcoin's Next Move: Planning the Counter-Trend ShortThis 30-minute BTC/USDT chart provides an excellent case study. After successfully identifying and trading the breakout from the consolidation range (highlighted in the brown box), the focus now shifts to a new, potential trade setup.
Asset: Bitcoin / TetherUS (BTC/USDT)
Timeframe: 30-Minute
Recap: The price has powerfully broken out of its previous range, a move that was anticipated and resulted in a successful long trade.
Current Situation: Following the strong, nearly vertical rally, the price is approaching the psychological $120,000 level. Runs like this are often followed by a period of profit-taking or a short-term pullback.
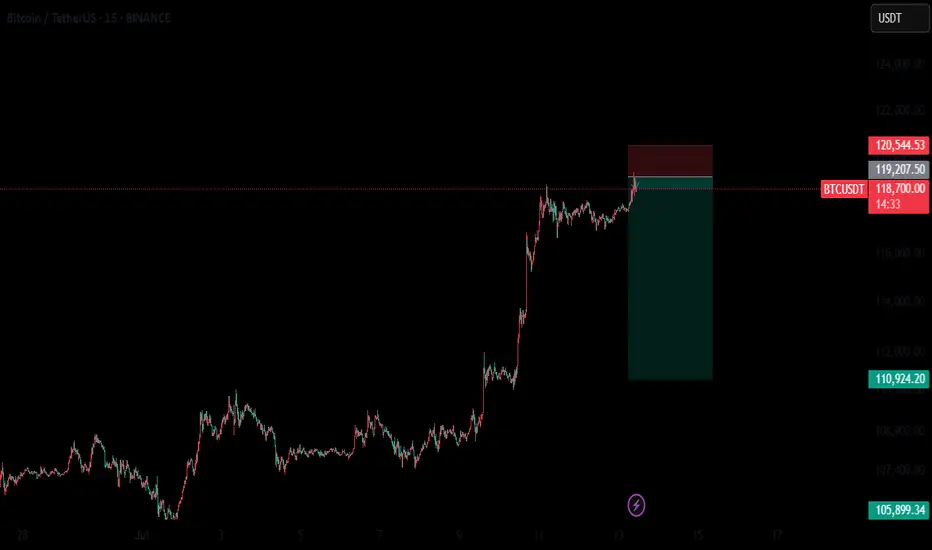
The New Trade Plan: A Bearish Setup
The chart now displays a new short position setup. This is a bearish, counter-trend trade designed to profit from a potential price rejection.
Strategy: To sell or "short" Bitcoin at a higher price, anticipating a pullback. This is a riskier strategy than trading with the trend, but it's based on the idea that the sharp rally is due for a correction.
The Setup is as follows:
Entry (Sell): $120,222.31
Take Profit (Target): $119,323.25
Stop-Loss (Invalidation): $120,579.09
In summary, after the breakout rally, the plan is to watch for signs of exhaustion. If the price pushes up to the $120,222 level and gets rejected, this trade aims to capture the resulting downward move towards the $119,300 area. The stop-loss is placed tightly above to manage risk in case the powerful uptrend continues without pausing
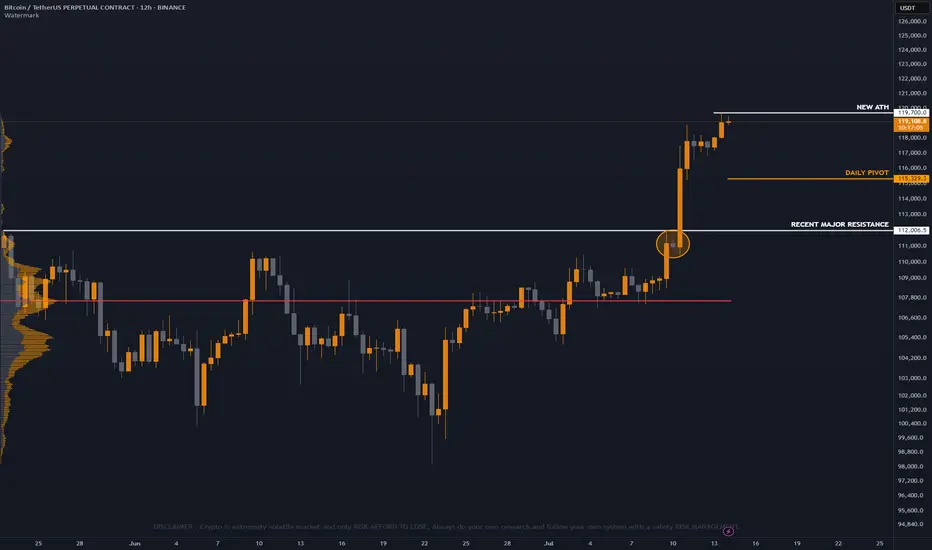
Bitcoin Update H12 Timeframe
New All time high unlocked again this time at 119700 area ! 🚀
Take note panda fam there's a unfilled gap below on bitcoin price still consider correction below is still possible, Above ATH price is discovery price panda fam.
But as of now since BTC is on fire and hype, Buyers volume are still strong this time, Trade safe always panda fam will focus on altcoins scalp trade. 🔥

Bitcoin Overall: higherBitcoin most likely to continue higher from one of the indicated ranges. It may be best to split a trade 1/2 entry on one and 1/2 entry on other with stop below the second, or 2 trades with 1/2 normal risk.

2 RRBitcoin has risen significantly, if it retraces some it will likely stop at the indicated range. Target will need to be selected after the entry based on the development of the chart.

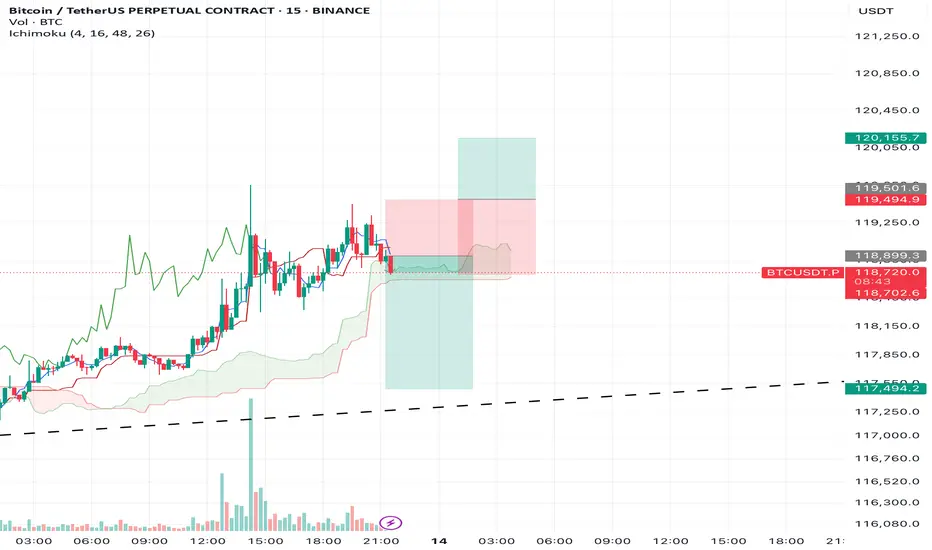
BTC/USDT – Weekly Outlook & Reflection (15m, Ichimoku) by RiscorA new trading week begins after an exceptionally strong bullish close last week. Given the strength of that rally — and seeing how long/short ratios are now heavily skewed to the long side — I expect this week to open with a pullback.
To me, the bullish impulse feels exhausted, so I’m watching for a short-term retracement. My initial target is a move toward 117,500, but if the correction accelerates, we could even see a deeper dip, possibly down to the 113,000 area.
That said, the uptrend is still strong — any shorts here are high-risk, countertrend trades. I’ll treat all short setups as tactical reversals only, not as a full trend change. Caution is key in this environment!
Let’s see how the structure develops as the week unfolds.
Bitcoin (BTCUSDT) Potential Move from $43,600 to $120,000Description:
Based on the current weekly chart analysis for Bitcoin / Tether Standard Futures (BTCUSDT), there is a significant potential for Bitcoin to move from $43,600 to $120,000. Below are the key points observed:
Current Price: Bitcoin is currently trading at approximately $54,806.45, down by 5.75%.
Elliott Wave Analysis:
The chart indicates a potential ABC correction pattern.
Wave A has completed, and Bitcoin is currently in Wave B, which suggests an upcoming bullish Wave C.
Support and Resistance Levels:
The primary support level is at $39,987.31.
The significant resistance level and target is the area around $120,000.
Fibonacci Retracement Levels:
38.2% Retracement: $31,145.00
50.0% Retracement: $23,356.00
61.8% Retracement: $15,568.00
Indicators:
RSI shows potential bullish divergence indicating a possible upward move.
Volume profile indicates strong accumulation in the lower price ranges.
Extrem Buy Alert: The chart highlights an "EXTREM BUY ALERT," suggesting that the current levels could be a significant buying opportunity before the expected upward move.
Chart Details:
Timeframe: Weekly (1W)
Ticker: BTCUSDT.PS
Exchange: Binance
Disclaimer: This analysis is based on historical data and technical indicators. It is not financial advice. Please conduct your own research before making any trading decisions.

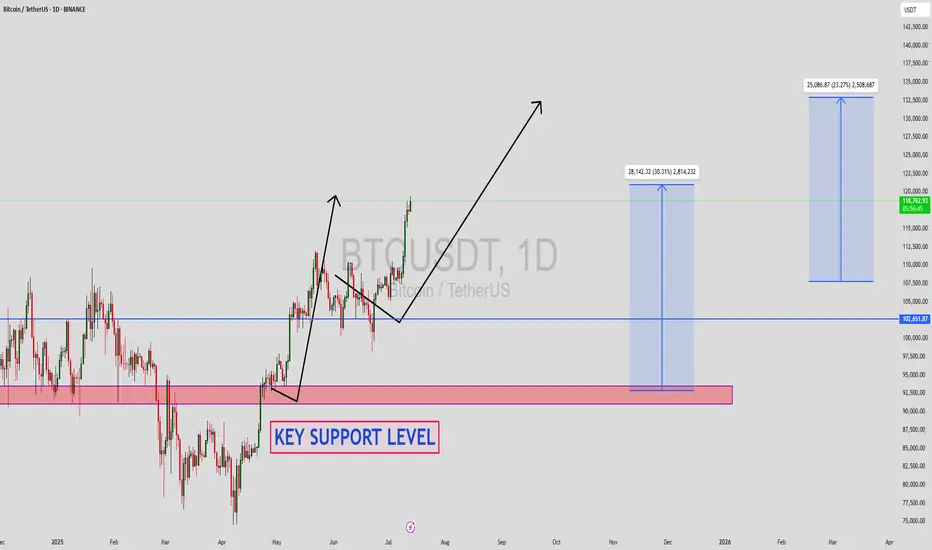
BTCUSDT Forming Strong BreakoutBTCUSDT is looking increasingly bullish as the pair continues to hold above its key support level, building a solid foundation for the next major leg up. The chart clearly shows a strong breakout pattern forming with higher highs and higher lows, signaling that the momentum is shifting in favor of the bulls. The well-defined support zone highlighted on the chart has repeatedly acted as a launchpad for buyers, making this area crucial for traders to watch closely. A breakout above the recent consolidation could open doors for a significant rally toward the 140% to 150% gain levels projected.
Volume for BTCUSDT remains robust, confirming the strong interest from both retail and institutional investors. This is a good sign because healthy volume typically precedes strong price action and follow-through. As Bitcoin continues to dominate the crypto market, it often sets the tone for the entire altcoin space, so a strong BTC rally could spark renewed optimism across the board. Traders are now keeping a close eye on whether BTC can maintain its position above the key psychological levels shown on the chart, as this could trigger another wave of buying momentum.
Investors are increasingly looking at BTCUSDT as a safe bet in an otherwise volatile market. Bitcoin’s fundamentals remain strong, with growing adoption, continued development, and macroeconomic conditions that could favor a hedge like BTC. Combined with the current technical setup, the outlook is promising for a big move to the upside. As we approach the next few weeks, the market sentiment suggests that any dips towards the key support level might be seen as attractive buying opportunities.
✅ Show your support by hitting the like button and
✅ Leaving a comment below! (What is You opinion about this Coin)
Your feedback and engagement keep me inspired to share more insightful market analysis with you!
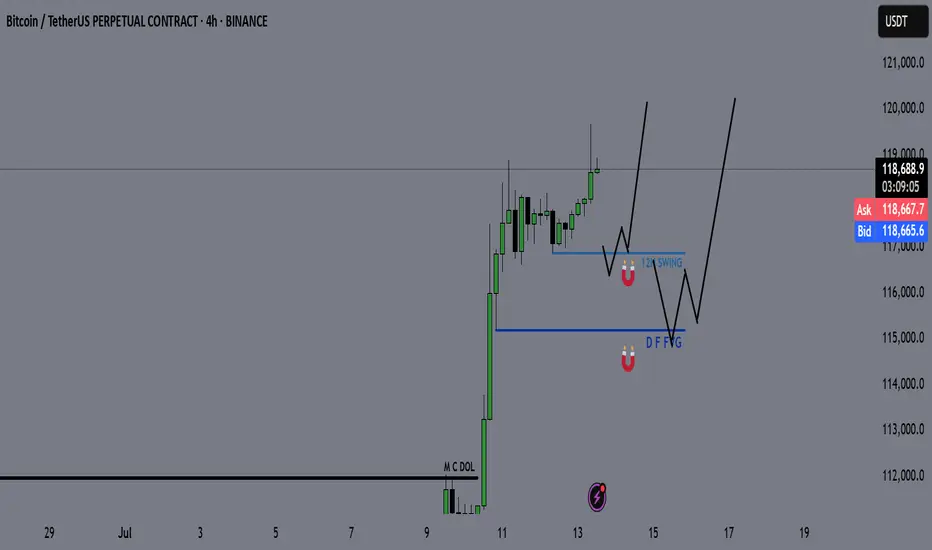
Bitcoin - BTC | Weekly Market Recap & Outlook 13.07.2025What Happened Last Week?
Bitcoin broke out of the recent downtrend structure and established a bullish leg with clear momentum.
The breakout was supported by volume and price structure, suggesting a trend reversal rather than a temporary deviation.
Weekly Bias and Strategy
The current outlook is bullish.
A retracement or sideways consolidation between the $120,000 and $114,000 zone is possible.
This zone may act as accumulation before further upside.
Key Points of Interest (POIs):
12H Swing Liquidity (turquoise line)
Daily FVG (blue line)
These levels will be monitored for long setups with confirmation on lower timeframes.
Macro Consideration – Fed Chairman Jerome Powell
Recent market speculation has increased regarding Jerome Powell potentially stepping down as Chair of the Federal Reserve.
If such a resignation is confirmed, it may act as a significant bullish catalyst for Bitcoin and other risk assets, possibly accelerating upside without allowing for any meaningful pullback.
Summary
• Bullish breakout confirmed
• Long bias maintained unless major invalidation occurs
• Watching retracement levels for entries
• Macro catalyst (Powell resignation) may trigger strong continuation without retrace
#BTCUSDT[BITCOIN]: What Next Now For Bitcoin? We’ve published multiple analyses on Bitcoin, and as expected, the price has moved in line with our predictions. Now that it’s reached an emotional level of 120k, the main question is: will price hold on to the bullish volume and continue the bull move to the next target, which could be 130k or 150k? In our opinion, price will remain bullish until it touches the 130k region. At that point, we could see a short-term bearish correction for Bitcoin. Please do your own analysis and risk management.
Team Setupsfx_
BTC Short Call!hort Call on BTC (Short-Term)
Entry: Sell 1 BTC Call @ $120,000 strike, August expiry (~4 weeks)
Premium Collected: ~$1.5K–$2K (~0.013 BTC)
Thesis: BTC is facing resistance in the $118.9K–$120K zone. While overall trend is bullish, short-term momentum may stall at new highs. A short call captures time decay, profiting if BTC consolidates or retraces.
Risks: Unlimited if BTC rallies strongly above $120K. Consider hedging with a long call at $125K strike.
Target: Keep the entire premium if BTC <= $120K at expiry.
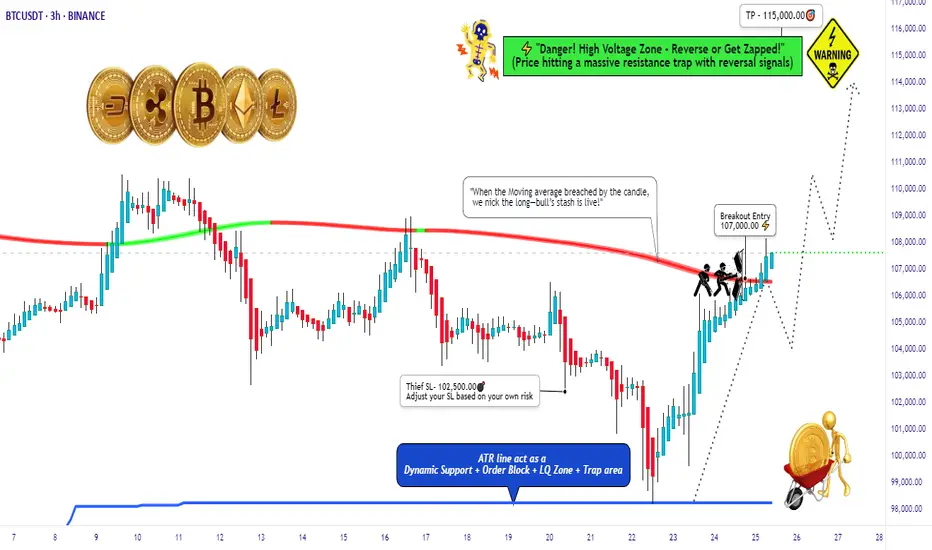
BTC/USD Thief Breakout at $107K – Eyeing $115K!🚨 Thief Entry Setup: BTC/USD Breakout Play 🚨
Overview:
Jump in after the $107 000 breakout—aiming for $115 000 with a tight “Thief SL” at $102 500. Adjust the stop‑loss to match your personal risk tolerance.
🧠 Setup Summary
Pair: BTC/USD
Entry trigger: Breakout above $107 000
Stop‑Loss: “Thief SL” at $102 500 (use your own risk‑based SL)
Target: $115 000
🎯 Why This Setup?
Clear breakout level at $107 000 = fresh momentum
Tight SL cushion (≈‑4.3%) = defined risk
Target ≈ +7.5% potential = strong reward-to-risk (~1.75:1)
📏 Risk Management Tips:
Only risk a small % of your capital—never exceed your comfort zone.
Move your SL to breakeven once mid‑target is hit to lock in profits.
Trailing your stop‑loss could secure bigger gains if BTC surges toward $115 000.
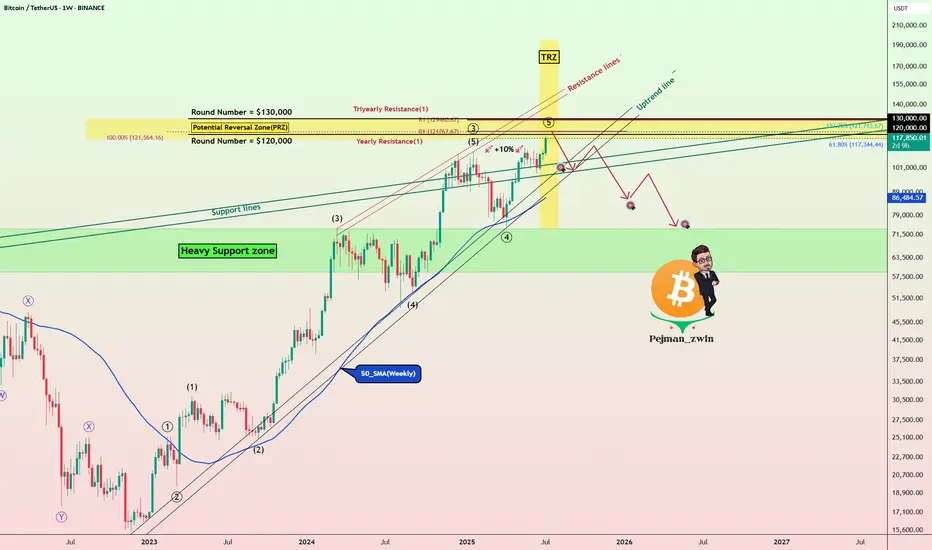
Bitcoin Roadmap=>End of RallyBitcoin ( BINANCE:BTCUSDT ) has gained nearly +10% in the recent weekly candle so far. The question is where this rally could end up. So to get to that zone, let’s go to the weekly timeframe .
Before we start this analysis, let’s take a look at my last analysis on the weekly timeframe , which was well into the Potential Reversal Zone(PRZ) . ( Analysis time: 9 JUN 2025 )
Bitcoin has now entered the Potential Reversal Zone(PRZ) and Time Reversal Zone(TRZ=June 23 to August 4) , and these zones could be the zones where this Bitcoin rally will end. Do you agree with me?
In terms of Elliott Wave theory , Bitcoin appears to be completing a main wave 5 , as the main wave 3 was an extended wave . The main wave 5 could end at the Potential Reversal Zone(PRZ) .
I expect Bitcoin to start a main correction from the Potential Reversal Zone(PRZ) and could continue to support lines and near the $105(at least) .
What do you think about the end of the Bitcoin rally?
Note: Sell orders near $120,000 are very heavy.
Note: Cumulative Long Liquidation Leverage attractive volume for liquidation.
Note: If Bitcoin goes above $130,000, it can continue to rise to the Resistance lines (near $150,000).
Please respect each other's ideas and express them politely if you agree or disagree.
Bitcoin Analyze (BTCUSDT), weekly time frame.
Be sure to follow the updated ideas.
Do not forget to put a Stop loss for your positions (For every position you want to open).
Please follow your strategy and updates; this is just my Idea, and I will gladly see your ideas in this post.
Please do not forget the ✅' like '✅ button 🙏😊 & Share it with your friends; thanks, and Trade safe.
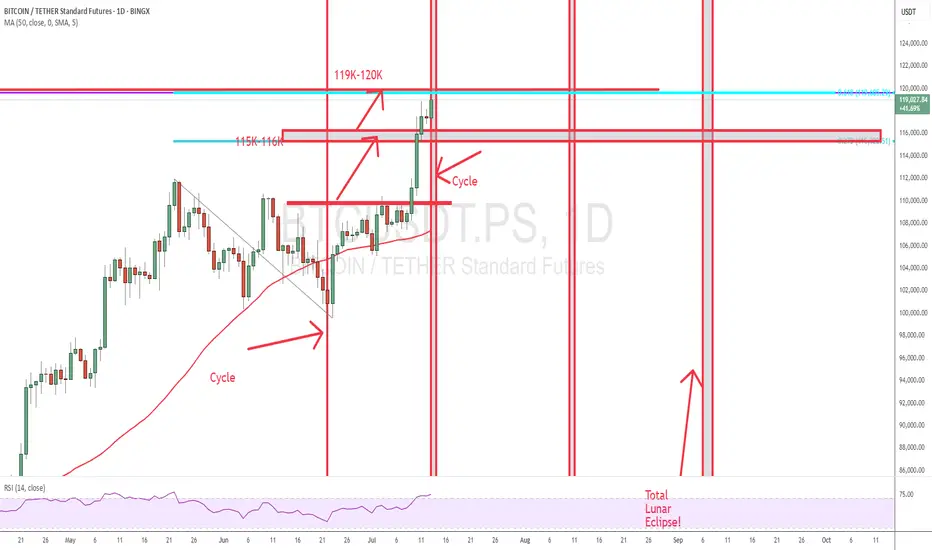
BTC updateFinally, BTC got to my price.
It came exactly to the price and Time (Cycle). Let's see if we clear that.
Good Luck
Flawless ExecutionA picture-perfect trade on CRYPTOCAP:BTC from start to finish. 🎯
The Plan: Wait for the breakout above resistance.
The Result: A powerful move straight through our target zone.
Clean analysis, clean execution, clean profits. On to the next one.
#Bitcoin #Trading #Crypto #TechnicalAnalysis #BTC

TradeCityPro | Bitcoin Daily Analysis #127👋 Welcome to TradeCity Pro!
Let’s dive into the Bitcoin analysis and the key crypto indexes. In this analysis, as usual, I want to review the New York session futures triggers for you.
⏳ 1-Hour timeframe
In the 1-hour timeframe, as you can see, Bitcoin, after the correction down to the 116829 level, is now breaking the 118494 top again.
🔔 This move can potentially start Bitcoin’s next bullish leg. In that case, I think this leg will be a strong one because the correction was very shallow and didn’t even reach the 0.236 Fibonacci level, so the price may perform another sharp move.
💥 On the other hand, the RSI oscillator is entering Overbuy, which increases the probability of a bullish scenario and a sharp next leg.
📈 If the 118494 level is broken, we can open a long position. We already have suitable confirmations for this position since volume and RSI are aligned with price, and also the SMA25 is supporting the price and pushing it upward.
👑 BTC.D Analysis
Let’s move on to Bitcoin Dominance. The dominance trend is still bearish and continuing downward.
⭐ Currently, it’s sitting on a key support at 64.44, and breaking this level can continue the bearish move in dominance.
📅 Total2 Analysis
Let’s go over Total2. Yesterday, after correcting to the 1.26 level, it seems the next bullish move has started and it’s heading toward 1.3.
🎲 The main resistance I see for Total2 is still 1.33, and I believe this will be the main ceiling that Total2 will struggle with.
📅 USDT.D Analysis
Moving on to Tether dominance. This index is still dropping and is now sitting at the 4.36 support.
✨ Breaking this level will start the next bearish leg, and the price can move toward 4.22. If a correction occurs, the first level will be 4.49.
❌ Disclaimer ❌
Trading futures is highly risky and dangerous. If you're not an expert, these triggers may not be suitable for you. You should first learn risk and capital management. You can also use the educational content from this channel.
Finally, these triggers reflect my personal opinions on price action, and the market may move completely against this analysis. So, do your own research before opening any position.
