BTC AI Prediction Dashboard - 6h Price Path
BTCUSDT Forecast:
Crypticorn AI Prediction Dashboard Projects 6h Price Path (Forward-Only)
Forecast timestamp: ~13:45 UTC
Timeframe: 15m
Prediction horizon: 6 hours
Model output:
Central estimate (blue line): ~118,370
40% confidence band (light blue): 117,719 – 118,563
80% confidence band (dark blue): 117,040 – 119,652
Volume on signal bar: 331.4
Observations:
Price currently near central estimate, within 40% band
Continuation likely as long as price remains within 80% band
Moves outside 80% = low-probability fade or potential breakout
Model does not repaint. Forecast is fixed once published.
BTCUSDT trade ideas

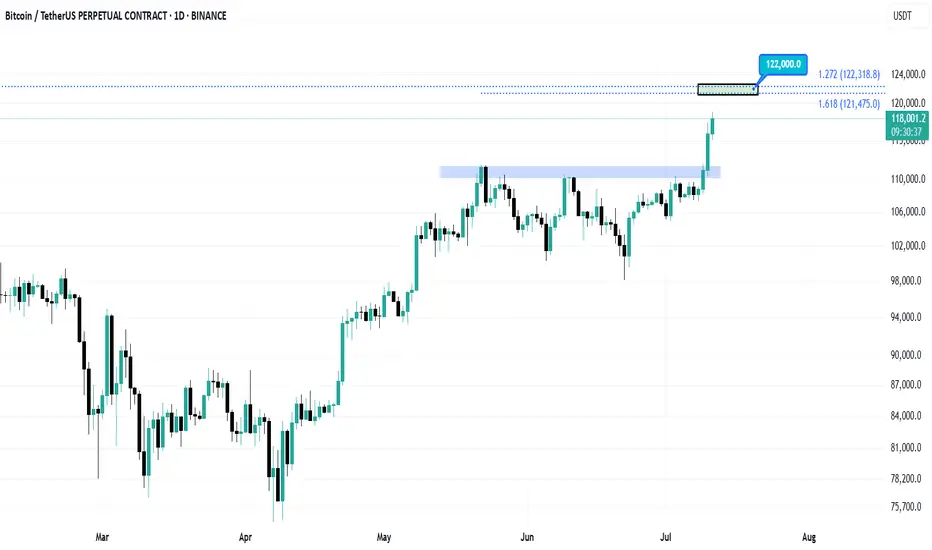
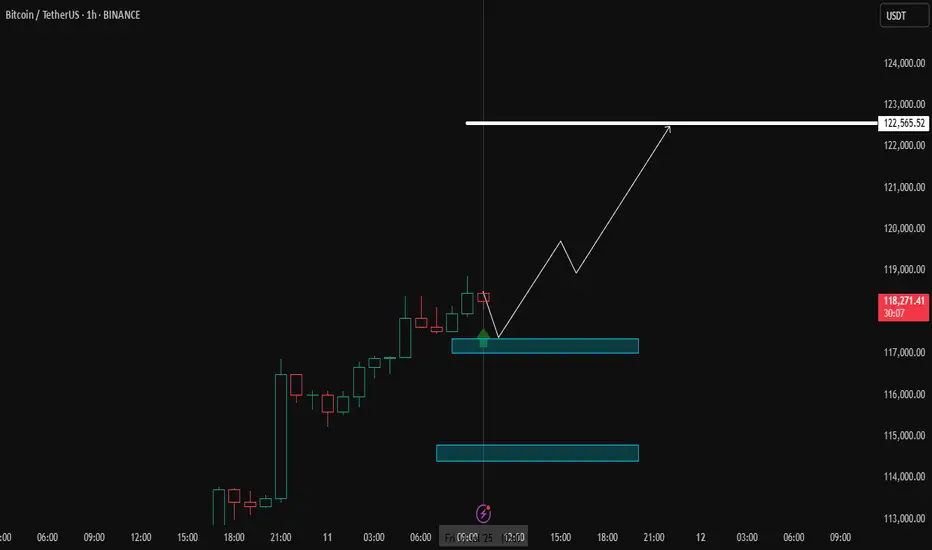
BitcoinThe next target for Bitcoin is $122,000.
I will update the chart when this target is reached.
Follow so you don't miss the next analysis.
BTC/USDT – Intraday Reflection & Plan (15m, Ichimoku) by RiscoraYesterday was a fantastic bullish day, but price never reached my planned long entry block — buyers were too strong for a proper retest.
At this stage, I believe the bullish impulse has run its course and we’re likely to see a sideways phase, as marked on my chart. I don’t expect new highs from here: the market is overcrowded with longs, and this rally needs to cool off.
My base case is that BTC consolidates in this range for a while, with price chopping back and forth to unwind the excess leverage.
I’ll be watching for signs of distribution: a rising wedge or a deeper pullback can’t be ruled out, but I’ll wait for clear signals from indicators and market positioning (especially long/short ratios).
For now, I plan to range trade this zone, but shorts are very risky — that’s a strong countertrend play. If you must short, use minimal size, because the uptrend is still powerful and I could be wrong.
Let’s watch how the structure develops.
#BTC #Crypto #Trading #Ichimoku #Riscora

TradeCityPro | Bitcoin Daily Analysis #125👋 Welcome to TradeCity Pro!
In this Bitcoin analysis, I want to switch to a higher timeframe and analyze the daily chart because a very significant resistance has been broken and it’s important to take a closer look.
📅 Daily Timeframe
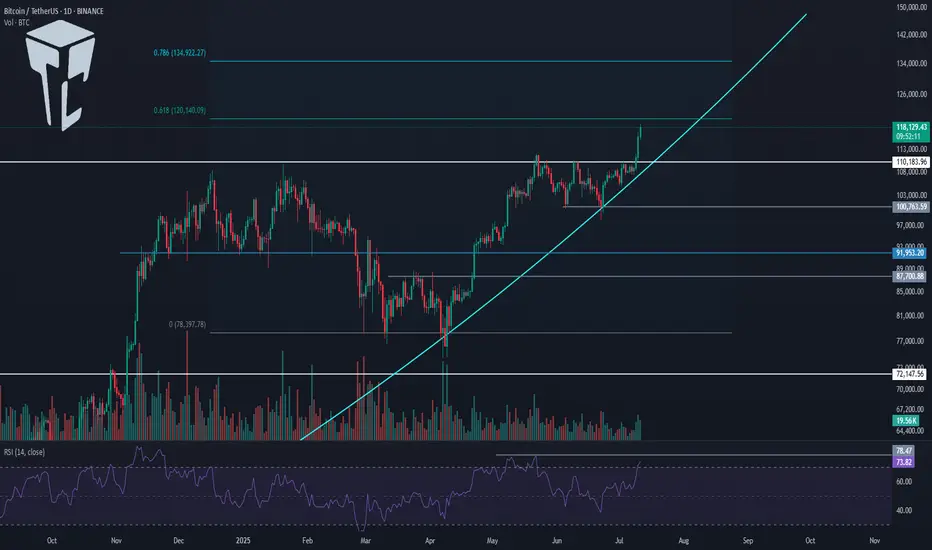
On the daily chart, as you can see, a bullish trend started around the 80000 level and in the first leg moved up to 110183. After a prolonged correction, the price has now managed to break that previous high and begin a new bullish leg.
⚡️ As shown, volume was sharply decreasing during the correction phase, but in the past few candles, significant buying volume has entered the market, enabling the price to break above 110183.
💥 The RSI oscillator is entering the Overbuy zone in today’s candle, which could be a sign of continuation of this bullish move. The next RSI resistance is around 78.47.
🎲 Meanwhile, based on Fibonacci levels, 120140 and 134922 are key zones that could mark the end of this bullish leg. The price is currently very close to 120140, and we need to watch for the market's reaction to this level.
✅ If 120140 is broken, Bitcoin will likely head toward 134922. In that case, I believe this leg could be the final bullish leg of this bull run, since I’ve previously mentioned that my target range for Bitcoin in this cycle is between 130000 and 180000.
📊 The curved trendline I’ve drawn is very important in this leg. As long as the price remains above this trendline, the market momentum will stay bullish, and the likelihood of continued upward movement increases.
🔽 If this trendline is broken, we could see the first signal of a trend reversal. A close below 110183 would confirm that the breakout was fake, and a break below 100763 would open the door for a longer-term short position.
❌ Disclaimer ❌
Trading futures is highly risky and dangerous. If you're not an expert, these triggers may not be suitable for you. You should first learn risk and capital management. You can also use the educational content from this channel.
Finally, these triggers reflect my personal opinions on price action, and the market may move completely against this analysis. So, do your own research before opening any position.
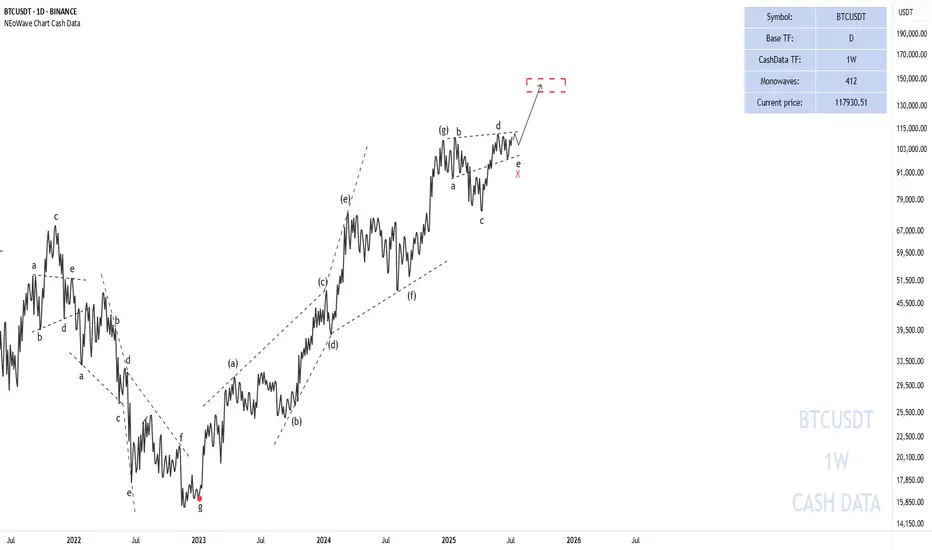
BITCOIN =140-150kThe X-wave has formed in the form of a neutral triangle pattern, and eventually Bitcoin could once again touch $106,000 and move towards $140,000-150,000 with the completion of wave-e.
Good luck
NEoWave Chart
Historical Top?It wasn't triangle. Just one of the bull trap.
But how about this ath?
I think this is trap, too.
2021 April~December movement.
Do you remember at that time?
If you do, you won't open a short postion.
Finale makes incredible Alt BullRun, always.
This month is the most important for checking annual trend.

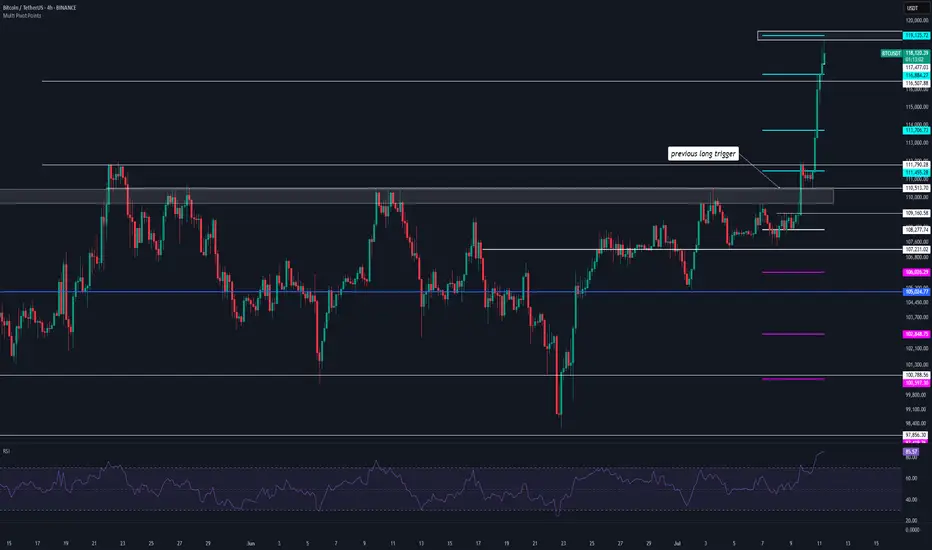
HolderStat┆BTCUSD above the $115kOKX:BTCUSDT broke out of its consolidation structure and surged past $115,000 resistance. The price is showing parabolic behavior as it targets the ATH level near $125,000. Structure remains bullish as long as the support base near $113,000 holds.

BITCOIN ABOUT TO CRASH HARD!!!!? (Be careful with your longs)I am sharing with you in this video the next CRYPTOCAP:BTC important resistances and support levels.
Together with the confirmations, it is said that if triggered, Bitcoin will start crashing hard, so be careful if you have overleveraged long positions opened right now!
Remember to always trade only with professional trading strategies and tactics, and make sure that your money management is tight!

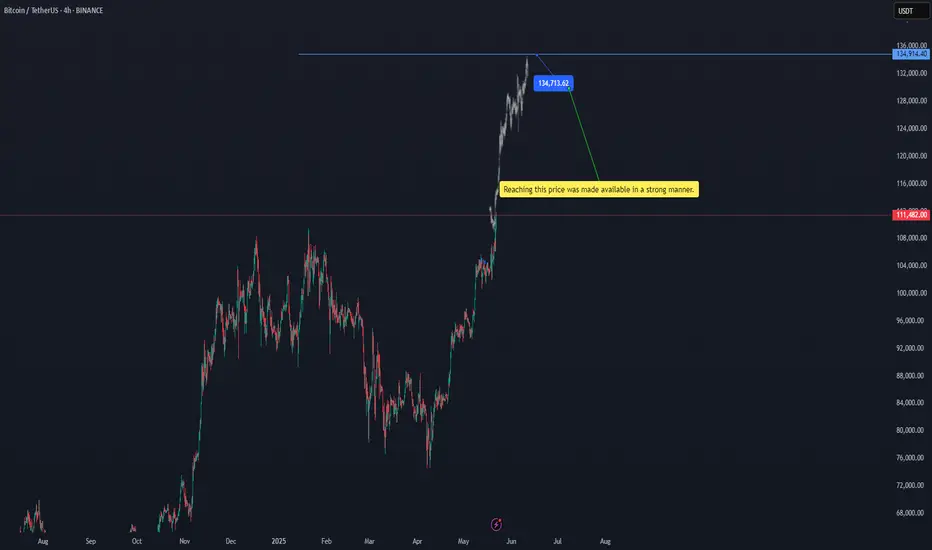
btcusdtReaching this price was made available in a strong manner. 134713.16$ BINANCE:BTCUSDT
Of course, there is a possibility of a temporary correction at the current price, but the target is $134,713.
#btc
BTCQuick trade. I hope everyone manages their risk and enters after the close. 4-hour time frame. Leverage from 10 to 100.

BITCOINAs of July 11, 2025, Bitcoin (BTC) is experiencing a strong bullish surge, reaching new all-time highs:
Current Price: Around $117,786 per BTC, up about 1.55% on the day, with an intraday high near $118,780.
Market Cap: Approximately $2.33 trillion, reflecting significant institutional and retail interest.
Trading Volume: High, with 24-hour volume exceeding $124 billion, indicating robust market activity.
Key Drivers Behind Today’s Bitcoin Rally:
New All-Time High: Bitcoin recently surpassed its previous record, hitting nearly $118,800, fueling bullish momentum.
Massive Short Squeeze: Over $1 billion in short positions were liquidated within 24 hours, including around $570 million in Bitcoin shorts, accelerating the price rally.
ETF Inflows: US spot Bitcoin ETFs have seen substantial inflows (around $50 billion this week), signaling strong institutional demand.
Technical Breakout: Technical indicators show a strong bullish trend, with Bitcoin targeting levels above $126-130K,
Macro Environment: The US dollar is weakening sharply (its worst performance since 1973), boosting risk assets like Bitcoin.
Growing Adoption: Corporate treasury purchases and positive regulatory developments in the US are enhancing investor confidence.
Market Sentiment and Outlook:
The Relative Strength Index (RSI) is above 70, indicating strong bullish momentum but also suggesting caution for a possible short-term pullback.
The number of Bitcoin wallets holding BTC has increased significantly, showing renewed accumulation by investors.
Technical Outlook Bullish, target $120K+
Bitcoin’s rally today is driven by a powerful combination of technical breakout, institutional buying, short squeeze dynamics, and supportive macroeconomic factors, making it one of the strongest moves in crypto markets this year.
#BTC #BITCOIN

BTC/USDT : Breaks Out – New Highs In Sight After Smashing $111K!By analyzing the Bitcoin (BTC) chart on the weekly timeframe, we can see that the price has finally started to rally as expected—successfully hitting the $111,700 target and even printing a new high at $111,999 with an impressive pump.
This analysis remains valid, and we should expect new all-time highs soon.
The next bullish targets are $124,000 and $131,800.
THE WEEKLY TF ANALYSIS :

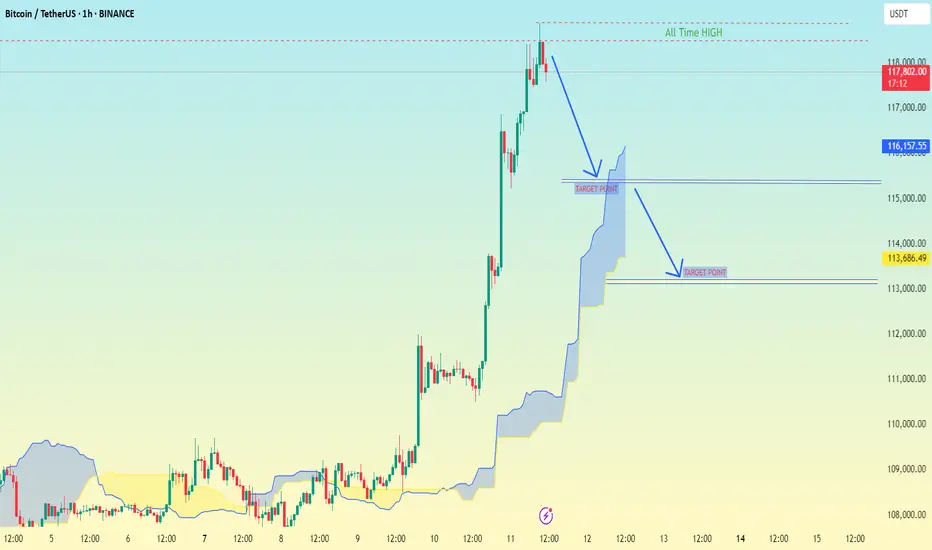
Bitcoin (BTC/USDT) on the 1-hour timeframeBitcoin (BTC/USDT) on the 1-hour timeframe:
🔽 Bearish Target Points (Downside Levels):
First Target: ~116,157.55 USDT
This level is close to the upper edge of the Ichimoku Cloud (Kumo), which can act as initial support.
Second Target: ~113,686.49 USDT
This is the deeper pullback level, marked clearly as the main "Target Point" on the chart. It aligns with historical structure and is near the lower part of the cloud.
🧠 Summary:
The chart suggests a potential pullback from the recent all-time high (~118,110 USDT).
If price breaks below 116k, the next major support is ~113.6k.
Traders might look for buy entries at these levels if price action confirms support.
Bitcoin (BTC): Markets on Fire | Almost at $120K (140K Next?)Markets are going crazy, people are in fear of missing out (FOMO) and we are just chilling; the price moved exactly like we needed it to move.
We are very close to our target of $120K,, where we might see some kind of strong rejection or even stronger bullish volume (we will have to reach this areaa before deciding our next gameplay).
What we see or aim at is $140K to be a local to for this bull run. After that we are expecting more of sideways movement and then a bigger correction to happen.
Swallow Academy

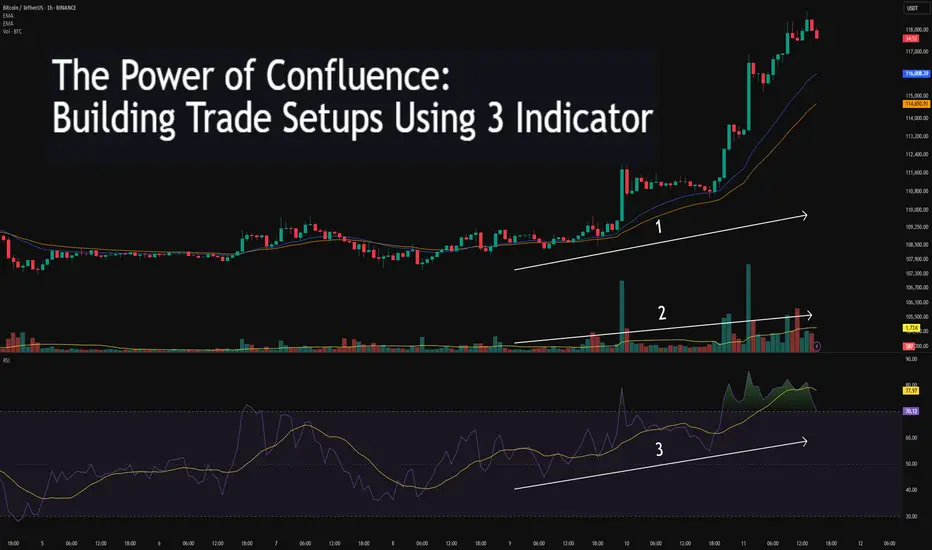
The Power of Confluence: Building Trade Setups Using 3 Indicator🔵 INTRODUCTION
Many traders fall into the trap of relying on a single indicator to make trading decisions. While one tool might work occasionally, it often leads to inconsistent results. The key to consistency lies in confluence — the strategic combination of multiple indicators that confirm each other.
In this article, you'll learn how to build high-probability trade setups by combining three essential components: trend , momentum , and volume .
🔵 WHY CONFLUENCE MATTERS
Confluence refers to multiple signals pointing in the same direction. When different indicators agree, your trade idea becomes much stronger. It helps reduce noise, avoid false signals, and increase confidence in your entries.
Think of it like crossing a busy road: you wait for the green light, check both sides, and make sure no cars are coming. The more confirmations you have, the safer your move.
🔵 WHAT IS CONFLUENCE IN TRADING?
Confluence means agreement. In trading, it’s when different methods, indicators, or tools all point toward the same outcome.
Think of it like this:
One green light? Maybe.
Two green lights? Worth watching.
Three green lights? That’s a trade worth considering.
Imagine you're planning a road trip. You check the weather forecast (trend), Google Maps traffic (momentum), and ask a local for advice (volume). If all three say “go,” you’re more confident in your decision. Trading works the same way — using multiple tools to validate a setup reduces risk and removes guesswork.
Important: Confluence is NOT about cramming 10 indicators onto your chart. It’s about using a few that each offer different types of information — and only acting when they align.
🔵 THE 3-STEP CONFLUENCE SETUP
1️⃣ Identify the Trend (Using EMAs)
Before entering any trade, you need to know the market direction. You can use:
Moving Averages (e.g., 21 EMA and 50 EMA crossover)
Structure-based analysis (e.g., higher highs = uptrend)
Trade only in the direction of the prevailing trend.
2️⃣ Check Momentum (Using RSI, MACD, or Stochastic)
Momentum tells you whether the market supports the current trend or if it's weakening.
RSI above 50 → Bullish momentum
MACD histogram rising → Acceleration
Stochastic crossing above 20 or 80 → Momentum shifts
Avoid entering when momentum is fading or diverging from price.
3️⃣ Confirm with Volume (To Validate Participation)
Volume reveals the strength behind the move. A breakout or trend continuation is more reliable when it's backed by volume.
Look for:
Volume spikes at breakout points
Increasing volume in the direction of the trend
Volume confirmation after pullbacks or retests
No volume = no conviction. Watch how the market "votes" with actual participation.
🔵 EXAMPLE TRADE SETUP
Let’s say you spot a bullish trend with 21 EMA above 50 EMA. RSI is above 50 and rising. A pullback forms, and volume picks up as price starts to push higher again.
That’s trend + momentum + volume lining up = a confluence-based opportunity.
🔵 BONUS: HOW TO ENHANCE CONFLUENCE
Add price action patterns (flags, wedges, breakouts)
Use support/resistance zones for cleaner entries
Combine with higher timeframe confirmation
Wait for retests after breakouts instead of chasing
Confluence doesn't mean complexity — it means clarity.
🔵 CONCLUSION
The best traders don’t guess. They wait for the market to align. By combining trend, momentum, and volume, you filter out weak setups and focus only on the highest-probability trades.
Start testing confluence-based setups in your strategy. You’ll likely find more consistency, fewer fakeouts, and greater confidence in your execution.
Do you trade with confluence? What’s your favorite trio of indicators? Let’s talk in the comments.
BYCUSDTHello Traders! 👋
What are your thoughts on Bitcoin?
Bitcoin has broken above its descending trendline and formed a new higher high. The price is now in a consolidation phase, taking a short pause after the breakout.
We expect the bullish trend to remain intact. After a pullback to the broken trendline and some consolidation in the support zone, Bitcoin is likely to resume its upward move toward higher levels and new all-time highs.
The overall market structure remains bullish, and this consolidation phase could present a buy-the-dip opportunity.
Is Bitcoin ready for the next leg higher, or will the pullback go deeper? Share your view below! 🤔👇
Don’t forget to like and share your thoughts in the comments! ❤️
Skeptic | Why did Bitcoin grow? What’s the next move?Unemployment rate’s up...
lemme explain short and sweet. When unemployment —a key factor for setting interest rates —rises, the Federal Reserve’s got no choice but to lower rates so companies can hire. Lower rates = more liquidity = Bitcoin and stocks go up.
What’s the next move?
Around $ 120,000 , there’s about 1 billion in short liquidity positions. also it overlaps with the weekly pivot point level 4 . I see a high chance of correction or ranging here. Personally, I opened a position before the $ 110,513 breakout ( i shared in this analysis ) and only took profits. If you’re still holding, I suggest not closing yet—once the $ 110,000 resistance broke, Bitcoin’s major weekly trend woke up, so we could see more growth.
If this analysis helped you, hit that boost—it fuels my mission! 😊 Stay disciplined, fam! ✌️
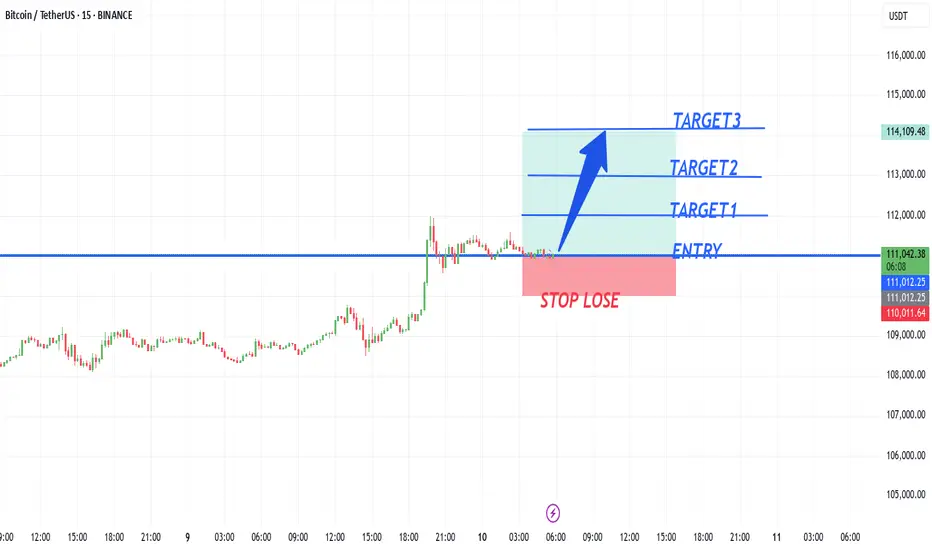
BTCUSD NEW LOOKBtcusd buy from 111,000,
target1 112,000
target2 113,000
target3 114,000
Stope lose 110,000
TRADE AT YOUR OWN RISK
bitcoin targets in 1h timeframeBased on the price structure created and the price trend, I have identified a possible target for Bitcoin. Let's see what happens.
BTCUSDTHi everyone
nice move , yeah!
here are the levels that you can consider in your trading.
In my opinion every correction could be a good opportunity to buy.
have fun
DYOR!

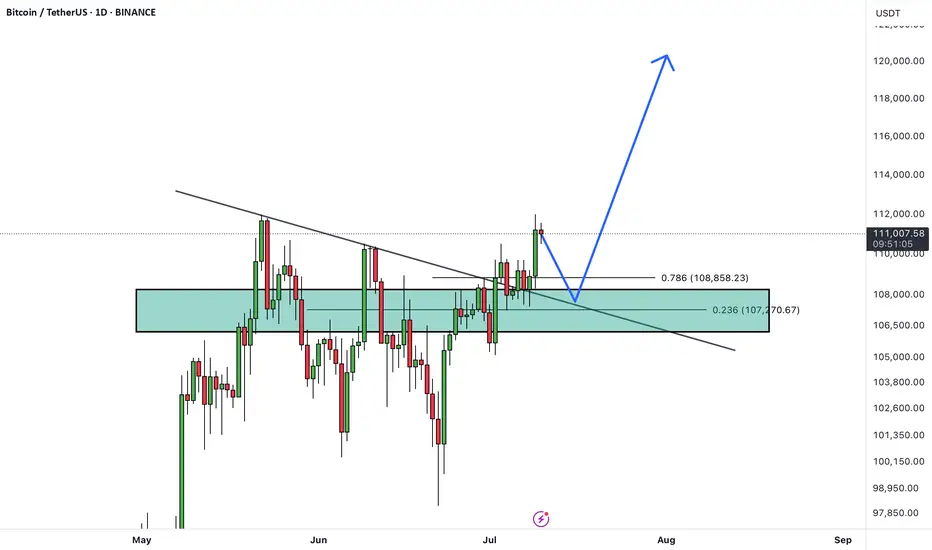
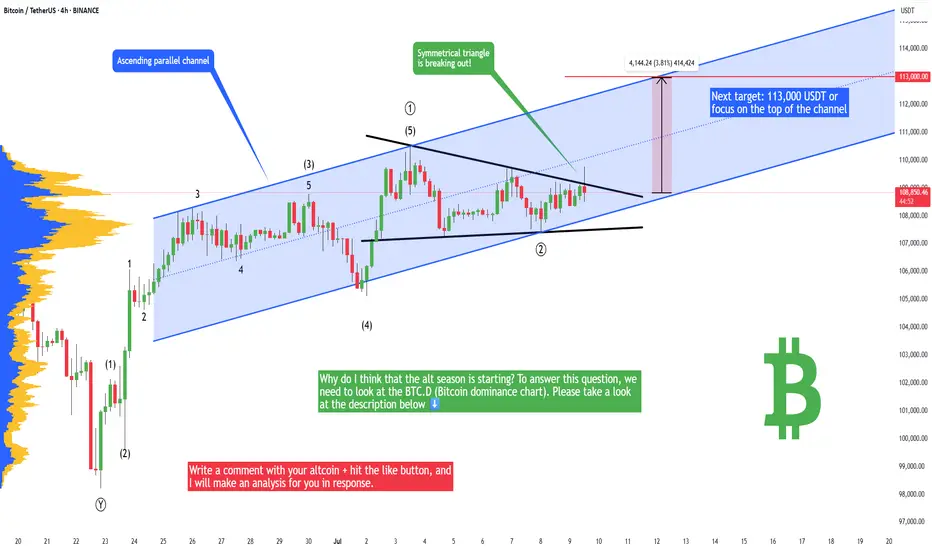
Bitcoin - Ready for a new all time high! + ALT SEASON startingBitcoin is breaking out of the symmetrical triangle and showing major signs of strength, so we can expect to hit a new all-time high in the short term! Bitcoin was struggling in the past weeks compared to the stock market, but this should end!
Why do I think that the alt season is starting? To answer this question, we need to look at the BTC.D (Bitcoin dominance chart). if BTC.D goes up, that means money is flowing out of altcoins to Bitcoin, and when BTC.D goes down, that means money is flowing from Bitcoin to altcoins. And we want BTC.D to go up! So what is the chart telling us?
First of all, this is not exactly BTC.D on TradingView, but this is BTCDOMUSDT.P. I think this chart may give us a better outlook on the dominance at the moment. So what we can see here is that the long-term trendline is breaking down, that's a pretty rare event.
That's definitely great news! Time to buy some altcoins and prepare for a bullish altcoin season. I would say forget about Bitcoin and a 5% profit; let's buy some altcoins, and I want you to tell me in the comment section, what altcoin do you believe in?
Write a comment with your altcoin + hit the like button, and I will make an analysis for you in response. Trading is not hard if you have a good coach! This is not a trade setup, as there is no stop-loss or profit target. I share my trades privately. Thank you, and I wish you successful trades! Trading tip at the end: Learn to bear losses - A trader needs to accept the losses to maintain their emotional stability. Losses are a crucial internal part of trading that helps traders to learn how to grow from their losses. Traders learn from losses and implement required changes in their strategies for better results in future trades.
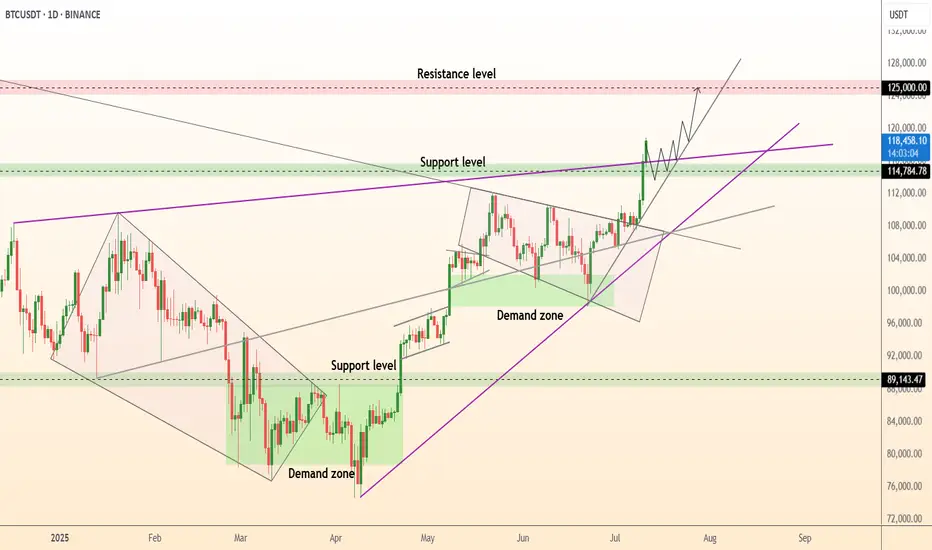
DeGRAM | BTCUSD ATH📊 Technical Analysis
● Daily close above the purple 2-month trend-cap and 114.8 k horizontal flips both into support, confirming the grey ascending triangle break.
● Measured move and channel geometry aim at the 125 k supply band; higher-lows keep bulls in control while risk is contained by the 107 k–109 k demand shelf (confluence of mid-line and former wedge top).
💡 Fundamental Analysis
● Spot-ETF net inflows (>10 k BTC since 8 Jul) and stable miner balances signal shrinking sell pressure, while softer US CPI has pushed real yields to 3-week lows—reviving crypto bid.
✨ Summary
Long 109–112 k; hold above 114.8 k targets 120 k → 125 k. Invalidate on a daily close below 107 k.
-------------------
Share your opinion in the comments and support the idea with a like. Thanks for your support!
Bitcoin Critical AreaSo we see after flag breakout and auto pump to 118k, but we must pay attention in mega trendline from December 2024 and decision is in this week
if we close above 119k maybe we will see 121k
but maybe whale can doing wick fakeout (?)
